
Blood Pressure Monitoring Devices Market Size and Share
Market Overview
| Study Period | 2020 - 2031 |
|---|---|
| Market Size (2026) | USD 5.93 Billion |
| Market Size (2031) | USD 9.61 Billion |
| Growth Rate (2026 - 2031) | 10.15 % |
| Fastest Growing Market | Asia-Pacific |
| Largest Market | North America |
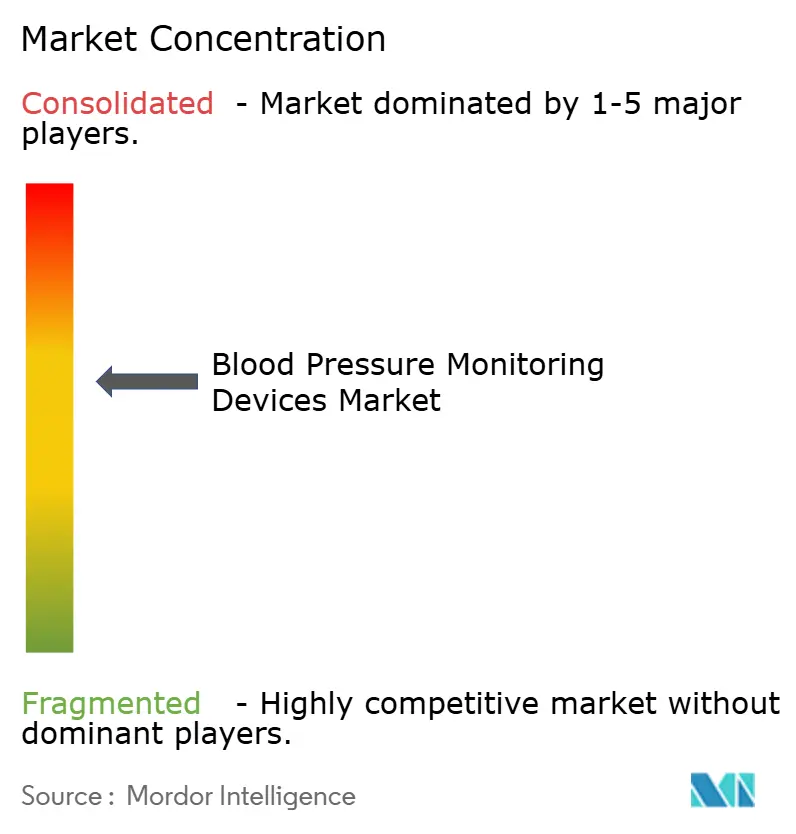
| Market Concentration | Medium |
Major Players *Disclaimer: Major Players sorted in no particular order Image © Mordor Intelligence. Reuse requires attribution under CC BY 4.0. | |
Blood Pressure Monitoring Devices Market Analysis by Mordor Intelligence
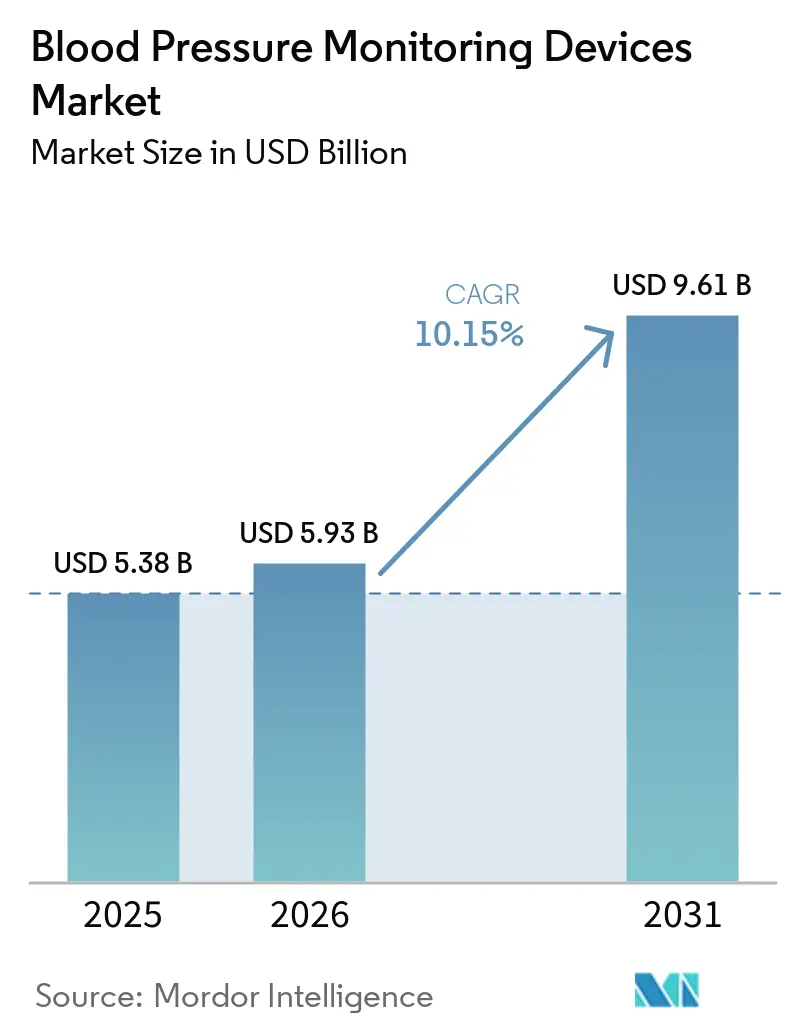
Blood Pressure Monitoring Devices market size in 2026 is estimated at USD 5.93 billion, growing from 2025 value of USD 5.38 billion with 2031 projections showing USD 9.61 billion, growing at 10.15% CAGR over 2026-2031.
Robust demand arises from the convergence of conventional cuffs with connected-care ecosystems, which shifts cardiovascular care from episodic checks to continuous oversight. Widespread preventive-care policies, payer reimbursement for remote patient monitoring, and stronger accuracy standards for cuffless wearables jointly sustain market expansion. At the same time, tariff-driven supply chain reviews and tighter approval rules reshape procurement strategies toward resilient and locally compliant suppliers. The blood pressure monitoring devices market therefore grows through parallel forces of technological progress and regulatory adaptation.
Key Report Takeaways
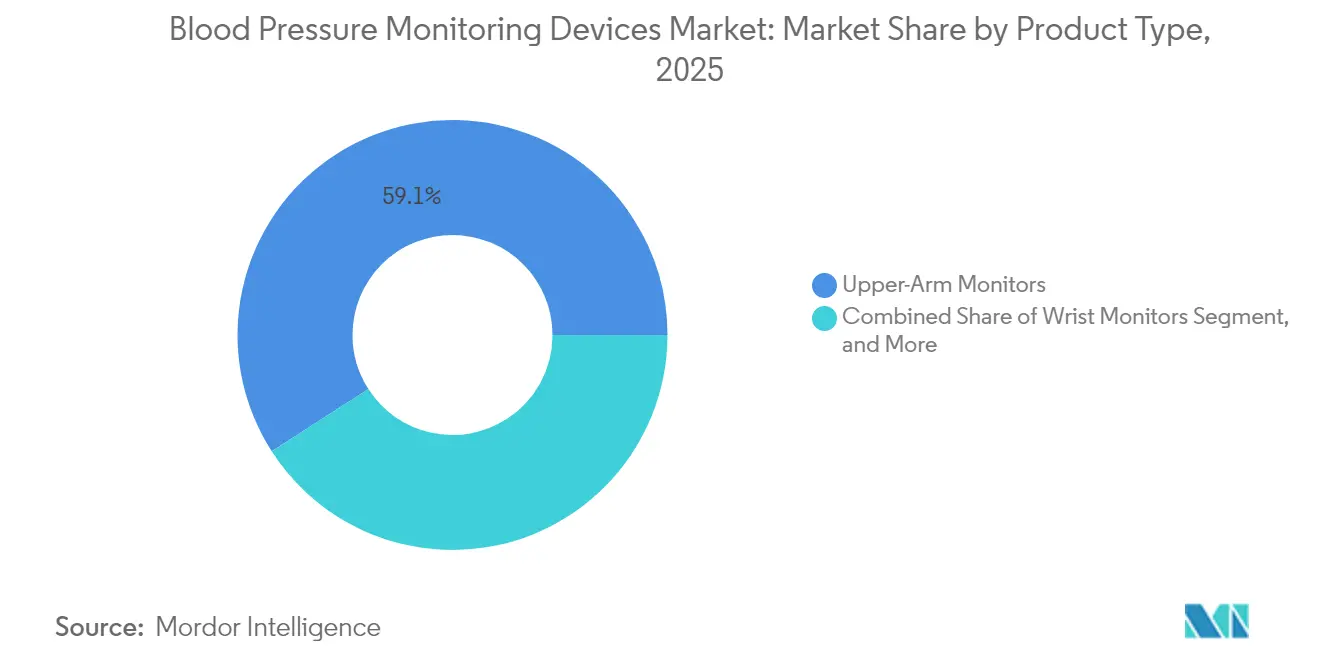
- By product type, upper-arm monitors led with 59.10% of the blood pressure monitoring devices market share in 2025, while cuffless wearables posted the fastest 12.07% CAGR to 2031.
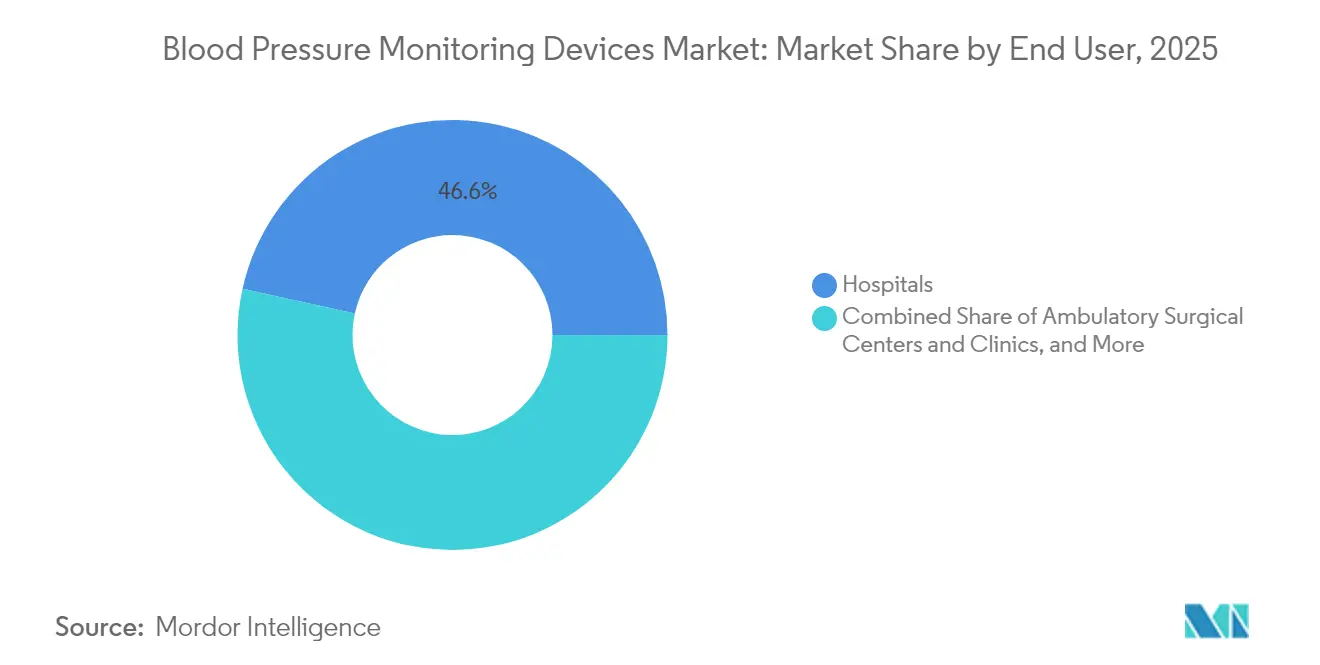
- By end user, hospitals held 46.55% of the blood pressure monitoring devices market share in 2025; meanwhile, home healthcare settings is projected to advance at a 11.05% CAGR from 2025 to 2031.
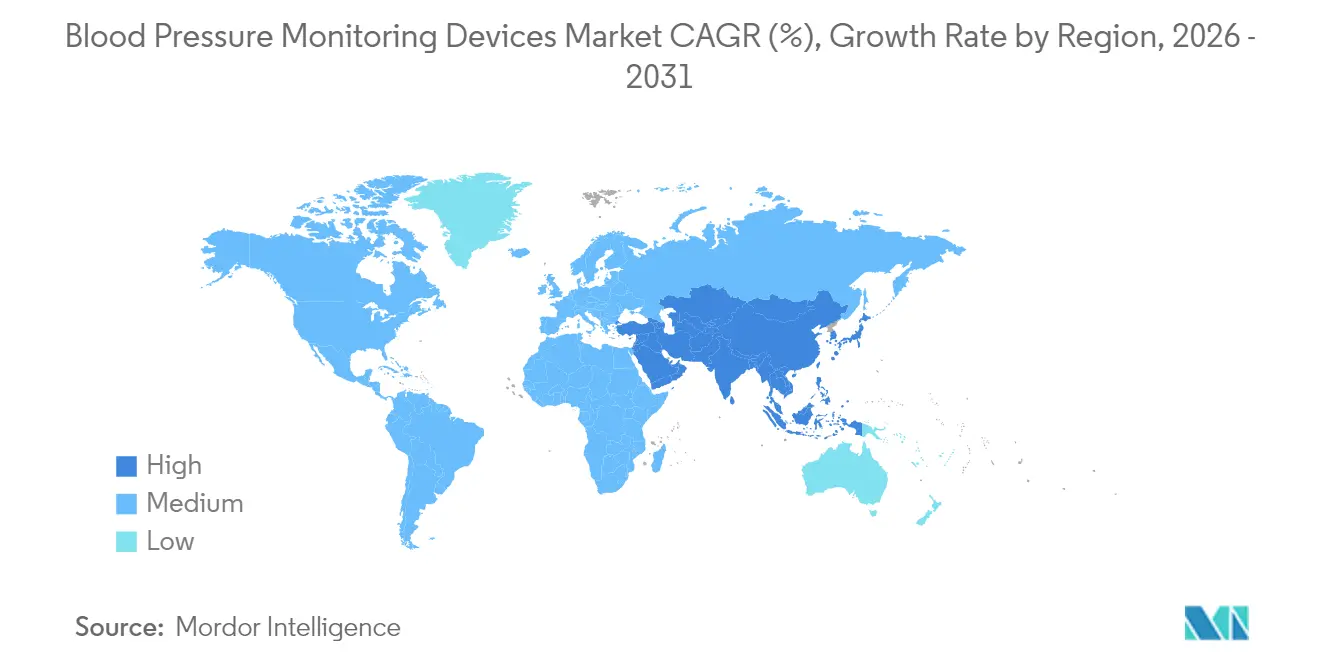
- By geography, North America dominated the market with a 35.20% revenue share in 2025, whereas the Asia-Pacific region is projected to expand at a 12.02% CAGR through 2031.
Note: Market size and forecast figures in this report are generated using Mordor Intelligence’s proprietary estimation framework, updated with the latest available data and insights as of 2026.
Global Blood Pressure Monitoring Devices Market Trends and Insights
Drivers Impact Analysis*
| Driver | (~) % Impact on CAGR Forecast | Geographic Relevance | Impact Timeline |
|---|---|---|---|
| Rising Prevalence of Hypertension and Cardiovascular Diseases | +3.2% | Global, with highest impact in North America & Asia-Pacific | Long term (≥ 4 years) |
| Technological Advancements in Cuffless Monitoring | +2.8% | North America & EU leading, APAC adoption accelerating | Medium term (2-4 years) |
| Increasing Adoption of Remote Patient Monitoring | +2.1% | North America & EU core, expanding to APAC | Medium term (2-4 years) |
| Growing Awareness of Home Healthcare Benefits | +1.7% | Global, with rural and aging population focus | Long term (≥ 4 years) |
| Aging Population Demographics | +1.4% | Global, with highest impact in developed economies | Long term (≥ 4 years) |
| Government Initiatives for Preventive Healthcare | +1.2% | APAC leading, North America & EU following | Medium term (2-4 years) |
| Source: Mordor Intelligence | |||
Rising Prevalence of Hypertension and Cardiovascular Diseases
Hypertension affects more than 1 billion people worldwide, and deaths attributable to elevated systolic pressure have continued to climb in absolute terms despite falling age-standardized rates. Screening programs inside large employers found that 17.6% of staff with no prior diagnosis register hypertensive readings, uncovering extensive silent disease pools. Health-system analyses show that early workplace detection boosted new hypertension diagnoses by 81% and raised antihypertensive prescriptions by 127%, confirming direct therapeutic value for continuous monitoring. These findings intensify procurement of scalable devices that work beyond clinics and drive the blood pressure monitoring devices market toward integrated solutions. They also reinforce payer interest in preventive benefits that offset future cardiovascular treatment costs.
Technological Advancements in Cuffless Monitoring
Cuffless blood pressure monitoring now sets the pace in product innovation. Nanowear’s SimpleSense-BP received FDA 510(k) clearance in 2024 as the first non-invasive continuous system, validating nanotechnology and AI analytics in routine hypertension care. Apple secured a patent for liquid-filled sensors that could bring medical-grade accuracy to future Apple Watch models, signaling Big-Tech entry into regulated cardiovascular wearables. Academic teams at Caltech introduced resonance sonomanometry, which uses sound waves plus ultrasound to generate full waveform readings without arterial lines. Each breakthrough raises expectations for real-time trend analysis, data portability, and patient comfort, fueling premium demand inside the blood pressure monitoring devices market.
Increasing Adoption of Remote Patient Monitoring
Medicare’s 2025 schedule pays providers USD 22.25 for RPM onboarding and USD 49.04 for monthly management when patients transmit at least sixteen readings every 30 days. Health systems, such as NYU Langone, have demonstrated returns of 22.2% on RPM-hypertension programs with 55% adherence, confirming financial sustainability.These reimbursement assurances encourage health networks to roll out remote panels that combine analytics dashboards with home blood pressure monitoring devices, driving recurring volume in the blood pressure monitoring devices market. These reimbursement assurances encourage health networks to roll out remote panels that combine analytics dashboards with home units, driving recurring volume in the blood pressure monitoring devices market.
Growing Awareness of Home Healthcare Benefits
Consumer preference for home-based care persists beyond the pandemic era. Clinical validation studies across Asia found that 68.2% of patients kept morning systolic pressure within goals through home self-measurement compared with 55.5% under clinic checks. Withings launched the BPM Vision at USD150, featuring a color display and Wi-Fi sync, demonstrating how consumer-grade pricing can coexist with FDA-ready performance. National prevention guidelines from the CDC now recommend that employers integrate validated home monitors into their wellness programs. As confidence grows in at-home accuracy, procurement budgets tilt toward smart devices that extend monitoring beyond hospital walls, expanding the blood pressure monitoring devices market
Restraints Impact Analysis*
| Restraint | (~) % Impact on CAGR Forecast | Geographic Relevance | Impact Timeline |
|---|---|---|---|
| Regulatory Approval Complexities for Innovative Devices | -1.8% | Global, with highest impact in EU & FDA jurisdictions | Medium term (2-4 years) |
| High Costs of Advanced Monitoring Technologies | -1.3% | Emerging markets primarily, cost-sensitive segments | Short term (≤ 2 years) |
| Accuracy Concerns with Cuffless Devices | -1.1% | Global, clinical adoption barriers | Medium term (2-4 years) |
| Data Privacy and Security Concerns | -0.9% | EU & North America primarily, expanding globally | Medium term (2-4 years) |
| Source: Mordor Intelligence | |||
Regulatory Approval Complexities for Innovative Devices
Validation protocols for cuffless devices remain in flux. The FDA recognized IEEE 1708-2014 but flagged certain observer-training clauses as incompatible with automated workflows, creating partial guidance only. Multicenter trials revealed that some optical wearables under-perform against ambulatory monitors, particularly after medication titrations, which slows payer adoption. Pediatric use requires separate 3-to-12-year trials, adding cost layers that deter smaller innovators. As a result, time-to-market elongates and compliance expenditure rises, applying a brake to the blood pressure monitoring devices market.
High Costs of Advanced Monitoring Technologies
Premium pricing for cuffless wearables poses barriers in cost-sensitive regions. Tariffs currently affect 70% of imported medical devices into the United States, forcing providers to lock in early contracts or pivot to domestic lines. Budget impact analyses show RPM programs break even only when compliance exceeds 55%, linking affordability to sustained utilization. Consequently, hospitals in lower-income geographies often favor mid-range digital cuffs rather than high-end optical devices, tempering upside in segments of the blood pressure monitoring devices market.
*Our forecasts treat driver/restraint impacts as directional, not additive. The impact forecasts reflect baseline growth, mix effects, and variable interactions.
Segment Analysis
By Product Type: Digital Dominance Meets Cuffless Innovation
The upper-arm monitors category controlled 59.10% of the blood pressure monitoring devices market share in 2025, reflecting entrenched clinical confidence in oscillometric cuffs. Nevertheless, cuffless wearables are advancing at a 12.07% CAGR through 2031, translating into a fast-rising portion of the blood pressure monitoring devices market size for this segment. Hospitals and insurers are increasingly recognizing the importance of continuous waveform capture for managing nocturnal hypertension, which favors optoelectronic patches and smartwatches. Nanowear’s FDA-cleared SimpleSense-BP underscored this pivot by demonstrating real-world accuracy without inflation cycles, while Apple’s patent pipeline illustrates mainstream consumer potential.
Demand for ambulatory monitors also persists as clinicians prescribe 24-hour profiles to confirm white-coat or masked hypertension. SunTech Medical’s takeover of Meditech consolidated expertise that targets this niche, adding software that automates reporting into electronic records. Meanwhile, aneroid sphygmomanometers retreat as facilities modernize. Digital wrist cuffs benefit from comfort-driven upgrades though remain secondary in most guidelines. The overall competitive dynamic therefore hinges on balancing physicians’ insistence on validation with patients’ desire for unobtrusive wear, a balance that shapes long-run volume in the blood pressure monitoring devices market.

By End User: Hospital Leadership Yields to Home Healthcare Growth
Hospitals retained 46.55% of blood pressure monitoring devices market share in 2025 because acute settings still initiate diagnosis and titration protocols cms.gov. Yet home healthcare leads expansion at 11.05% CAGR to 2031, swelling the blood pressure monitoring devices market size for domiciliary channels. Medicare’s reimbursement of USD 49.04 monthly for RPM follow-up provides stable economics for health systems that ship pre-configured kits. NYU Langone’s RPM-HTN program realized a 22.2% investment return at USD 330 per patient and 55% adherence, highlighting profit potential in scaled home rollouts.
Ambulatory surgical centers and outpatient clinics upgrade to integrated vital-sign platforms that auto-document into electronic health records, cutting manual chart-time. Workplace and fitness centers represent emerging micro-channels as corporate wellness teams adopt validated devices to flag silent hypertension among employees. These decentralization trends redistribute procurement away from single-site bulk orders toward dispersed multi-stakeholder demand, enlarging the blood pressure monitoring devices market while diversifying service models inside the industry.
Geography Analysis
North America accounted for 35.20% of 2025 revenues, supported by advanced infrastructure and well-defined billing codes that facilitate remote monitoring. The region nonetheless examines supply resilience after tariffs disrupted 70% of inbound medical device volumes, prompting buyers to certify supplier origin and consider near-shoring options. Canada and Mexico boost regional momentum through e-health funding and cross-border regulatory alignment that shortens clearance timelines. These conditions sustain the blood pressure monitoring devices market, but they also promote investment in dual-sourced components.
The Asia-Pacific region delivers the swiftest growth at a 12.02% CAGR to 2031, reflecting demographic aging, hypertension prevalence, and an active policy that accelerates device approvals. China’s National Medical Products Administration cleared 61 innovative medical devices in 2023, representing an 11% year-over-year increase, under an accelerated pathway that prioritizes high-impact technologies. India projects its medical device sector to grow from USD 5.2 billion to USD 50 billion by 2030, driven by production-linked incentives and a single-window approval system. These reforms, together with local manufacturing grants, expand domestic supply and lower pricing, thereby broadening the regional market for blood pressure monitoring devices.
Europe benefits from entrenched universal healthcare that values validated accuracy. Adoption spreads as country panels harmonize cuffless performance requirements across notified bodies, giving innovators a predictable dossier route. Brazil, through ANVISA, now accepts FDA or TGA approvals to streamline entry, exemplifying regulatory convergence that also influences other Latin American markets. Additionally, the Pan American Health Organization’s HEARTS program mandates the exclusive use of validated monitors in primary care by 2025, fostering quality benchmarks across South America. Middle Eastern and African nations are allocating increasing capital to chronic disease management, installing telehealth hubs that integrate validated blood pressure monitoring modules. Across these varied geographies, policy alignment and disease burden continue to underpin the global expansion of the blood pressure monitoring devices market.
Regulatory Landscape
Regulatory requirements for blood pressure monitoring devices continue to tighten around clinical validation, labeling claims, and post-market evidence, with heightened scrutiny for cuffless technologies. In the United States, the FDA issued draft guidance on January 23, 2026, titled "Cuffless Non-invasive Blood Pressure Measuring Devices: Clinical Performance Testing and Evaluation" (Docket FDA-2025-D-0851). The draft outlines recommended clinical performance testing to support premarket submissions for cuffless BP devices and helps standardize evidence packages beyond legacy oscillometric cuffs.
In Europe, the blood pressure monitoring devices market operates under the Medical Device Regulation (EU MDR), with changes aimed at improving the consistency of conformity assessments. The European Commission adopted Implementing Regulation (EU) 2026/977 on May 5, 2026, establishing common operational rules for Notified Bodies under the MDR and IVDR, which is a practical anchor for manufacturers managing CE marking timelines and documentation expectations. For standards, ISO 81060-2 remains central for intermittent non-invasive sphygmomanometer clinical investigation, while ISO 81060-2:2018/Amd 2:2024 (published March 2024) and the registration of ISO/DIS 81060-2 in April 2026 point to active updates to accuracy and test-method expectations used across multiple regulator and payer pathways.
Value Chain Analysis
The value chain spans component suppliers (pressure sensors, pumps/valves for cuffs, MEMS and optical sensors for wearables, microcontrollers, Bluetooth/Wi-Fi modules, batteries), device OEMs and contract manufacturers (assembly, calibration, quality systems), clinical validation partners (sites running comparison studies against reference standards), and downstream channels including hospitals, clinics, home-care providers, retail/e-commerce, and RPM program operators. As the industry shifts from episodic cuff readings to connected and cuffless monitoring, software layers (device apps, data pipelines, analytics dashboards, and EHR integration) increasingly shape differentiation, while clinical evidence generation and regulatory documentation function as gating steps between engineering and commercialization.
Recent inputs include tariff-driven sourcing reviews and regionalization efforts, alongside standardization momentum that feeds into design controls and validation plans. The FDA draft guidance issued in January 2026 (Docket FDA-2025-D-0851) codifies expectations for cuffless clinical performance testing, while IEEE 1708-2025 (published April 2026) provides validation guidelines for wearable, cuffless BP devices. Company actions also show upstream-to-downstream coupling: Biozen received FDA 510(k) clearance in May 2026 for its BP1000 calibration-free, cuffless fingertip device, and Vital Signals introduced the Signal Ring in July 2026 as a cuffless, calibration-free wearable. These sensor modalities pull in additional suppliers for miniaturized sensing and embedded compute, while clinical and regulatory partners continue to play a larger role before scale distribution can follow.
Competitive Landscape
The blood pressure monitoring devices market is moderately fragmented yet dynamic. Omron remains the leading brand, with more than 350 million units sold globally, and has recently received FDA De Novo clearance for its AI-enabled atrial fibrillation detection device, which exhibits 95% sensitivity and 98% specificity. The firm capitalizes on its NightView wrist monitor, which measures nocturnal blood pressure to meet emerging guideline demands. Philips and GE HealthCare integrate multi-parameter platforms that combine cuff modules with predictive analytics, embedding the blood pressure monitoring devices industry into hospital network upgrades.
Strategic deals accelerate capability bundling. BD acquired Edwards Lifesciences’ Critical Care portfolio for USD 4.2 billion, granting access to smart pressure sensors present in more than 10,000 hospitals.[3] Additionally, SunTech Medical acquired Meditech to enhance its ambulatory specialism, while Spacelabs partnered with Masimo to integrate advanced optical metrics. Emerging challengers such as Nanowear and Aktiia focus solely on cuffless and calibration-free designs, targeting segments where convenience outweighs the benefits of traditional cuffs.
White-space opportunities exist in pediatric validation, enterprise wellness, and data-as-a-service layers that monetize continuous streams. Firms that secure broad-age validation and cybersecurity compliance stand to capture premium contracts. Overall, top players guard legacy volume but face steady share migration toward innovators, ensuring competitive tension that propels the blood pressure monitoring devices market.
Blood Pressure Monitoring Devices Industry Leaders
-
A&D Medical Inc.
-
American Diagnostics Corporation
-
Withings
-
GE Healthcare
-
Omron Healthcare
- *Disclaimer: Major Players sorted in no particular order
Market Opportunities and Future Outlook
Opportunities in the blood pressure monitoring devices market increasingly concentrate in programs that connect validated home devices to ongoing clinical management, rather than one-time hardware replacement cycles. Reimbursement-linked RPM workflows are already anchored by Medicare payment for onboarding and monthly management (with the requirement to transmit at least sixteen readings every 30 days), and health systems such as NYU Langone have shown program-level economics with positive returns alongside measured adherence. This supports whitespace for vendors that can ship pre-configured kits, simplify patient onboarding, and integrate device data into clinician dashboards with audit-ready documentation.
A second opportunity is clinically validated cuffless and contact-less measurement that can expand monitoring frequency and comfort, provided devices meet evolving regulatory and standards requirements. The FDA draft guidance released on January 23, 2026 for cuffless non-invasive BP devices (Docket FDA-2025-D-0851), together with active updates around ISO 81060-2 (including ISO 81060-2:2018/Amd 2:2024 and the ISO/DIS 81060-2 activity registered in April 2026), is pushing the market toward clearer evidence frameworks for next-generation devices. On the technology side, published 2026 research includes proof-of-concept systems such as AI-enabled mmWave radar for contact-less diastolic estimation aligned to FDA-recognized AAMI guideline thresholds, and wearable force-sensing finger-clip approaches validated against intra-arterial references to ISO 81060-2:2018 accuracy specifications. Together, these developments indicate a pipeline of modalities manufacturers can translate into regulated products when paired with multi-site validation, cybersecurity controls, and clear claim language.
Recent Industry Developments
- June 2026: OMRON Healthcare announced a randomized controlled trial with the University of California, San Francisco (UCSF) to evaluate a new model for early atrial fibrillation detection in hypertension patients using home blood pressure monitoring. The OMRON-AF study targets enrollment of about 1,900 participants. It reinforces the shift toward extracting additional clinical signals from routine BP measurements and strengthening evidence for home-based workflows.
- April 2026: Withings launched BodyFit for at-home body composition tracking with a retractable handle and 6-zone segmental analysis. The product adds the scale as a broader cardiovascular wellness hub that also surfaces blood pressure-related insights. The rollout includes US availability from June 2, 2026, with Europe/UK following, reflecting continued convergence between consumer home-health hardware and connected-care ecosystems that influence device selection and engagement.
- April 2025: Withings introduced BPM Vision at USD 149.95 following FDA clearance, adding a color display and Wi-Fi synchronization to support simplified at-home measurement and data sharing. The launch strengthened the mid-priced connected upper-arm monitor segment and supported provider and employer programs that rely on validated home devices.
Research Methodology Framework and Report Scope
Market Definition and Coverage
This market covers devices used to measure arterial blood pressure across clinical and home settings, including cuff-based monitors, ambulatory systems, and cuffless wearables, plus the essential accessories needed to complete a measurement cycle. Values are tracked in USD at the manufacturer selling price across major regions.
Scope exclusions: We exclude invasive catheter based pressure monitoring setups and stand-alone software platforms that are not sold as part of a blood pressure measuring device.
Segmentation Overview
- By Product Type
- Upper Arm Monitors
- Wrist Monitors
- Ambulatory BP Monitors
- Cuffless Wearables
- Accessories (Cuffs & Others)
- By End User
- Hospitals
- Ambulatory Surgical Centers & Clinics
- Home Healthcare Settings
- Other End Users
- By Geography
- North America
- United States
- Canada
- Mexico
- Europe
- Germany
- United Kingdom
- France
- Italy
- Spain
- Rest of Europe
- Asia-Pacific
- China
- Japan
- India
- South Korea
- Australia
- Rest of Asia-Pacific
- Middle East and Africa
- GCC
- South Africa
- Rest of Middle East and Africa
- South America
- Brazil
- Argentina
- Rest of South America
- North America
Data Sources, Market Sizing, and Validation
Desk Research
Desk research builds the base structure of the market model by clarifying what products are counted, where they are used, and how demand is created. We primarily used public health and medical device references, such as the World Health Organization for hypertension burden signals, the US CDC for population-level cardiovascular indicators, and the FDA database for product clearances, which helps indicate technology direction and clearance cadence.
To keep the sizing grounded, we also reviewed sources such as OECD health statistics for care setting utilization patterns, peer-reviewed cardiology and hypertension journals for measurement practice changes, and national statistics and customs releases where available for broad device trade signals. These were complemented with company filings, investor presentations, and reputable press coverage to understand mix shifts across home monitoring, ambulatory use, and wearables. In a few cases, paid subscriptions for company financials and patent databases were used to fill gaps for smaller entities and to map innovation timelines. The source list above is illustrative, and we also checked other public and proprietary references for data collection, validation, and clarification.
Primary Interviews and Surveys
Primary work was used to pressure-test what we saw in desk research, especially around price bands, replacement cycles, and which channels are gaining share. We spoke with a mix of device manufacturers, distributors, and care delivery stakeholders, then validated the assumptions with clinical users and procurement-oriented roles across key regions, so the final model reflects real buying behavior rather than published statements alone.
Distribution of primary research fieldwork respondents
| Company type | Respondent position | Region |
|---|---|---|
| Top tier: 26% | CXOs: 14% | APAC: 44% |
| Mid tier: 59% | Functional/Unit leaders: 34% | EMEA: 37% |
| Smaller Players: 15% | Managers: 52% | Americas: 19% |
Market-Sizing & Forecasting
Sizing starts with a top-down build where hypertension monitoring demand is reconstructed using population burden signals, care pathway intensity, and the share of patients monitored in home, ambulatory, and facility settings. Those demand pools are then translated into device value using average selling price ranges by device format and expected replacement behavior, and we adjust those conversions when procurement patterns differ across regions.
To avoid overreliance on one lens, we cross-check with selective bottom-up approximations, such as rolling up sampled supplier revenues by product family, channel checks on unit movement, and ASP times unit sanity checks for key device formats. The model uses repeatable inputs, including hypertension prevalence and diagnosis trends, penetration of home blood pressure monitoring, share shift between upper-arm and wrist devices, ambulatory monitoring usage in clinics, and ASP progression tied to feature adoption (connectivity and cuffless form factors). Where company-level splits are not disclosed, we apply conservative allocation rules based on product mix cues and interview feedback, then reconcile totals back to macro demand signals.
Forecasting uses scenario analysis supported by expert consensus, since adoption rates for wearables and home monitoring can shift faster or slower depending on guidelines, reimbursement, and consumer uptake. We review assumptions by region so growth is not overstated where affordability and channel reach remain limiting factors.
Data Validation & Update Cycle
Validation is done through multiple checks that look for mismatches between model outputs and independent signals, such as device clearance activity, visible product launches, and region-level healthcare utilization direction. When an input creates a sharp jump, we trace it back to the driver, re-check the source, and re-contact selected interviewees if the variance cannot be explained by a clear event.
Before sign-off, the work goes through an internal analyst review where assumptions, conversions, and year-to-year movements are re-tested for reasonableness. Reports are refreshed annually, and interim updates are triggered when material events occur, such as major regulatory shifts or meaningful pricing and channel changes. Right before delivery, we run a final refresh pass so clients receive the latest updated view available at that time.
Mordor Intelligence's Blood Pressuee Monitoring Devices Market Size Measured Against Other Published Estimates
Published market values for blood pressure monitoring devices can vary even when they sound like they are measuring the same thing, since scope choices and pricing logic are not always consistent. Differences usually come from whether accessories are counted, how cuffless wearables are treated, what selling price point is used, and how quickly assumptions are refreshed when adoption changes.
A common gap driver is mixing related categories into the total, for example folding in broader patient monitoring equipment, remote patient monitoring service revenue, or non-device software subscriptions. Another frequent difference comes from the pricing basis, where some sources appear to use retail pricing or blended end-user spend, while others use manufacturer selling price, which changes the total even if unit demand is similar. The spread is also explained by how aggressively home monitoring and wearables penetration is forecast, and whether regional demand checks are applied to keep growth aligned with diagnosis, guideline use, and replacement behavior. The approach applied here includes accessory treatment and the manufacturer-price basis used by Mordor Intelligence.
Benchmark comparison
| Source | Market Size | Gaps in Research Methodology |
|---|---|---|
| Mordor Intelligence | USD 5.93 B (2026) | |
| Medical Device Dataset A | USD 2.50 B (2024) | Uses a narrower device-only definition that appears closer to automated BP monitors, and the value is anchored to earlier-year audited device revenue categories, which reduces inclusion of ambulatory systems, accessories, and newer cuffless formats. |
| Industry Report B | USD 3.70 B (2023) | Anchors the base on an earlier year and applies a mid single-digit growth profile, and it likely excludes accessory value and undercounts the shift toward connected home monitoring and wearable-led upgrades, which keeps the starting value lower. |
Across the three figures, the biggest takeaway is that year selection and product scope explain most of the gap, and the rest comes from pricing basis and adoption speed assumptions. By tying the value build to clear demand drivers (home monitoring penetration, ambulatory usage, and device replacement) and then checking outputs against supplier and channel signals, the final number stays transparent and repeatable for planning.
Key Questions Answered in the Report
What is the current size of the blood pressure monitoring devices market?
The blood pressure monitoring devices market size is USD 5.93 billion in 2026 and is expected to reach USD 9.61 billion by 2031.
Which product segment is growing the fastest?
Cuffless wearable monitors are expanding at a 12.07% CAGR, the highest among all product types through 2031.
Why is home healthcare gaining traction for blood pressure monitoring?
Medicare reimbursement of USD 49.04 per month for remote monitoring and proven ROI of 22.2% in hospital programs make home settings economically attractive.
Which is the fastest growing region in global blood pressure monitoring devices market?
Asia-Pacific is estimated to grow at the highest CAGR over the forecast period (2026-2031).
What are the primary regulatory hurdles for cuffless devices?
Partial FDA recognition of IEEE 1708-2014, accuracy validation gaps, and separate pediatric studies extend approval timelines and raise costs.