
Blood Disorder Therapeutics Market Size and Share
Market Overview
| Study Period | 2020 - 2031 |
|---|---|
| Forecast Data Period | 2026 - 2031 |
| Historical Data Period | 2020 - 2024 |
| Growth Rate | 6.13 % |
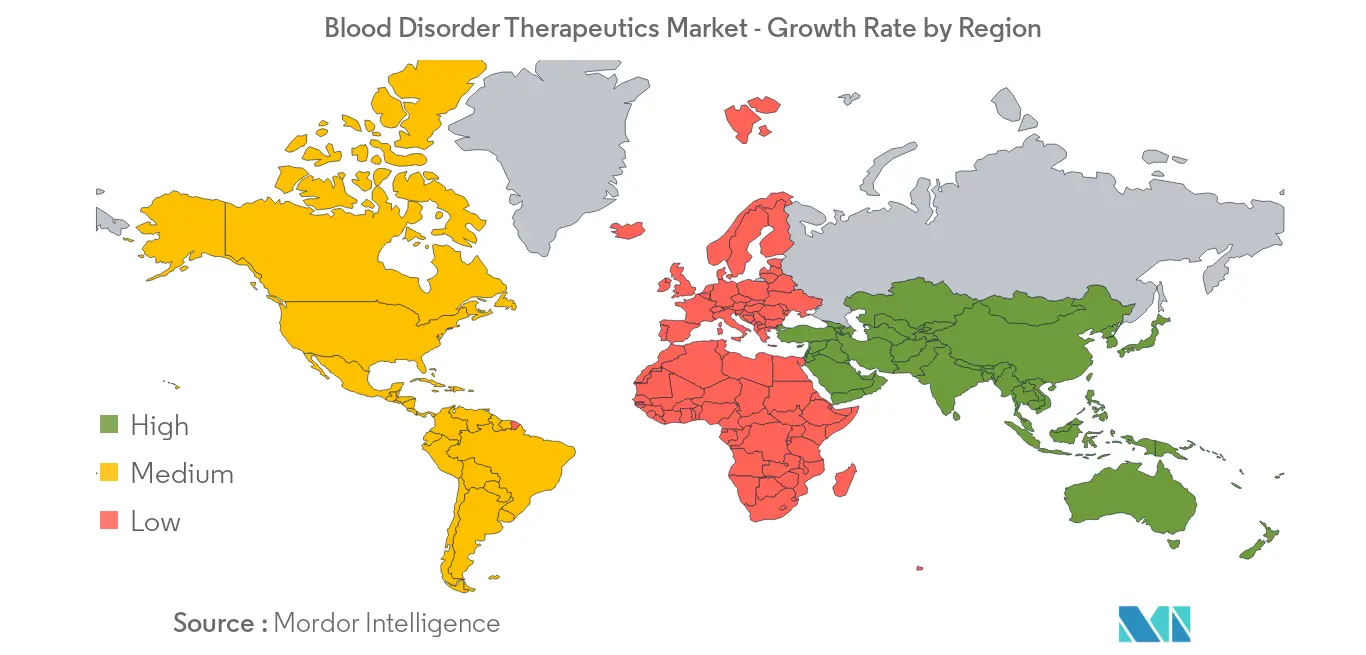
| Fastest Growing Market | Asia Pacific |
| Largest Market | North America |
Major Players *Disclaimer: Major Players sorted in no particular order Image © Mordor Intelligence. Reuse requires attribution under CC BY 4.0. | |
Blood Disorder Therapeutics Market Analysis by Mordor Intelligence
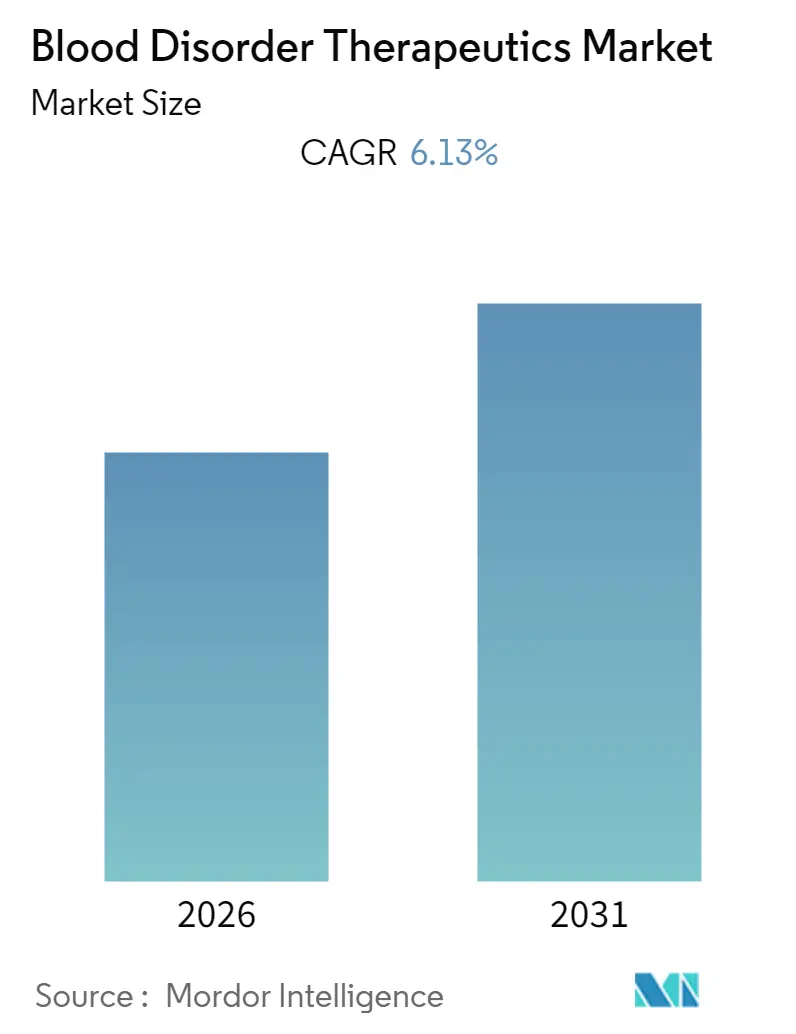
The Blood Disorder Therapeutics Market size is expected to register a CAGR of 6.13% during the forecast period (2026-2031).
Note: Market size and forecast figures in this report are generated using Mordor Intelligence’s proprietary estimation framework, updated with the latest available data and insights as of 2026.
Global Blood Disorder Therapeutics Market Trends and Insights
Recombinant Factors Segment is Expected to Hold a Significant Market Share in the Blood Disorder Therapeutics Market
- Worldwide, the rising prevalence of blood disorders and increasing adoption of recombinant factor concentrates are the key drivers of the recombinant factors segment.
- A recombinant factor is a form of blood factor that is manufactured via recombinant technology. Recombinant factors are used in the treatment of disorders such as hemophilia (prevention and control of hemorrhagic episodes).
- According to the World Federation of Hemophilia Report, in the year 2017, worldwide around 315,423 people are affected by bleeding disorders. Among them approximately 196,706 people are living with Hemophilia, 76,144 people with von Willebrand disease (VWD) and 42,573 with other bleeding disorders. Furthermore, according to the National Hemophilia Foundation, approximately 75% of people with hemophilia around the world still do not receive adequate treatment or have no access to treatment.
- Recombinant factors segment hold a significant market share by revenue and is anticipated to show steady growth over the forecast period due to the growing need to treat blood-related disorders and increase in production of recombinant products globally.
North America is Expected to Hold a Significant Share in the Market and Expected to do Same in the Forecast Period
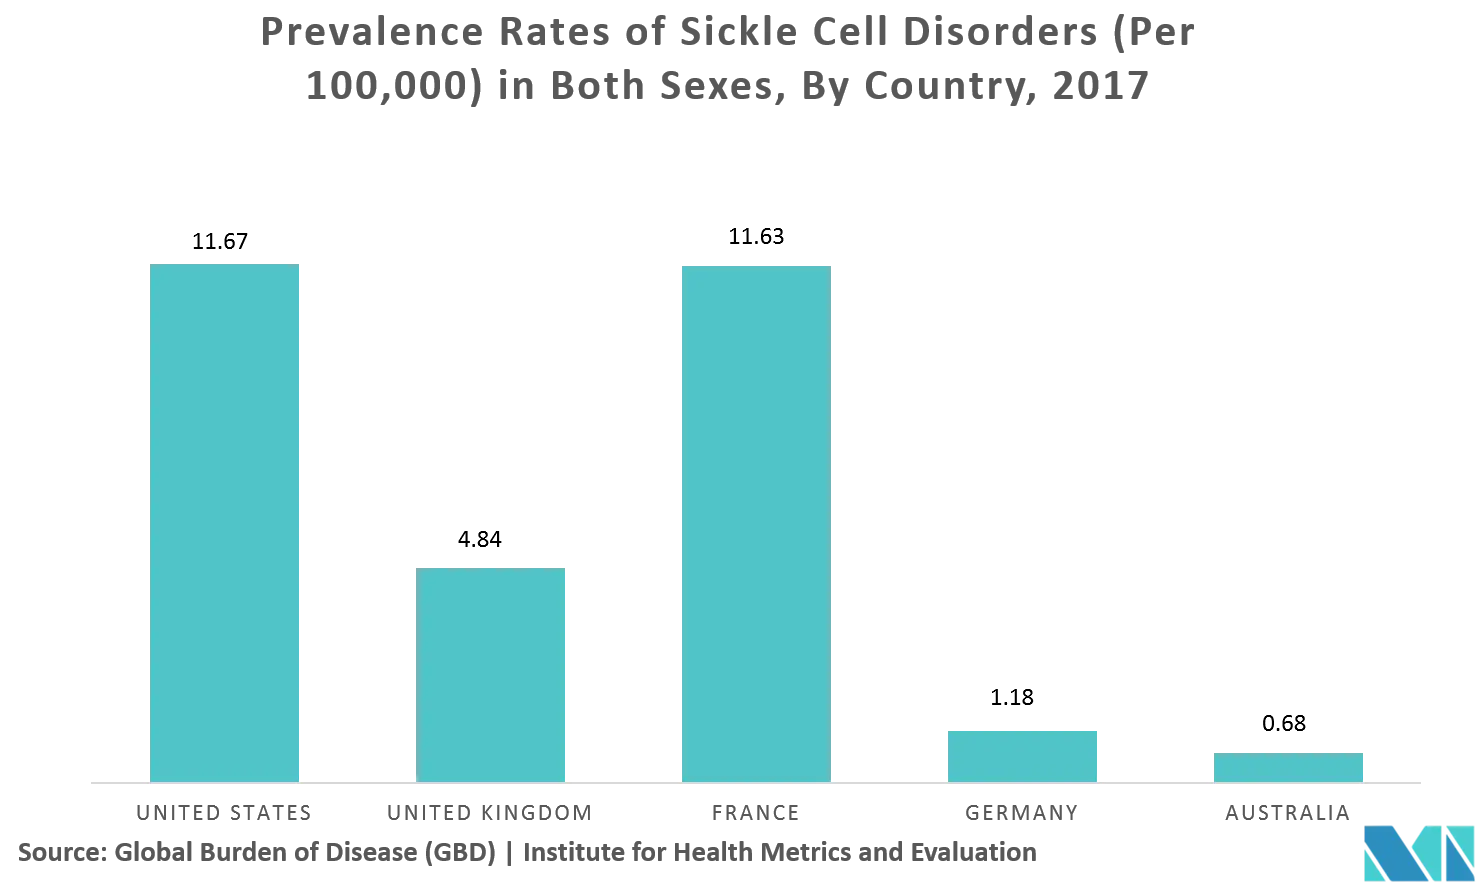
North America expected to hold a major market share in the blood disorder therapeutics market due to rising prevalence of various blood disorders and increasing awareness among the patient population in this region. According to the World Federation of Hemophilia, in the United States alone there are around 18 thousand people with hemophilia and over 11 thousand with von Willebrand disease. In addition, Hemophilia A affects 1 in 5,000 male births and approximately 400 babies are born with hemophilia A each year. Furthermore, increasing investments in research and development to develop treatment options for blood disorders and the presence of well-established healthcare infrastructure is also fueling the growth of the overall regional market to a large extent.
Regulatory Landscape
Regulation for blood disorder therapeutics spans small molecules, biologics (including recombinant factors), and advanced therapies, with oversight anchored by the US Food and Drug Administration (FDA) and the European Medicines Agency (EMA). In the United States, hematology products continue to use expedited pathways and lifecycle label expansions. In 2026, the FDA expanded CASGEVY (exagamglogene autotemcel) to include patients aged 2 years and older with sickle cell disease or transfusion-dependent beta thalassemia, and the FDA accepted a supplemental NDA for mitapivat in sickle cell disease, with a PDUFA goal date of November 1, 2026.
For advanced therapies relevant to genetic hematology disorders, CBER maintains an active guidance pipeline. Its 2026 guidance agenda included 19 new and revised guidances in the Therapeutic Products category, supporting more standardized development and review expectations for cellular and gene therapies. In Europe, EMA orphan designation activity continues to shape incentives and development focus for rare hematologic conditions, including orphan designations granted in 2026 for myelofibrosis (EU/3/26/3222) and large granular lymphocytic leukaemia (EU/3/26/3212).
Competitive Landscape
The Blood Disorder Therapeutics Market is fragmented competitive and consists of several major players. In terms of market share, few of the major players are currently dominating the market. Some of the companies which are currently dominating the market are Takeda Pharmaceutical Company Limited (Shire Plc), Sanofi, Novo Nordisk A/S, CSL Ltd, Pfizer Inc, Bayer AG, Celgene Corporation, Alexion Pharmaceuticals, Inc, Amgen Inc and AstraZeneca Plc.
Blood Disorder Therapeutics Industry Leaders
-
Takeda Pharmaceutical Company Limited (Shire Plc)
-
Sanofi
-
Novo Nordisk A/S
-
CSL Ltd
-
Pfizer Inc
- *Disclaimer: Major Players sorted in no particular order

Market Opportunities and Future Outlook
Clinical and regulatory activity in 2026 points to commercial opportunities around lowering treatment burden and broadening access across pediatric and difficult-to-treat subgroups. FDA actions that reduced minimum ages for eligible patients, including the 2026 expansion of CASGEVY to patients aged 2 years and older, and the 2026 expanded FDA indication for Pfizer's HYMPAVZI to include additional inhibitor and pediatric populations, reinforce a market path for therapies that can show safety and usability in younger cohorts, where lifetime disease management can drive high cumulative infusion and monitoring demands.
A second opportunity area is targeted innovation beyond hemophilia into under-served platelet and plasma-related bleeding disorders and von Willebrand disease. Incyte's 2026 acquisition of Vega Therapeutics added VGA039 (latarcibart), a monoclonal antibody program in Phase 3 for von Willebrand disease, illustrating strategic appetite for differentiated assets in specific bleeding-disorder niches. In parallel, late-stage and long-term data presented in 2026 for subcutaneous prophylaxis programs such as Novo Nordisk's denecimig (Mim8), along with clinical updates from Hemab Therapeutics (sutacimig in rare bleeding disorders), indicate continued development emphasis on less invasive administration routes that can reduce dependence on frequent intravenous factor replacement.
Recent Industry Developments
- July 2026: The US FDA expanded the indication for Vertex Pharmaceuticals' CASGEVY (exagamglogene autotemcel) to include patients aged 2 years and older with sickle cell disease or transfusion-dependent beta thalassemia. The label expansion broadens the addressable pediatric population for a one-time gene editing therapy and increases competitive pressure on chronic drug regimens in genetic hematology disorders.
- June 2026: Pfizer reported that the US FDA approved an expanded indication for HYMPAVZI (marstacimab-hncq) for hemophilia A or B, extending use into additional inhibitor and pediatric settings. The update strengthens adoption potential for subcutaneous prophylaxis and supports a shift away from high-frequency intravenous factor replacement in eligible patients.
- March 2025: Sanofi announced a blood-disorder therapeutics focused development update that advanced its clinical agenda in hematology. Continued investment by a major incumbent reinforces competitive intensity across branded therapies and raises the bar for differentiation on efficacy, safety, and administration convenience.
Research Methodology Framework and Report Scope
Market Definition and Coverage
This market covers prescription therapeutics used to treat blood disorders, where treatment is aimed at correcting or managing abnormal blood cells, clotting, or related hematologic disease conditions in patients.
Scope exclusions: We exclude diagnostics, blood screening tests, routine transfusion services, and general hospital consumables that do not represent a therapeutic drug sale.
Segmentation Overview
- By Product Type
- Plasma Derived Factors
- Recombinant Factors
- Other Products
- By Application
- Hemoglobin Disorders
- Platelet Based Disorders
- Plasma Disorders
- Myeloproliferative Disorders
- Genetic Hematology Disorders
- Blood Cancers
- Other Application
- Geography
- North America
- United States
- Canada
- Mexico
- Europe
- Germany
- United Kingdom
- France
- Italy
- Spain
- Rest of Europe
- Asia-Pacific
- China
- Japan
- India
- Australia
- South Korea
- Rest of Asia-Pacific
- Middle-East and Africa
- GCC
- South Africa
- Rest of Middle-East and Africa
- South America
- Brazil
- Argentina
- Rest of South America
- North America
Data Sources, Market Sizing, and Validation
Desk Research
To build the first version of the demand and pricing picture, we start with public, non-paywalled references such as the US CDC, the US NIH and NLM resources, the WHO, and government health statistical portals that show disease burden and treatment access trends. We also use peer-reviewed clinical journals to understand therapy adoption shifts and how standard of care changes over time.
Next, we add structured company disclosures, such as annual reports, earnings decks, and regulatory press releases, to map key therapy classes and major launches. Supporting signals are taken from trade association publications and approved paid subscriptions for company financials and intelligence, patent databases, and import export shipment-level trade checks where relevant. The sources listed here are illustrative, and many other public references were also used for data collection, validation, and clarification during the work.
Primary Interviews and Surveys
Primary work is used to pressure test what we built from desk research, especially on treated patient pools, therapy switching patterns, and how pricing behaves after new approvals. We speak with a mix of manufacturers, distributors, hospital pharmacy stakeholders, hematology clinicians, and payor or reimbursement specialists across key regions so assumptions can be adjusted where the real world differs from published data.
Distribution of primary research fieldwork respondents
| Company type | Respondent position | Region |
|---|---|---|
| Top tier: 33% | CXOs: 16% | APAC: 43% |
| Mid tier: 51% | Functional/Unit leaders: 34% | EMEA: 32% |
| Smaller Players: 16% | Managers: 50% | Americas: 25% |
Market-Sizing & Forecasting
Our sizing model is built using a top-down approach where epidemiology and treated cohort logic are converted into annual therapy demand, which is then valued using price and utilization assumptions. To keep it realistic, the totals are then corroborated with selective bottom-up approximations, such as sampled therapy volumes by class and sanity checks on implied revenues versus public segment disclosures.
Key inputs that shape the model include the diagnosed and treated patient pool by major blood disorder groups, the share of patients on chronic therapy, average annual therapy duration, and the mix shift across established therapies and newer modalities. We also track launch timing, label expansions, and reimbursement access because they directly change uptake speed and average selling prices in a given year. For forecasting, scenario analysis is used so growth can be flexed around different adoption curves, and the final path is aligned to what experts consider a practical base case for patient access and payer behavior. Where bottom-up data is thin in smaller countries, the gap is handled through proxying from comparable markets using prevalence, treatment rate, and health spend indicators before being re-checked in interviews.
Data Validation & Update Cycle
Validation is done through triangulation across the model outputs, external disease and treatment indicators, and feedback from primary respondents, and then the variances are documented and reviewed. Outliers are investigated by checking units, currency timing, therapy mix, and whether one-off events (like a major approval or a supply disruption) temporarily changed demand.
Before sign-off, the work goes through a multi-step analyst review so assumptions, math, and year-to-year trends are consistent and explainable. Reports are refreshed annually, and interim updates are triggered when material events occur, such as major approvals, safety warnings, or reimbursement changes. Right before delivery, a final refresh pass is completed so the latest public signals are reflected in the numbers clients receive.
Mordor Intelligence's Blood Disorder Therapeutics Market Size Versus Other Published Estimates
Published market sizes for blood disorder therapeutics often do not match because each publisher chooses its own disease list, therapy definition, and base year, and these choices change what gets counted. Differences also show up when pricing is treated at list price versus net price proxies, and when patient access constraints are assumed to improve faster than they usually do.
The main gap comes from whether blood cancers and wider hematology oncology drugs are bundled into the same total, where Mordor Intelligence treats the scope as therapeutics for blood disorders as defined in the report coverage rather than a broad oncology revenue roll-up. In addition, some estimates push aggressive uptake for newer modalities across all regions, while others stay conservative, and currency conversion timing can further widen the spread when multi-country revenues are aggregated.
Benchmark comparison
| Source | Market Size | Gaps in Research Methodology |
|---|---|---|
| Mordor Intelligence | USD 18.03 B (2025) | |
| Global Consultancy A | USD 45.90 B (2024) | Uses a broader therapeutic universe that appears to capture a wider set of hematology and oncology drug revenues, which inflates totals versus a blood-disorder-only treatment scope. The longer forecast horizon and slower CAGR also suggests different assumptions on uptake timing and price evolution. |
| Industry Publisher B | USD 15.20 B (2023) | Starts from an earlier base year and may limit coverage to a narrower set of therapy classes, which can undercount newer modalities and recently expanded indications. The methodology is less transparent on treated patient pool build-up and on how regional access constraints are handled. |
Overall, the spread is mainly explained by how wide the disease and drug basket is, plus how quickly adoption and pricing are assumed to change. By tying the market math to treated cohorts, therapy mix, and year-specific pricing signals, we keep the estimate traceable and easier to reproduce when new clinical or reimbursement events occur.
Key Questions Answered in the Report
What is the current Blood Disorder Therapeutics Market size?
The Blood Disorder Therapeutics Market is projected to register a CAGR of 6.13% during the forecast period (2026-2031)
Who are the key players in Blood Disorder Therapeutics Market?
Takeda Pharmaceutical Company Limited (Shire Plc), Sanofi, Novo Nordisk A/S, CSL Ltd and Pfizer Inc are the major companies operating in the Blood Disorder Therapeutics Market.
Which is the fastest growing region in Blood Disorder Therapeutics Market?
Asia Pacific is estimated to grow at the highest CAGR over the forecast period (2026-2031).
Which region has the biggest share in Blood Disorder Therapeutics Market?
In 2025, the North America accounts for the largest market share in Blood Disorder Therapeutics Market.
What years does this Blood Disorder Therapeutics Market cover?
The report covers the Blood Disorder Therapeutics Market historical market size for years: 2019, 2020, 2021, 2022, 2023 and 2024. The report also forecasts the Blood Disorder Therapeutics Market size for years: 2026, 2027, 2028, 2029, 2030 and 2031.