
Blood Bank Market Size and Share
Market Overview
| Study Period | 2020 - 2031 |
|---|---|
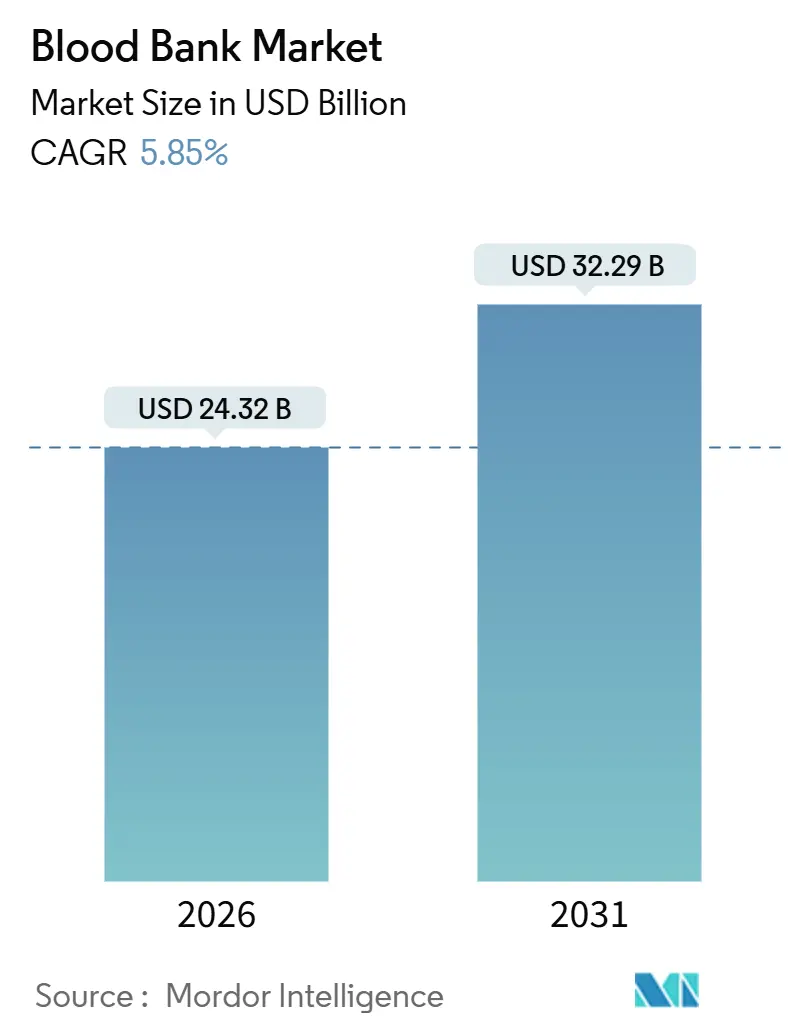
| Market Size (2026) | USD 24.32 Billion |
| Market Size (2031) | USD 32.29 Billion |
| Growth Rate (2026 - 2031) | 5.85 % |
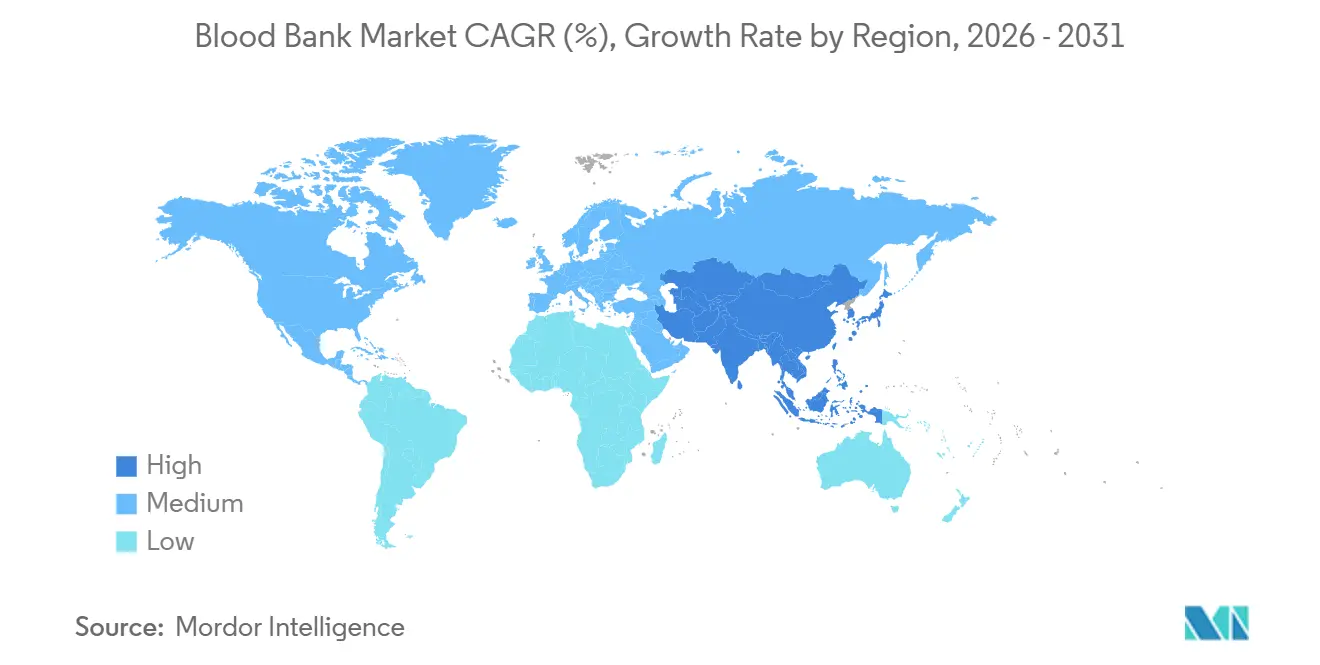
| Fastest Growing Market | Asia Pacific |
| Largest Market | North America |
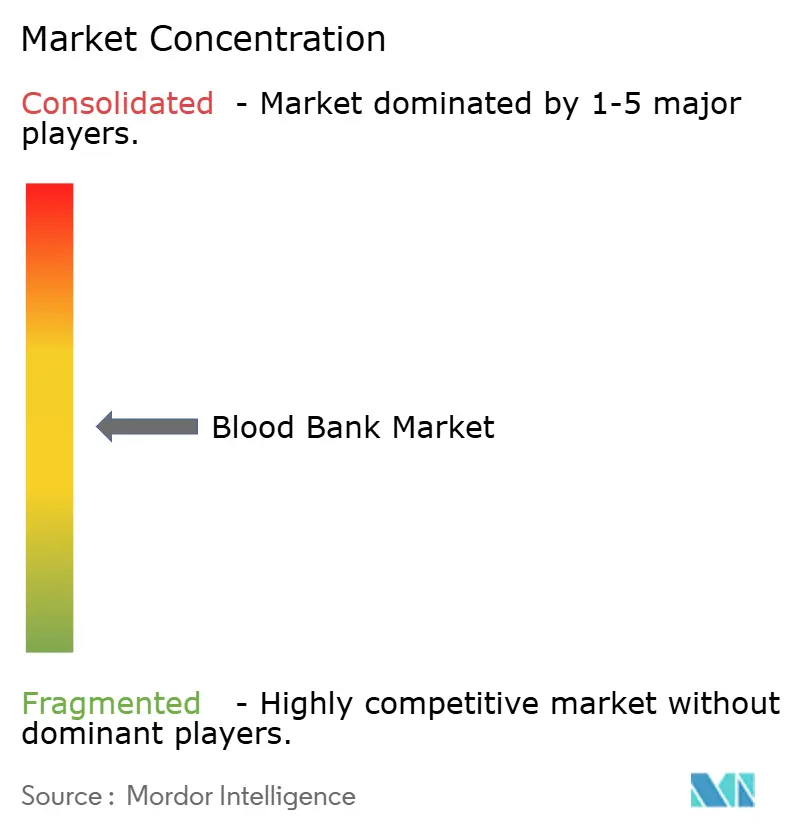
| Market Concentration | Medium |
Major Players *Disclaimer: Major Players sorted in no particular order Image © Mordor Intelligence. Reuse requires attribution under CC BY 4.0. | |
Blood Bank Market Analysis by Mordor Intelligence
The blood bank market size is expected to reach USD 24.32 billion in 2026 and is projected to reach USD 32.29 billion by 2031, reflecting a CAGR of 5.85% over the forecast period. Digital inventory platforms, pathogen-reduction systems, and compact component “micro-factories” are redefining the economics of collection, processing, and supply. Tougher AABB standards issued in 2024 are prompting U.S. centers to automate donor screening and molecular testing, which curbs wastage even as operating costs rise. At the same time, WHO’s restrictive transfusion thresholds are tempering volume growth, although surgical complexity, trauma incidence, and oncology caseloads continue to expand overall demand [1]. Vendors now bundle apheresis hardware, consumables, and software into multi-year contracts, while AI-driven inventory forecasts are cutting platelet outdating significantly in early-adopter hospitals. Against this backdrop, the Asia-Pacific is emerging as the fastest-growing region as China and India scale voluntary donations and modernize cold-chain logistics.
Key Report Takeaways
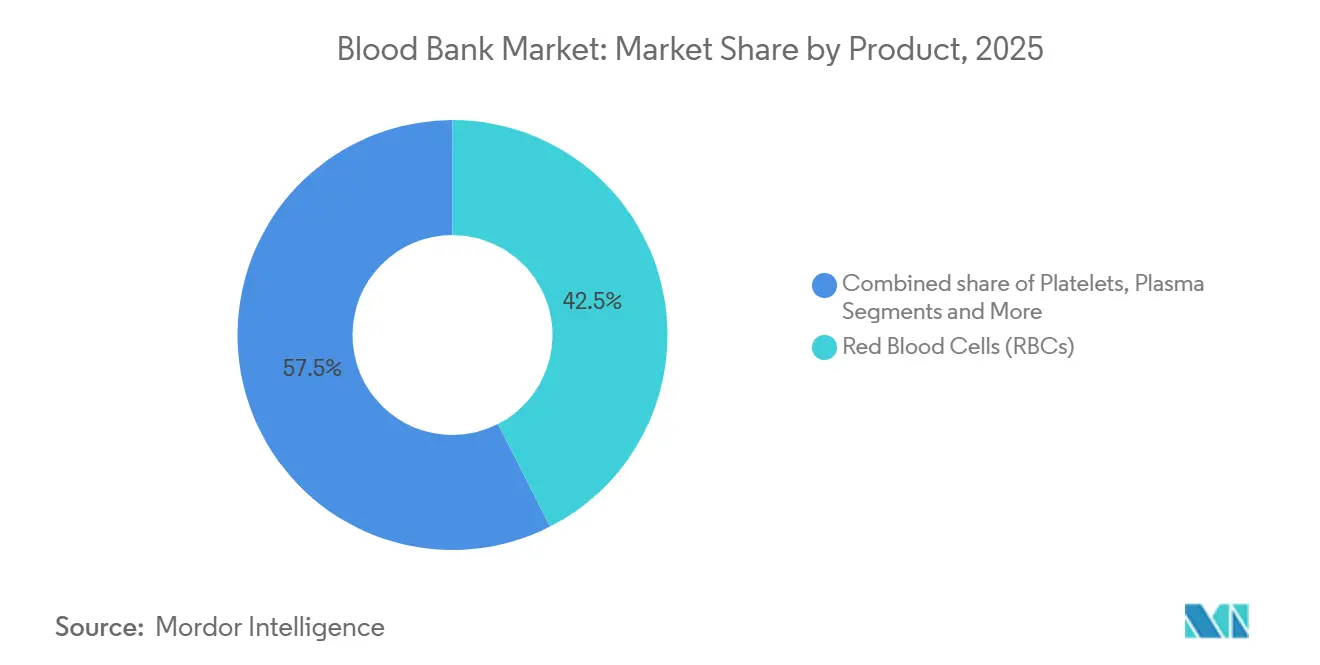
- By product, red blood cells led with a 42.5% blood bank market share in 2025, while plasma is forecast to grow at an 8.32% CAGR through 2031.
- By function, testing generated 39.8% of 2025 revenue, whereas collection is projected to advance at a 7.87% CAGR over the forecast horizon.
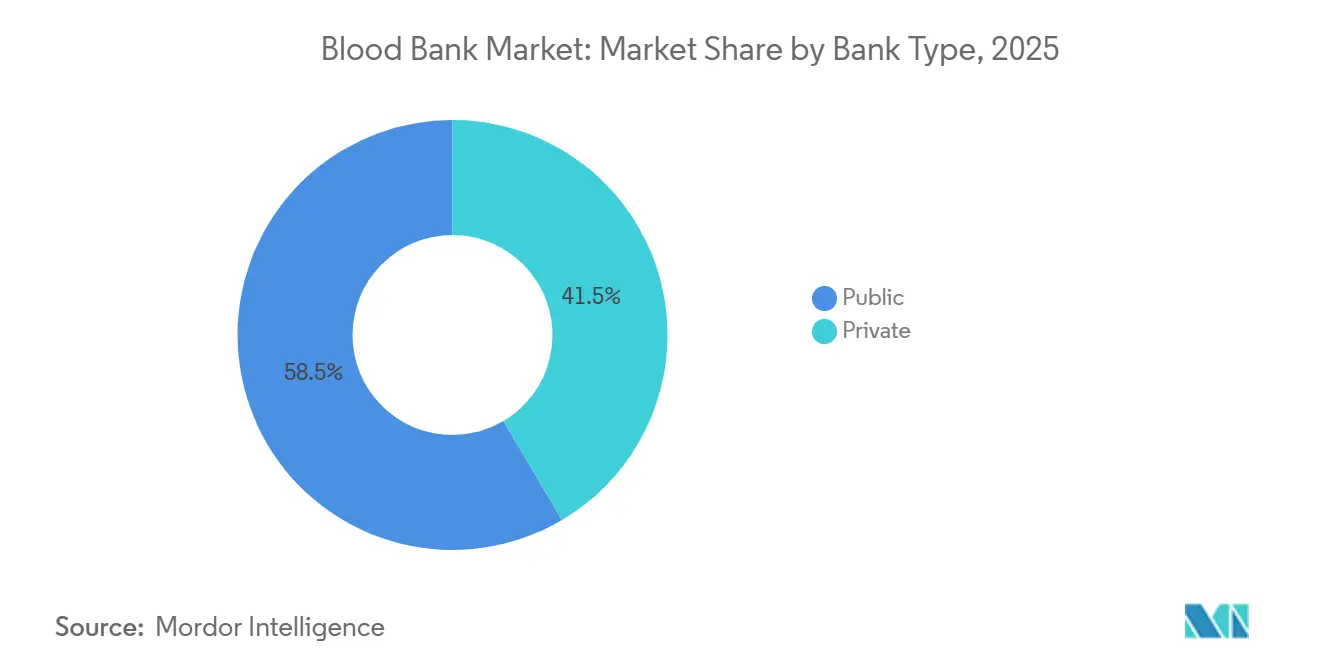
- By bank type, public facilities held 58.5% of 2025 infrastructure; private hospital-based banks are expanding at a 6.98% CAGR to 2031.
- By end user, hospitals absorbed 73.4% of 2025 transfusion volumes, yet ambulatory surgical centers are poised for an 8.21% CAGR through 2031.
- By geography, North America captured 45.32% of 2025 revenue; Asia-Pacific is expected to log a 7.21% CAGR between 2026 and 2031.
Note: Market size and forecast figures in this report are generated using Mordor Intelligence’s proprietary estimation framework, updated with the latest available data and insights as of January 2026.
Market Trends and Insights
Drivers Impact Analysis of Blood Bank Market*
| Driver | (~) % Impact on CAGR Forecast | Geographic Relevance | Impact Timeline |
|---|---|---|---|
| Rising number of surgeries & road-traffic accidents | +1.2% | Global, with acute impact in Asia-Pacific and Middle East & Africa | Medium term (2-4 years) |
| Growing prevalence of hematologic & oncologic disorders | +1.4% | Global, concentrated in North America and Europe | Long term (≥ 4 years) |
| Expansion of voluntary, non-remunerated blood-donation programmes | +0.9% | Asia-Pacific, Sub-Saharan Africa, Latin America | Long term (≥ 4 years) |
| Rapid adoption of pathogen-reduction technologies (PRTs) | +0.8% | North America, Europe, Japan | Medium term (2-4 years) |
| AI-driven inventory optimisation & demand forecasting | +0.7% | North America, Western Europe, urban Asia-Pacific | Short term (≤ 2 years) |
| Development of on-site blood-component micro-factories | +0.5% | North America, select European hospitals | Long term (≥ 4 years) |
| Source: Mordor Intelligence | |||
Rising Number of Surgeries & Road-Traffic Accidents
Global surgical volume climbed 7.3% in 2024, led by joint arthroplasty and cardiac revascularization, each consuming nearly 2 units of packed red blood cells per case. Road-traffic injuries caused 1.19 million deaths in 2024, triggering massive-transfusion protocols that demand up to 10 units of RBCs within the first hour [2]. India’s 2024 survey of 89 trauma centers showed 42% lacked emergency O-negative reserves, delaying definitive surgery. Mobile collection teams, blood management software, and pre-hospital triage are easing the mismatch, yet infrastructure lags population growth in Sub-Saharan Africa and Southeast Asia. Minimally invasive techniques reduce per-case usage but are offset by the sheer rise in procedures as healthcare access broadens.
Growing Prevalence of Hematologic & Oncologic Disorders
The United States recorded 2.04 million new cancer diagnoses in 2024, with up to half of acute leukemia patients requiring prophylactic platelet support [3]. Chronic lymphocytic leukemia and multiple myeloma cohorts expanded 18% in Europe between 2020 and 2024, intensifying plasma-derived immunoglobulin demand. Sickle-cell disease still drives 8–12 transfusions per patient annually despite gene-therapy approvals, while thalassemia maintains chronic demand across South and Southeast Asia. Clinicians increasingly select pathogen-reduced platelets for immunocompromised recipients, absorbing higher per-unit costs in exchange for lower infection risk.
Expansion of Voluntary Non-Remunerated Donation Programs
Seventy-nine countries reached 100% voluntary donation by 2024, up from 73 in 2020, with the sharpest gains in Sub-Saharan Africa and South Asia. China logged 15.1 million voluntary donations in 2024 but still sees 25–35% family-replacement donations in rural provinces. India’s blockchain donor registry, linking 2,800 banks, cut duplicate donations and trimmed inter-facility transfers by 18%. Brazil lifted its donor participation to 2.1% of the population; nonetheless, seasonal shortfalls persist, forcing emergency appeals and plasma imports.
Rapid Adoption of Pathogen-Reduction Technologies (PRTs)
Cerus Corporation’s INTERCEPT platform received FDA clearance for red blood cells in December 2024, broadening the addressable U.S. market by USD 1.8 billion. France now requires 100% of platelets, and Germany mandates PRT for platelet concentrates used in immunocompromised patients. Japan rolled out Macopharma’s Theraflex UV system nationwide in 2024. Cost premiums of USD 150–250 per platelet unit confine universal use, yet high-risk groups—transplant, neonatal, oncology justify adoption. Clinical trials confirm non-inferiority to conventional components, although trauma surgeons remain cautious.
Restraints Impact Analysis of Blood Bank Market*
| Restraint | (~) % Impact on CAGR Forecast | Geographic Relevance | Impact Timeline |
|---|---|---|---|
| Stringent regulatory compliance & accreditation costs | -0.8% | Global, particularly North America and Europe | Medium term (2-4 years) |
| Shrinking donor base in high-income nations | -1.1% | North America, Europe, Japan | Long term (≥ 4 years) |
| Cold-chain vulnerabilities in emerging markets | -0.6% | Sub-Saharan Africa, South Asia, Latin America | Medium term (2-4 years) |
| Competition from synthetic & recombinant blood substitutes | -0.4% | Global, early adoption in North America | Long term (≥ 4 years) |
| Source: Mordor Intelligence | |||
Stringent Regulatory Compliance & Accreditation Costs
AABB’s 34th-edition standards added 47 new requirements, compelling U.S. centers to spend USD 1.2–3.5 million on software, audits, and training. FDA inspections under 21 CFR 606 carry penalties of up to USD 500,000 per violation, prompting 18 small banks to merge since 2022. In Europe, the 2024 Blood Directive amendment lifted operating costs by 8–12%. Rural African banks struggle with ISO 9001 fees exceeding USD 50,000, limiting access to accredited supply. Additional donor-deferral rules for malaria travel further tighten eligibility in multicultural urban centers.
Shrinking Donor Base in High-Income Nations
U.S. donation rates among 18–24-year-olds fell from 9.2% in 2020 to 8.2% in 2024, aggravated by fewer campus drives and changing volunteer norms. Japan’s donor pool contracted 4.1% between 2020 and 2024 as the population aged; over-50 donors now account for 52% of collections but face higher deferral rates. Germany saw first-time donors drop 6.8% in 2024 as young adults cited time constraints and needle anxiety. CSL Plasma raised compensation to USD 100 for first-time donors after a 9% decline in U.S. registrations. Social-media campaigns produce incremental gains but have not reversed the downtrend.
*Our forecasts treat driver/restraint impacts as directional, not additive. The impact forecasts reflect baseline growth, mix effects, and variable interactions.
Blood Bank Market Segment Analysis
By Product:
Plasma Fractionation Drives Fastest GrowthPlasma-derived products are forecast to grow at an 8.32% CAGR, the quickest among product categories, while red blood cells maintained a 42.5% blood bank market share in 2025. Immunoglobulins for primary immunodeficiency and CIDP consumed two-thirds of U.S. plasma output in 2024, driving aggressive collection by Grifols and CSL Plasma. Pathogen-reduced plasma captured 18% of European hospital demand in 2025 as infection-control standards rose. Platelet supply remains constrained by a five-day shelf life, spurring AI-guided demand forecasts that cut outdating up to 25%. Whole blood now represents less than 8% of high-income-country collections, retained mainly for military stockpiles and low-resource settings.
Specialty components such as leukoreduced and irradiated RBCs command premiums but strain small-hospital capacity. Leukoreduction is standard in most of Europe and Canada, covering 92% of U.S. stock in 2024. Pathogen-reduced red blood cells entered U.S. pilot programs in 2025, and vendors aim for 15% penetration by 2031 as reimbursement stabilizes.

By Function:
Collection Automation Accelerates GrowthCollection is the fastest-growing function at a 7.87% CAGR, thanks to apheresis technology that returns RBCs to donors and yields higher-dose platelets. Haemonetics’ MCS+ cut procedure time to 78 minutes, boosting donor retention by 9%. Testing accounted for 39.8% of 2025 revenue as NAT for HIV, HBV, and HCV remains compulsory under U.S. and EU rules. High-throughput devices dropped the cost per assay from USD 18 to USD 12, though new Zika and West Nile panels add USD 25–40 per donation. Processing is consolidating into regional hubs that handle up to 3,000 units per day, while automated logistics and blockchain traceability shorten inter-facility transport times by 18% in India.
By Bank Type:
Private Facilities Gain Share Through SpeedPublic institutions still manage most whole-blood collection, yet private hospital-based banks are growing at a 6.98% CAGR as they slash crossmatch-to-release times to under 20 minutes, critical in trauma and cardiac surgery. Private plasma centers collected 52 million liters in 2024, supplying 70% of global fractionation feedstock. Budget restraints forced the American Red Cross to close 22 donation sites in 2024, highlighting the funding gap in public services. Hybrid public-private models, such as Australia’s Red Cross Lifeblood partnerships, raised donation volumes 11% in pilot states.
By End User:
Ambulatory Surgical Centers Capture Elective VolumesHospitals consumed 73.4% of 2025 transfusion volumes, yet ambulatory surgical centers are poised for an 8.21% CAGR as CMS adds high-blood-loss orthopedic and oncology procedures to ASC fee schedules. Lean inventories force ASCs to rely on predictive supply chains managed by AI software, which reduced stockouts by 34% in early adopters. Specialty hematology clinics, serving chronic transfusion patients, accounted for 9% of 2024 platelet use and increasingly require extended phenotype matching to curb alloimmunization. Military and emergency services maintain dedicated O-negative stockpiles, with the U.S. Army holding 15,000 units in strategic reserve.
Geography Analysis
North America Blood Bank Market
North America generated 45.32% of 2025 revenue, anchored by Medicare reimbursement for patient blood-management programs and rigorous FDA oversight. Donor recruitment, however, is faltering; 18–24-year-old participation dropped 11% from 2020 to 2024, prompting the adoption of AI inventory tools that trim wastage by up to 25%. Canada boasts a 3.8% voluntary-donor rate, yet 52% of donors are over 50, elevating deferral risk. Cerus’ FDA approval for pathogen-reduced RBCs placed 22 U.S. trauma centers at the forefront of PRT rollouts.
APAC Blood Bank Market
Asia-Pacific is the fastest-growing region with a 7.21% CAGR forecast. China’s push to 20 donations per 1,000 citizens and India’s blockchain registry underpin robust volume growth despite cold-chain gaps in rural districts. Japan raised its donor age limit to 74 years in 2025 to counter a 4.1% donor pool contraction. South Korea’s mandatory high-school education program lifted donations to 2.9 million units in 2024, though platelet shortages persist outside major metros.
EMEA and South America Blood Bank Market
Europe held about 28% of 2025 revenue but faces structural donor declines as the median age approaches 45 years. France pathogen-reduces all platelets, and Germany mandated PRT for immunocompromised facilities in 2025, adding USD 150–250 per platelet dose. The U.K. saw donations fall 3.2% in 2024, triggering a GBP 12 million investment in mobile-app scheduling and social-media outreach. Cold-chain weaknesses in MEA and South America contribute to 12% RBC spoilage, with Brazil relying on emergency appeals during Carnival season.
Regulatory Landscape
Blood establishments operate under increasingly harmonized safety and quality frameworks that tighten requirements on donor eligibility, infectious-disease screening, traceability, and manufacturing controls. In the European Union, Regulation (EU) 2024/1938 (SoHO) established a unified regulatory framework for substances of human origin, including blood and blood components, replacing legacy directives and raising alignment needs for cross-border exchange and oversight of blood establishments.
In the United States, the FDA (CBER) continues to update the blood and biologics guidance pipeline, with its 2026 guidance agenda listing multiple new and revised items relevant to collection, processing, and testing. Screening expectations are also expanding for regionally relevant pathogens, illustrated by the FDA approval of a second licensed malaria donor-screening test in March 2026 (Grifols Procleix Plasmodium assay for the Procleix Panther system). Globally, WHO publications in 2026, including the Global status report on blood safety and availability 2025 (published June 12, 2026) and the WHO Action framework 2026-2030 (May 2026), reinforce national regulatory framework priorities and standardized approaches to quality-assured blood products.
Competitive Landscape
The top 10 players controlled the majority of 2025 revenue, indicating moderate consolidation. American Red Cross, Grifols, CSL Plasma, Vitalant and Haemonetics dominate North America; Plasma fractionators are vertically integrating collection, but rising donor compensation compresses margins. Testing-automation providers such as Roche and Bio-Rad move into molecular assays to detect emerging pathogens. White-space opportunities include AI inventory platforms, decentralized micro-factories, and synthetic substitutes, although lengthy regulatory pathways mean commercialization after 2028. Fragmentation persists in low-income regions where local suppliers refurbish equipment and operate manual processes.
Blood Bank Industry Leaders
-
American Red Cross
-
CSL Plasma
-
Grifols S.A.
-
Haemonetics Corporation
-
Vitalant
- *Disclaimer: Major Players sorted in no particular order
Blood Bank Market Companies Covered in this Report
- American Association of Blood Banks
- American Red Cross
- Australian Red Cross Lifeblood
- BioLife Plasma Services (Takeda)
- Blood Bank of Alaska
- Canadian Blood Services
- Cerus
- CSL Plasma
- Fresenius
- Grifols
- Haemonetics
- Immucor
- New York Blood Center (NYBC)
- NHS Blood & Transplant (NHSBT)
- Octapharma Plasma
- Sanquin Blood Supply Foundation
- Vitalant
- Wuhan Plasma Plant
Market Opportunities and Future Outlook
A whitespace is emerging around end-to-end digital traceability that connects donor recruitment, testing, component manufacturing, inventory, and hospital ordering into a single operational view. Supplier activity supports this direction, including Blood Bank Computer Systems (BBCS) announcing the rollout of ForLife Vantage in March 2026 to integrate electronic hospital ordering and patient transfusion services into its blood supply lifecycle platform, aligning with the market shift toward real-time inventory visibility and reduced outdating.
Quality standardization initiatives are also creating implementation opportunities for testing automation, EQAS programs, and compliance-oriented software and hardware upgrades across large, fragmented networks. India introduced exclusive pharmacopoeial standards for blood and blood components under Indian Pharmacopoeia 2026 (June 2026), and the Ministry of Health and Family Welfare initiated requirements for external quality audits and real-time digital inventory tracking across 4,153 blood banks in July 2026, increasing demand for standardized workflows and auditable data trails. On the processing side, regulatory friction is easing for certain manufacturing upgrades, with the FDA permitting implementation of the Reveos blood component manufacturing device to be reported via a CBE-30 supplement (June 2026), supporting faster adoption of higher-throughput component production and helping blood centers address labor constraints and tighter compliance requirements.
Recent Industry Developments in Blood Bank Market
- July 2026: Hemanext entered a production partnership with OneBlood to expand use of the Hemanext ONE system across the United States. The initiative supports wider adoption of automated RBC processing workflows and strengthens the installed base at large blood-center operators.
- April 2026: Grifols received FDA approval for its Procleix Plasmodium assay for U.S. blood donor screening. The approval adds a regulatory-backed tool for malaria risk mitigation and expands the menu of infectious-disease tests used in donor screening programs.
- December 2024: Cerus Corporation received FDA clearance for the INTERCEPT platform for red blood cells, broadening pathogen-reduction options beyond platelets and plasma. The clearance enabled U.S. centers to begin piloting pathogen-reduced RBC programs under regulated workflows and budgeting for higher per-unit safety interventions.
Blood Bank Market Report Scope and Research Methodology
Market Definition and Coverage
This market covers the revenue earned from blood bank activities that move donated blood from collection through testing, processing, storage, and distribution for clinical use, including component preparation and related handling services across major regions.
Scope exclusions: We exclude therapeutic blood products made through industrial fractionation and most hospital internal transfusion service costs that are not billed as blood bank services.
Segments Covered in This Report
- By Product
- Whole Blood
- Red Blood Cells (RBCs)
- Packed RBC
- Leukoreduced RBC
- Irradiated RBC
- Platelets
- Pooled Platelets
- Apheresis Platelets
- Pathogen-Reduced Platelets
- Plasma
- Fresh-Frozen Plasma (FFP)
- Cryoprecipitate
- Pathogen-Reduced Plasma
- White Blood Cells & Buffy Coat Products
- Specialty Components
- Deglycerolised RBC
- Washed Platelets
- By Function
- Collection
- Processing
- Testing
- Storage
- Transportation
- By Bank Type
- Private
- Public
- By End User
- Hospitals
- Ambulatory Surgical Centres
- Specialised Haematology & Oncology Clinics
- Military & Emergency Medical Services
- Research & Academic Institutes
- Geography
- North America
- United States
- Canada
- Mexico
- Europe
- Germany
- United Kingdom
- France
- Italy
- Spain
- Rest of Europe
- Asia-Pacific
- China
- Japan
- India
- South Korea
- Australia
- Rest of Asia-Pacific
- Middle East & Africa
- GCC
- South Africa
- Rest of Middle East & Africa
- South America
- Brazil
- Argentina
- Rest of South America
- North America
Data Sources, Market Sizing, and Validation
Desk Research
For the initial structure of the model, we relied on public health and donation statistics plus safety and utilization guidance. Common sources used include Centers for Disease Control and Prevention (CDC) blood safety updates, World Health Organization (WHO) blood transfusion resources, National Institutes of Health (NIH) and peer reviewed clinical journals, and national health ministries that publish transfusion and hospital activity indicators.
To make the dataset usable in a market model, the desk work was connected to operational signals such as donation volumes, component mix, and testing requirements by country. We also reviewed annual reports and investor materials where available, association websites, and credible press coverage to understand service pricing movement and capacity additions. In parallel, selective paid subscriptions were used for company financials and intelligence, patent lookups, and import and export shipment level checks where relevant. The examples listed here are illustrative, and many other public sources were also reviewed for data collection, cross checks, and clarification.
Primary Interviews and Surveys
Primary work focused on interviews and structured questionnaires with blood bank operators, hospital transfusion teams, lab and testing stakeholders, and logistics and cold chain participants. Because the market is global, inputs were checked across Americas, EMEA, and APAC so assumptions on utilization, pricing, and adoption of advanced testing practices could be aligned to local operating realities.
Distribution of primary research fieldwork respondents
| Company type | Respondent position | Region |
|---|---|---|
| Top tier: 30% | CXOs: 18% | APAC: 42% |
| Mid tier: 52% | Functional/Unit leaders: 31% | EMEA: 31% |
| Smaller Players: 18% | Managers: 51% | Americas: 27% |
Market-Sizing & Forecasting
Sizing starts with a top-down build where donation and transfusion activity signals are translated into a demand pool for blood and components, and then aligned to the service steps that create billable revenue. To keep the model practical, we used a mix of indicators such as blood donation rates and collection volumes, component split trends (RBCs, platelets, plasma, and specialty components), testing intensity by regulation, storage and wastage norms, and transport and cold chain handling requirements.
Once the top line was formed, results were cross checked using selective bottom-up approximations, such as sampled price points for testing and processing, typical per unit handling charges, and channel checks on how public and private blood banks recover costs. When data gaps appeared by country, neighboring country patterns were applied only after adjusting for healthcare spending levels and transfusion intensity, and then the assumption was re-tested in expert calls. For forecasting, scenario analysis was used around a base case, where drivers like surgical volumes, trauma care demand, anemia and chronic disease burden, and improvements in donation infrastructure were varied in a controlled way, and the final path was chosen based on what respondents considered realistic for their region.
Data Validation & Update Cycle
Outputs are validated by comparing the market totals against independent signals, including component utilization benchmarks, country level collection trends, and visible changes in testing and storage practices. Variances are reviewed step by step, where unusual jumps trigger a re-check of unit assumptions, currency conversions, and whether a country was modeled with the correct service scope.
Before sign-off, the model and write-up are reviewed by another analyst, and follow-up outreach is initiated when a key assumption moves outside an expected range. The report is refreshed annually, and interim updates are completed when material events occur, such as policy changes that affect testing requirements or sudden donation disruptions. Right before delivery, a quick final pass is completed so clients receive the most current view available.
Mordor Intelligence's Blood Bank Market Size Compared With Other Published Estimates
Published market sizes for blood banks often do not match because the boundary between blood bank services and adjacent blood products is handled differently, and because base years and currency timing are not always aligned. Differences also come from whether estimates emphasize public systems, private networks, or a combined view across functions like collection, testing, storage, and transportation.
By tracking donation volume and component mix and then refreshing the price and function level assumptions through interviews, Mordor Intelligence keeps the modeled revenue tied to blood bank operations rather than blending in broader blood products and unrelated hospital service costs.
Benchmark comparison
| Source | Market Size | Gaps in Research Methodology |
|---|---|---|
| Mordor Intelligence | USD 24.32 B (2026) | |
| Global Consultancy A | USD 18.10 B (2024) | Uses an earlier base year and factory gate style valuation, which can understate service intensive activities like testing, processing, and distribution when mapped to today's utilization and pricing. |
| Industry Publisher B | USD 18.60 B (2025) | Applies a slower growth arc and can differ on what is counted as blood bank revenue versus broader healthcare services, which shifts totals when component handling and specialty processing are treated differently. |
The spread across sources is mostly explained by year alignment and how tightly the estimate is linked to blood bank functions and chargeable steps. When scope is kept consistent and key inputs like component split, testing intensity, and pricing are re-checked, the final number becomes easier to trace and repeat for updates.
Key Questions Answered in the Report
What is the projected value of the blood bank market in 2031?
The blood bank market size is forecast to reach USD 32.29 billion by 2031, reflecting a 5.85% CAGR.
Which product segment is growing the fastest?
Plasma-derived products lead growth with an expected 8.32% CAGR due to expanding immunoglobulin demand.
Why are ambulatory surgical centers attracting attention from blood suppliers?
CMS has added high-blood-loss procedures to ASC fee schedules, and these centers require just-in-time inventories that private banks can supply quickly.
How are AI tools improving blood-component availability?
Machine-learning platforms reduce platelet outdating significantly and cut emergency crossmatch times by half.
What are the main challenges limiting donation growth in high-income countries?
Shrinking youth donor participation and tighter deferral rules are contracting the eligible donor pool despite marketing efforts.
Which regions face the greatest cold-chain vulnerabilities?
Sub-Saharan Africa and rural South Asia experience frequent temperature excursions that spoil up to 12% of transported red blood cells.