
Blockchain In Media, Advertising, And Entertainment Market Size and Share
Market Overview
| Study Period | 2020 - 2031 |
|---|---|
| Market Size (2026) | USD 4.46 Billion |
| Market Size (2031) | USD 40.44 Billion |
| Growth Rate (2026 - 2031) | 55.42 % |
| Fastest Growing Market | Asia-Pacific |
| Largest Market | North America |
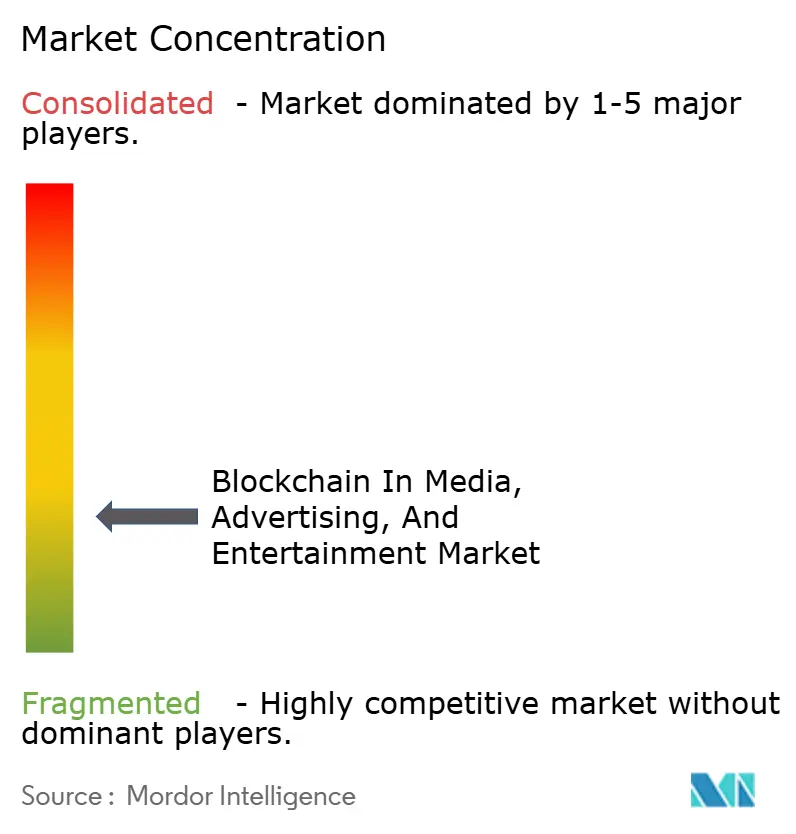
| Market Concentration | Low |
Major Players *Disclaimer: Major Players sorted in no particular order Image © Mordor Intelligence. Reuse requires attribution under CC BY 4.0. | |
Blockchain In Media, Advertising, And Entertainment Market Analysis by Mordor Intelligence
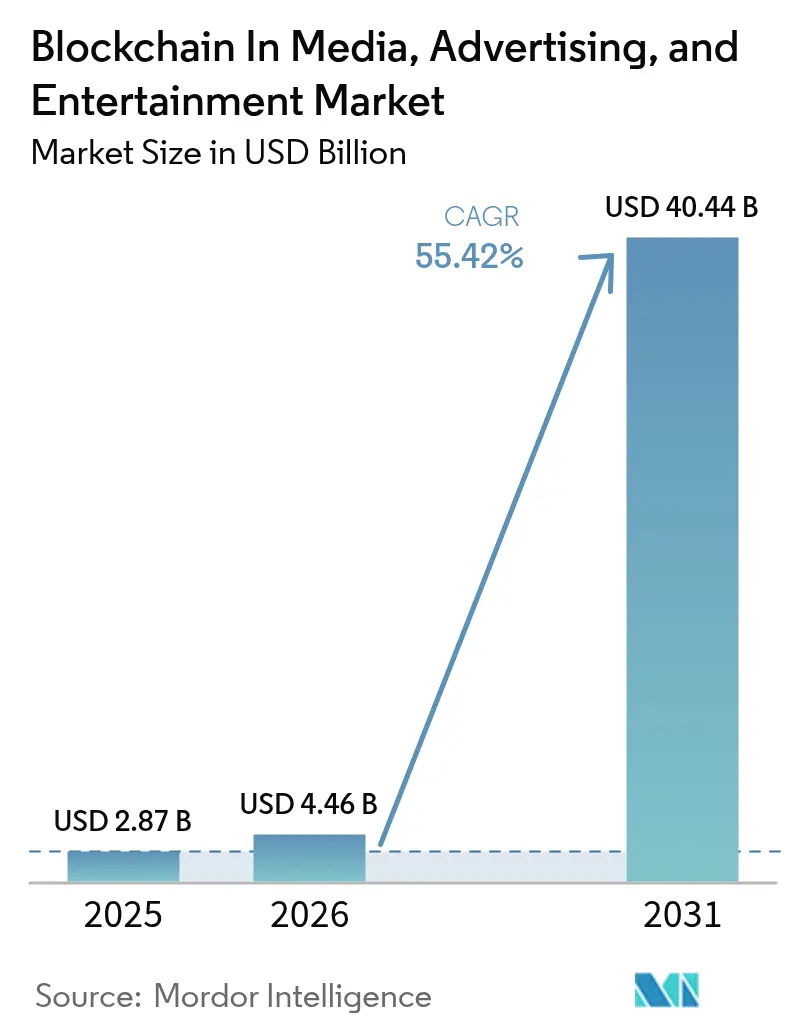
The blockchain in media, advertising, and entertainment market size in 2026 is estimated at USD 4.46 billion, growing from 2025 value of USD 2.87 billion with 2031 projections showing USD 40.44 billion, growing at 55.42% CAGR over 2026-2031. Surging creator demand for direct monetization, advertisers’ insistence on verifiable ad metrics, and rights holders' push for automated royalties collectively propel the blockchain in the media, advertising, and entertainment markets, while permissioned networks balance transparency with content-access controls. Public chains captured early share thanks to NFT liquidity, yet consortium and hybrid architectures are scaling fast as studios protect prerelease assets. Large enterprises currently dominate spending, but falling integration costs enable smaller studios to deploy blockchain in weeks, thereby broadening the user base. Regionally, North America supplies a high share of revenue, yet the Asia-Pacific now shows the steepest growth trajectory as public policy initiatives converge with a digitally savvy fan base. All told, the blockchain in media, advertising, and entertainment markets continues to reward innovators who link programmable money, tokenized IP, and audience engagement into a single frictionless loop.
Key Report Takeaways
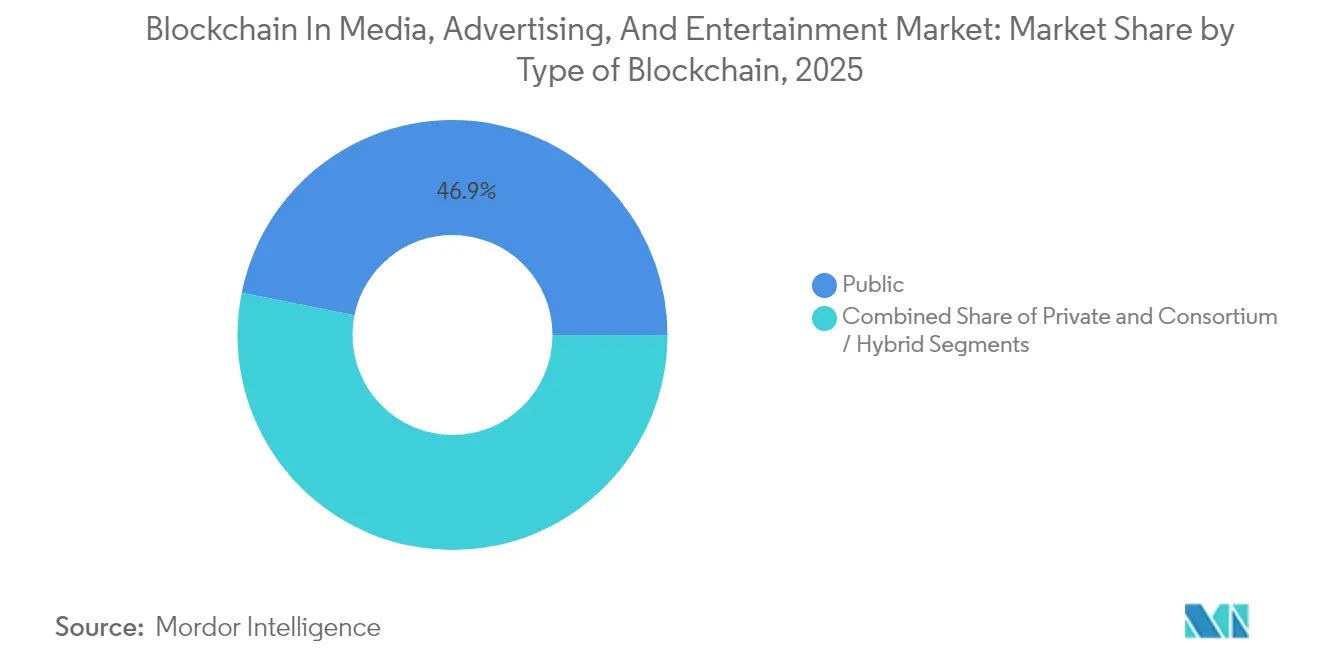
- By type of blockchain, public chains held 46.85% of the blockchain in media, advertising, and entertainment market in 2025, while consortium and hybrid models are forecast to expand at a 60.02% CAGR through 2031.
- By enterprise size, large enterprises commanded 63.10% of the blockchain in media, advertising, and entertainment market size in 2025, whereas small and medium enterprises are expected to advance at a 59.85% CAGR to 2031.
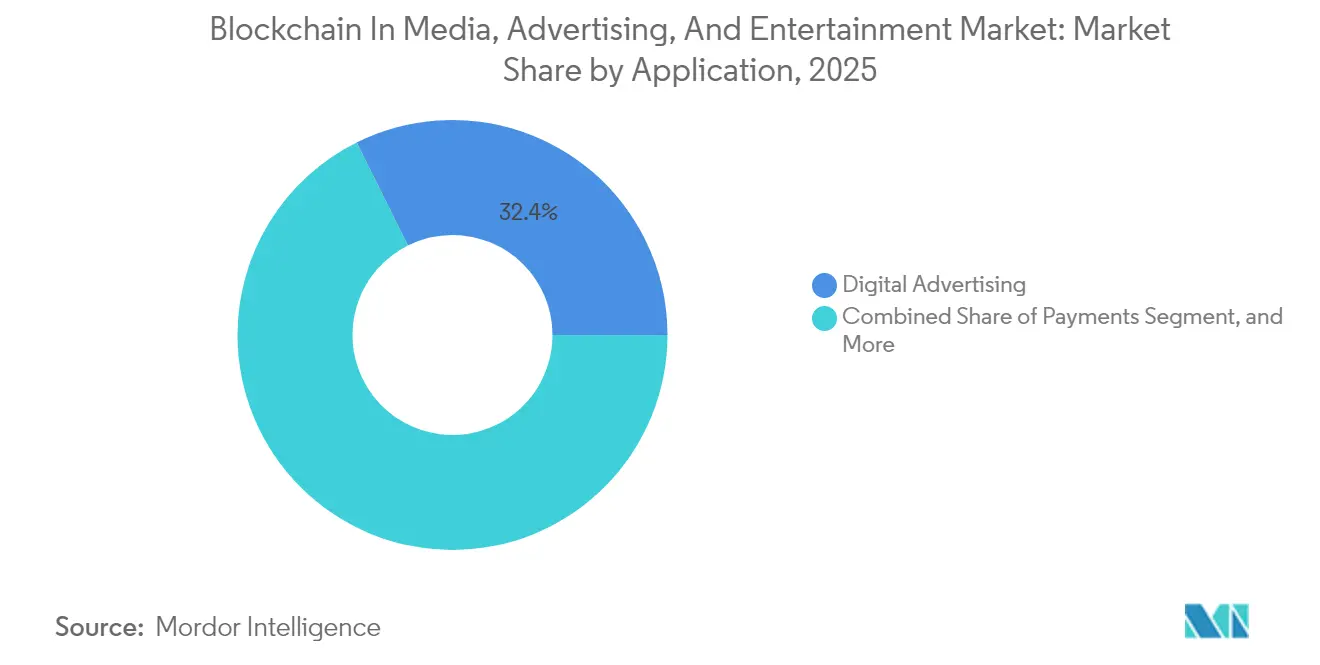
- By application, digital advertising led with 32.35% revenue share of the blockchain in media, advertising, and entertainment market in 2025; licensing and rights-management smart contracts are projected to accelerate at a 61.35% CAGR through 2031.
- By media segment, gaming accounted for 30.55% of the spending on blockchain in the media, advertising, and entertainment market in 2025, but sports tokenization is poised for a 60.95% CAGR toward 2031.
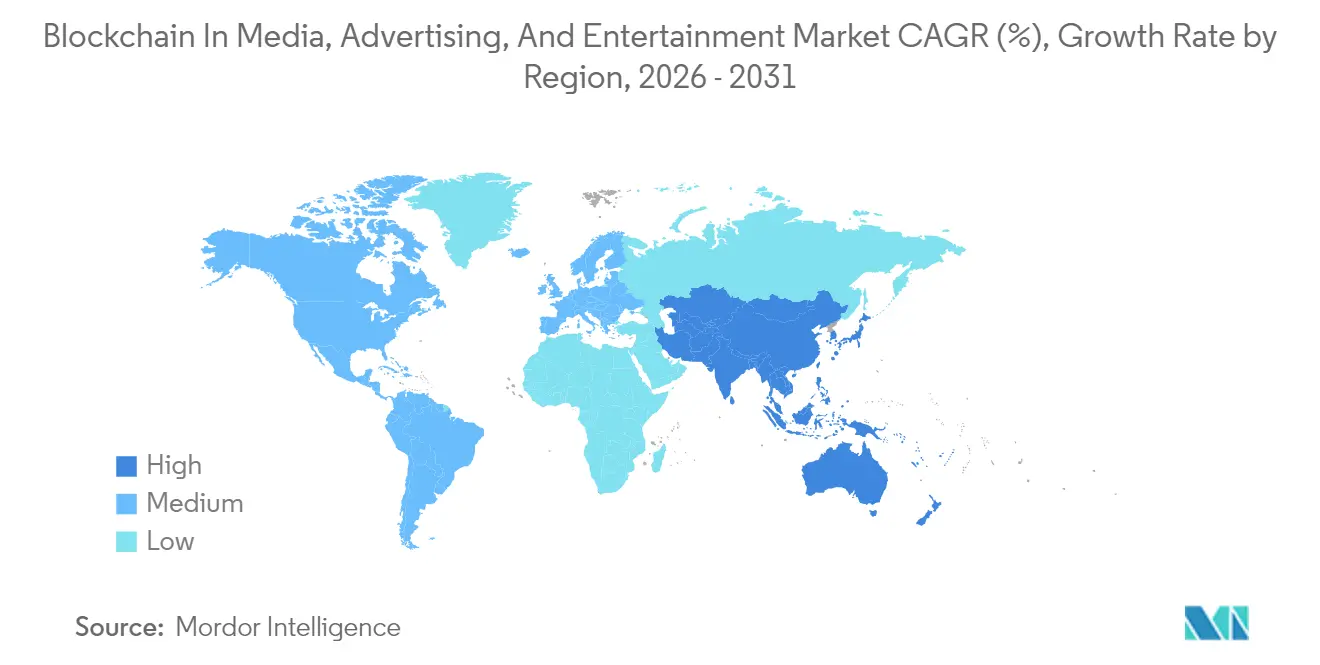
- By geography, North America contributed 38.40% of the revenue in the blockchain in media, advertising, and entertainment market in 2025, while the Asia-Pacific is set to lead the field with a 60.35% CAGR during the forecast period.
Note: Market size and forecast figures in this report are generated using Mordor Intelligence’s proprietary estimation framework, updated with the latest available data and insights as of 2026.
Market Trends and Insights
Drivers Impact Analysis of Blockchain In Media, Advertising, And Entertainment Market*
| Driver | (~) % Impact on CAGR Forecast | Geographic Relevance | Impact Timeline |
|---|---|---|---|
| Commoditization of Content and Piracy | +8.5% | Global, acute in Asia-Pacific and Latin America | Medium term (2-4 years) |
| Disintermediation between Creators and Audience | +9.2% | Global, early adoption in North America and Europe | Short term (≤ 2 years) |
| Demand for Secure and Faster Transactions | +7.8% | Global, concentrated in North America and Asia-Pacific | Short term (≤ 2 years) |
| Need to Curb Programmatic Advertising Fraud | +8.1% | North America, Europe, expanding to Asia-Pacific | Medium term (2-4 years) |
| Decentralized Autonomous Production Studios | +6.4% | North America and Europe, emerging in Asia-Pacific | Long term (≥ 4 years) |
| Tokenization of Royalty Streams | +10.3% | Global, early traction in music and film | Medium term (2-4 years) |
| Source: Mordor Intelligence | |||
Tokenization of Royalty Streams
Tokenizing royalties embeds payout logic into smart contracts that execute instantly when content is streamed or screened, compressing settlement cycles from close to two years to near real-time.[1] Independent musicians receive 85-95% of streaming income, a sharp reversal of legacy splits, while fans obtain fractional ownership in song catalogs, deepening loyalty and liquidity. Venture funding reached USD 55 million in 2024 for startups that fractionalize back-catalog assets, signalling strong investor confidence in the blockchain in the media, advertising, and entertainment market. Film studios are piloting similar models, using on-chain box-office oracles to trigger residuals and eliminate accounting disputes. As these contracts eliminate reconciliation friction, they help expand blockchain adoption in the media, advertising, and entertainment markets, with increased penetration across music and visual media.
Disintermediation between Creators and Audience
Blockchain video networks enable creators to stream content directly to viewers without surrendering 30-50% of their platform fees, thereby securing higher margins and reducing cash-collection cycles.[2] Theta’s edge-node incentives drop delivery costs by roughly 60%, while NFT pre-sales now bankroll independent films before cameras roll. Cross-border micro-payments in stablecoins circumvent currency controls, turning globally scattered fan communities into instant financiers. Pilot data from 2024 indicate that over 40 projects have been funded through NFT sales, demonstrating tangible momentum behind the blockchain in the media, advertising, and entertainment sectors. In regions with patchy banking rails, creators collect funds in minutes rather than weeks, underscoring blockchain’s ability to undercut entrenched intermediaries.
Need to Curb Programmatic Advertising Fraud
Ad fraud siphoned USD 84 billion from marketers during 2024, a loss that galvanized adoption of blockchain verification layers. Brave, AdEx, and similar networks log every impression on-chain and pay publishers only after fraud-detection oracles confirm human engagement. Early brand pilots report reductions in fraud of 30-40% and improved return on ad spend, bolstering the appeal of blockchain in media, advertising, and entertainment markets to advertisers. Immutable audit trails simplify reconciliations and shift budgets toward premium inventory. Video formats, once vulnerable to domain spoofing, now gain cryptographic proof of placement, restoring trust in programmatic campaigns.
Demand for Secure and Faster Transactions
Cross-border licensing once relied on SWIFT wires, which consumed up to 5-7 business days and 3-5% of the deal value. In 2024, distributors began settling film rights with USDC in ten minutes, sidestepping forex spreads and chargeback risk. Stablecoin rails also enable sub-USD micro-transactions, reviving pay-per-view and in-game purchase models that were previously unviable. Live-event broadcasters lock in rights hours before kickoff and settle instantly, a capability essential for real-time sports coverage. As transaction risk decreases, more stakeholders become involved with the blockchain in the media, advertising, and entertainment markets, thereby reinforcing network effects.
Restraints Impact Analysis of Blockchain In Media, Advertising, And Entertainment Market*
| Restraint | (~) % Impact on CAGR Forecast | Geographic Relevance | Impact Timeline |
|---|---|---|---|
| Lack of Standardization and Interoperability | -5.7% | Global, acute in fragmented enterprise deployments | Medium term (2-4 years) |
| Expensive and Time-Consuming Deployment | -4.2% | Global, disproportionate impact on SMEs | Short term (≤ 2 years) |
| Regulatory Uncertainty for Tokenized Revenue | -6.1% | North America and Europe, emerging Asia-Pacific | Long term (≥ 4 years) |
| Carbon Footprint Concerns | -3.8% | Europe and North America, expanding globally | Medium term (2-4 years) |
| Source: Mordor Intelligence | |||
Lack of Standardization and Interoperability
Digital assets minted on Ethereum seldom interoperate natively with rights contracts on Polygon, forcing right-holders to juggle parallel inventories.[3] Only a fifth of media projects have implemented emerging token-taxonomy frameworks, limiting asset portability and liquidity. Bridge protocols like CCIP and LayerZero facilitate transfers while incurring gas costs and introducing additional attack surfaces, as they lack shared metadata schemas for sync and mechanical licenses, and automated royalty aggregation stalls. Consequently, enterprises may delay investment, tempering their adoption of blockchain in media, advertising, and entertainment markets until standards converge.
Regulatory Uncertainty for Tokenized Revenue
Divergent rules blur the distinction between NFTs and fan tokens, making it unclear whether they qualify as securities. The U.S. Securities and Exchange Commission issued multiple Wells notices in 2024, chilling some launches. Meanwhile, Europe’s MiCA framework demands costly registration yet offers clarity. Studios tackling global audiences must geo-block certain regions, adding compliance overhead that smaller creators cannot absorb. Inconsistent tax treatment further complicates ROI calculations, encouraging pilot-only projects in more favorable jurisdictions like Singapore. Resolution of these gray areas remains pivotal for scaling the blockchain in the media, advertising, and entertainment industries.
*Our forecasts treat driver/restraint impacts as directional, not additive. The impact forecasts reflect baseline growth, mix effects, and variable interactions.
Blockchain In Media, Advertising, And Entertainment Market Segment Analysis
By Type of Blockchain:
Hybrid Models Gain Enterprise TrustConsortium and hybrid networks are projected to grow at a rapid 60.02% CAGR, far outstripping public-chain momentum, despite public blockchains holding 46.85% of the blockchain in media, advertising, and entertainment market in 2025. Permissioned governance offers selective data disclosure, a must for studios guarding prerelease content. Hybrid models hash contract fingerprints onto Ethereum, preserving public auditability while keeping deal terms private, thereby mitigating the risk of leaks. Private Hyperledger instances reached 5,000 TPS during a Hollywood pilot, reaffirming the performance edge for post-production workflows. Yet, public chains retain value for creators chasing global NFT liquidity, underscoring a dual-stack future across the blockchain in the media, advertising, and entertainment market.
Hybrid adoption also benefits from on-chain privacy tools, such as zero-knowledge proofs, which mask sensitive fields while allowing public confirmation of royalty splits. Studio consortia can now validate that payments occurred without exposing exact amounts to rivals. As open-source frameworks mature, integration friction falls, encouraging more mid-tier broadcasters to migrate. Over the forecast horizon, hybrid architectures are expected to anchor 40% of new deployments, solidifying their status as the default enterprise pattern for the blockchain in the media, advertising, and entertainment market.

By Enterprise Size:
SMEs Accelerate AdoptionAlthough large enterprises controlled 63.10% of transactional value in 2025, SMEs are closing fast with a 59.85% CAGR through 2031. Ready-made contract templates from Thirdweb and Alchemy shrink development cycles from months to weeks. Managed node services on AWS and Azure, further lower cost, letting studios spin up environments for under USD 50,000, compared with six-figure custom builds earlier. An artist survey revealed that blockchain usage is expected to triple to 38% by 2024, highlighting grassroots momentum across the blockchain in media, advertising, and entertainment market.
SME traction is especially acute in South America and Southeast Asia, where creators lack entrenched distribution partners yet boast large online audiences. Token-gated streaming concerts in Brazil attracted 5,000 artists within six months, demonstrating that small players can punch above their weight when equipped with Web3 infrastructure. As no-code tooling proliferates, SMEs could surpass large enterprises in new project count by 2028, tilting the competitive balance within the blockchain in the media, advertising, and entertainment market.
By Application:
Smart Contracts Redefine Rights ManagementDigital advertising still leads revenue at 32.35%, but licensing and royalty smart contracts are racing ahead at 61.35% CAGR. A blockbuster film encoded its waterfall into Solidity in 2024, triggering payouts within 48 hours of box-office reports, replacing quarterly checks and auditors. Transparent ledgers eliminate reconciliation disputes and reduce legal overhead. Stablecoin rails support instant cross-border settlements, making smart contracts the killer app inside the blockchain in media, advertising, and entertainment market.
Payments and gaming hover in the mid-teens share zone, while live streaming grows from a smaller base as decentralized video networks deliver 90-95% revenue retention for creators. Ancillary uses such as supply-chain tracking for merchandise and anti-counterfeit labeling remain niche but are on the rise. The pivot from speculative NFT drops toward workflow automation signals a maturation phase across the blockchain in media, advertising, and entertainment industries.
By Media Segment:
Sports Tokenization AcceleratesSports franchises now tokenize tickets, memorabilia, and governance rights, driving a blistering 60.95% CAGR, outpacing gaming’s still-hefty 30.55% share. European football clubs alone issued 50 fan tokens in 2024, raising USD 300 million and letting supporters vote on jersey designs. NFT-based tickets hard-code resale caps, clawing back USD 1.5 billion that once slipped to scalpers. Such traction positions sports as the innovation lab of the blockchain in media, advertising, and the entertainment market.
Music and film trails in the mid-teens share but ride the tailwinds from catalog tokenization and NFT crowdfunding alike. Advertising content leverages brand-minted collectibles that reward engagement, lifting recall by 25-30% compared with static banners. Though news-and-publishing use cases remain early, deepfake concerns are nudging publishers toward immutable content logs, hinting at future upside for the blockchain in media, advertising, and entertainment market.
Geography Analysis
North America Blockchain in Media, Advertising, and Entertainment Market
North America contributed 38.40% of the revenue in 2025, with California studios accounting for over 60% of the regional spend amid robust venture backing. Canada’s tax incentives anchor blockchain gaming in Toronto and Vancouver, whereas Mexico’s adoption lags but gains impetus from remittance-driven stablecoin flows. The region’s early lead shifts focus toward scaling concerns, cross-chain orchestration, and regulatory compliance platforms; yet, its growth rate now trails emerging hotspots, reflecting market maturity within the blockchain industry in media, advertising, and entertainment.
APAC Blockchain in Media, Advertising, and Entertainment Market
Asia-Pacific is forecast to soar at 60.35% CAGR, the fastest worldwide. China’s state-run Blockchain-based Service Network enables compliant NFT-like “digital collectibles,” circumventing crypto trading bans. Japan’s Web3 roadmap supplies tax carve-outs that spur Sony and Bandai Namco to launch blockchain games. India’s Bollywood NFTs target a vast diaspora, and South Korea’s K-pop tokens sell out instantly, generating templates for fan-sourced financing. Australia and Southeast Asia contribute modest shares today but capitalize on improved payment rails by integrating blockchain technology into regional content-export strategies that stitch together the media, advertising, and entertainment market.
EMEA and South America Blockchain in Media, Advertising, and Entertainment Market
Europe, South America, the Middle East, and Africa fill the remainder. MiCA provides legal certainty that accelerates the development of German and U.K. rights registries. France’s luxury houses merge couture with film NFTs, enhancing experiential marketing. Brazil and Argentina utilize stablecoins to mitigate the drag of inflation, although infrastructure deficits slow their adoption. Dubai and Riyadh leverage free-zone perks to magnetize Web3 studios, while Nigeria pilots blockchain music streams targeting diaspora downloads. Collectively, these diverse initiatives underscore the global reach of blockchain in the media, advertising, and entertainment sectors.
Regulatory Landscape
Regulation affecting blockchain in media, advertising, and entertainment continues to split across privacy, tokenized revenue treatment, and compliance for AI-enabled content workflows. In the European Union, MiCA provides a clearer compliance path for certain crypto-asset activities, while the European Data Protection Board has issued guidelines on processing personal data through blockchain technologies, pushing media platforms toward privacy-by-design patterns that fit hybrid and permissioned deployments. Separately, the EU AI Act (Regulation (EU) 2024/1689) elevates governance requirements around AI-enabled content workflows, an adjacency that matters for provenance, authenticity, and rights operations in the sector.
Standard-setting and government-backed frameworks are also becoming more explicit for tokenized media assets and rights ledgers. The International Telecommunication Union published ITU-T Recommendation F.751.27 in March 2025, defining a framework and security requirements for DLT-based multimedia data asset services, which offers a reference point for auditability and risk controls. In the EU, Regulation (EU) 2025/2531 (adopted in December 2025) established reference standards for qualified electronic ledgers under eIDAS, supporting legally anchored ledger designs for rights registries and transaction records, while China published T/ZDMIA 004-2025 (July 2025) specifying blockchain certification system requirements for digital cultural and creative products.
Value Chain Analysis
The value chain starts with content origination (artists, studios, publishers, leagues, and creators) and runs through production, distribution, and monetization layers, with blockchain typically inserted at points where provenance, entitlements, and payments must be reconciled across many parties. Rights definition and metadata creation feed smart contracts that encode ownership splits, usage terms, and royalty rules, then connect to distribution endpoints (streaming, gaming platforms, ticketing, and merchandising) and advertising workflows where impressions and outcomes are logged for audit. Technology providers supply the core rails (public chains such as Ethereum, enterprise stacks such as IBM Hyperledger Fabric, and newer sector-focused chains such as Story), alongside node infrastructure, identity and wallet tooling, oracle services for off-chain events, and systems integrators that connect on-chain logic to M&E back offices.
Downstream, revenue settlement and compliance services (stablecoin rails, reporting, tax, and fraud detection) close the loop by enabling near-real-time payout execution and ledger-based audit trails. Industry initiatives are tightening interfaces: IAB Tech Lab published Accountability Platform Version 1.0 in November 2024 to standardize auditable data structures for tracking data use preferences and restrictions across the digital advertising supply chain, aligning with on-chain verification use cases. Commercial execution is also extending into IP monetization infrastructure, such as Vobile and Finloop Financial Technology Holdings Limited launching a creative IP rights real-world asset program (June 2026) to tokenize up to USD 100 million in film, video, and music rights on Ethereum and Stellar, and Barunson announcing nPLUG (September 2025) on Story to enable legal IP remixing with embedded attribution and royalty splits. Key bottlenecks remain interoperability across chains and rights metadata, scalability for high-volume content events, regulatory ambiguity around tokenized IP and revenue, and user experience gaps for non-technical creators and rights teams.
Competitive Landscape
The marketplace remains fragmented, with no vendor exceeding a 10% share, resulting in a concentration score of 3. Cloud giants AWS, Microsoft, and Oracle package blockchain-as-a-service, locking in studios that value support contracts over maximum decentralization.[4] Blockchain natives like Theta Labs and Livepeer chase creators with token incentives and revenue splits of 90 percent or more, vying to rearchitect video delivery models. Consulting integrators Accenture, Ernst and Young, Infosys monetize bespoke consortium builds and maintenance, bridging enterprise needs to protocol layers.
Differentiation arcs around decentralization versus governance. Public-chain advocates stress composability and global liquidity; enterprise leaders prize validator allowlists and private data channels. Zero-knowledge proof deployments attempt to reconcile both camps, enabling privacy on public rails, though production rollouts were scarce in 2024. ISO’s brand-new interoperability standard may accelerate vendor consolidation as protocols converge; yet, proprietary ecosystems defend incumbency for now, preserving fragmentation within the blockchain in the media, advertising, and entertainment market.
Looking forward, white-space opportunities exist for orchestration middleware that stitches public NFT markets to private studio ledgers. Chainlink CCIP and LayerZero already target this niche, and early adopters cite smoother asset mobility and shorter integration cycles as key benefits. Cross-chain services could become the kingmakers, granting them outsize influence over the blockchain in the media, advertising, and entertainment industry’s eventual platform hierarchy.
Blockchain In Media, Advertising, And Entertainment Industry Leaders
-
IBM Corporation
-
Microsoft Corporation
-
Ernst and Young Global Limited
-
The Bitfury Group Limited
-
SAP SE
- *Disclaimer: Major Players sorted in no particular order
Blockchain In Media, Advertising, And Entertainment Market Companies Covered in this Report
- IBM Corporation
- Microsoft Corporation
- Ernst and Young Global Limited
- The Bitfury Group Limited
- SAP SE
- Accenture plc
- Amazon Web Services Inc.
- Oracle Corporation
- Infosys Limited
- ConsenSys Software Inc.
- R3 HoldCo LLC
- Dapper Labs Inc.
- Livepeer Inc.
- Theta Labs Inc.
- VeChain Foundation
- Animoca Brands Corporation Limited
- Chainalysis Inc.
- Mattereum Limited
- Rally Network PBC
- Braintrust Holdings LLC
Read Analysis of Blockchain In Media, Advertising, And Entertainment Companies
Market Opportunities and Future Outlook
A near-term opportunity is verifiable, outcome-linked programmatic advertising, where smart contracts and on-chain logs reduce reconciliation overhead and fraud exposure across fragmented supply chains. This aligns with the market driver around ad fraud (USD 84 billion in losses during 2024, per the report context) and matches activity already documented in 2026, including Blockboard launching BlockVantage (January 2026) to embed smart contract verification into programmatic buying, and LG Electronics confirming development of a blockchain-based advertising platform on Arbitrum following a pilot with Hakuhodo (June 2026). Together, these moves expand the addressable scope beyond crypto-native ad networks into brand and agency stacks that already manage identity, measurement, and governance.
A second whitespace area is enterprise-grade IP and royalty infrastructure that links tokenized rights, licensing terms, and settlement into operable workflows rather than one-off NFT drops. Vobile’s June 2026 real-world asset program for creative IP rights and KOR Protocol’s Series A funding (USD 7.5 million, July 2026) for a creative asset clearinghouse highlight demand for rights registries and clearing layers that support AI-era provenance, multi-party attribution, and distribution of proceeds. Platform strategies are also forming around scalable rails for entertainment transactions, such as Sony outlining a migration strategy for entertainment IP to its Soneium Ethereum Layer 2 network (April 2026), which targets higher-throughput deployments while keeping interoperability with broader Ethereum tooling. Across media segments, the opportunity concentrates where many stakeholders touch the same asset (music splits, film residuals, sports tickets and collectibles) and where hybrid or consortium networks can satisfy confidentiality needs while still providing auditable proof for partners and regulators.
Recent Industry Developments in Blockchain In Media, Advertising, And Entertainment Market
- April 2026: Microsoft and Publicis Groupe expanded their strategic partnership to build a full-stack marketing solution combining AI agents, identity-based data, and unified marketing workflows on Microsoft Azure and Epsilon infrastructure. The collaboration strengthens enterprise-grade integration between media buying, data governance, and automation layers, creating a clearer path for blockchain-backed verification and audit trails to plug into existing ad-tech stacks.
- January 2026: IBM and the Recording Academy introduced GRAMMY IQ, an agentic AI digital experience built on IBM watsonx to support fan engagement and data-driven experiences around the 2026 GRAMMY Awards. The deployment highlights how large rights holders and media brands are modernizing digital engagement and content operations, increasing demand for complementary provenance, rights, and consent controls that blockchain platforms provide.
- April 2024: Axel Springer and Microsoft expanded their partnership across advertising, AI content, and Azure services to deepen technology collaboration and commercial offerings. The move reinforced Azure’s position in media and advertising modernization programs, supporting broader adoption of blockchain-adjacent components such as identity, auditability, and rights management within enterprise deployments.
Blockchain In Media, Advertising, And Entertainment Market Report Scope and Research Methodology
Market Definition and Coverage
This market tracks revenues generated from blockchain-based solutions and related services used across media, advertising, and entertainment workflows, where the technology is applied to rights management, content security, payments, and ad transparency. We count spending that is directly tied to delivering or operating these blockchain capabilities.
Scope exclusions: We exclude the face value of crypto asset trading and broad consumer NFT resale activity when it is not tied to a measurable media, advertising, or entertainment service deliverable.
Segments Covered in This Report
- By Type of Blockchain
- Public
- Private
- Consortium / Hybrid
- By Enterprise Size
- Small and Medium Enterprises
- Large Enterprises
- By Application
- Licensing and Rights Management
- Digital Advertising
- Smart Contracts
- Payments
- Online Gaming
- Live Streaming
- Other Applications
- By Media Segment
- Music
- Film and TV
- Advertising Content
- Gaming
- Sports
- News and Publishing
- Other Media Segments
- By Geography
- North America
- United States
- Canada
- Mexico
- South America
- Brazil
- Argentina
- Rest of South America
- Europe
- Germany
- United Kingdom
- France
- Italy
- Spain
- Rest of Europe
- Asia-Pacific
- China
- Japan
- India
- South Korea
- Australia
- Rest of Asia-Pacific
- Middle East and Africa
- Middle East
- Saudi Arabia
- United Arab Emirates
- Turkey
- Rest of Middle East
- Africa
- South Africa
- Nigeria
- Egypt
- Rest of Africa
- Middle East
- North America
Data Sources, Market Sizing, and Validation
Desk Research
Desk work starts by mapping the adoption signals that sit behind blockchain use in these industries, and then translating them into measurable spending lines. Public and official sources are used to anchor the broader demand context, such as US Bureau of Economic Analysis data for media-related output, US Census Bureau and Eurostat series for digital services activity, and telecom and internet indicators published by bodies such as the International Telecommunication Union.
We also use sources that explain how use cases are forming in practice, such as WIPO and USPTO patent filings to see where innovation is clustering, peer-reviewed papers on content provenance and rights automation, and open releases from standards and industry groups that discuss identity, smart contracts, and tokenization. Company filings, earnings decks, developer documentation, and reputable press are then reviewed to sanity check go-to-market focus and pricing direction, and a paid subscription covering company financials and news is used to speed up cross-checks. The desk research sources listed here are illustrative only, and many other public references were also reviewed for data collection, validation, and clarification.
Primary Interviews and Surveys
Primary work is used to pressure-test adoption timing and the parts of spending that can be reliably counted, especially where announcements do not convert into production deployments. We spoke with solution teams, media and ad operations leaders, platform and studio stakeholders, and services partners across APAC, EMEA, and the Americas, and then adjusted the assumptions where multiple respondents pointed to the same rollout constraints or pricing reality.
Distribution of primary research fieldwork respondents
| Company type | Respondent position | Region |
|---|---|---|
| Top tier: 31% | CXOs: 12% | APAC: 43% |
| Mid tier: 53% | Functional/Unit leaders: 35% | EMEA: 31% |
| Smaller Players: 16% | Managers: 53% | Americas: 26% |
Market-Sizing & Forecasting
The core model is built top-down by reconstructing the addressable spend pool from media, advertising, and entertainment digitization trends, and then applying penetration rates for blockchain-enabled use cases that respondents confirm are budgeted today. To keep totals realistic, we corroborate results with selective bottom-up checks, such as sampled vendor price ranges applied to likely deployment volumes, and channel feedback on typical contract sizes for pilots versus scaled rollouts.
Key inputs include the mix shift toward programmatic advertising and digital video, the pace of streaming and gaming platform growth, reported incidence of ad fraud and invalid traffic controls, and the maturity curve for smart contract-based rights and royalty workflows. We also track the split between permissioned and public network deployments, enterprise-size adoption patterns, and services intensity during integration, since these factors change the revenue captured in early years. Forecasts are produced using scenario analysis, where an adoption case is linked to variables like enterprise rollout cycles, regulatory comfort with tokenized assets, and expected improvements in interoperability, and then validated through expert consensus from interviews. Where bottom-up evidence is thin, we leave gaps unfilled and instead use conservative ranges that are tightened only after multiple independent confirmations.
Data Validation & Update Cycle
Validation is done by comparing model outputs against independent signals, such as enterprise blockchain deployment commentary, pricing direction for managed blockchain and integration work, and the observed cadence of pilots converting to production. Outliers are flagged when growth implies unrealistic jumps in deployment counts or when implied spending per client drifts away from what interviews and public disclosures suggest.
Before sign-off, the estimates go through a multi-step analyst review where assumptions are rechecked, calculations are rerun, and key variances are explained in plain terms so they can be defended in a call. Reports are refreshed annually, and interim updates are triggered by material events like major regulatory changes, sharp shifts in tokenization activity tied to media assets, or visible changes in advertising measurement standards. Right before delivery, a final pass is completed so the numbers reflect the latest available data and any late-breaking market signals.
Mordor Intelligence's Media Advertising and Entertainment Blockchain Market Estimate Compared With Other Published Estimates
Published market sizes for blockchain in media, advertising, and entertainment can look far apart because each publisher chooses different revenue lines, timing assumptions, and what they count as real deployment versus intent. We keep the approach explainable by tying the model to observable demand signals and then checking it with interviews so the final number is not driven by a single bold assumption.
The main gap driver is whether token and NFT-related activity is counted as market revenue, and Mordor Intelligence treats the scope as technology and services spending linked to media, ad, and entertainment use cases rather than the traded value of digital assets. Other differences usually come from base year choice, whether services are bundled with solutions, how fast average contract values are allowed to rise, and how currency conversion timing is handled across regions.
Benchmark comparison
| Source | Market Size | Gaps in Research Methodology |
|---|---|---|
| Mordor Intelligence | USD 4.46 B (2026) | |
| Global Consultancy A | USD 6.35 B (2025) | This estimate uses an earlier base year and appears to include broader blockchain categories like tokenization and decentralized apps without consistently separating pure digital asset activity from media and advertising service revenues, which can inflate the near-term total. |
| Industry Research Group B | USD 1.10 B (2023) | This number is tied to a narrower early-stage adoption view and a different base year, with scope that can lean more toward solution revenue in core applications, which tends to undercount integration and managed services that drive a large share of spending during rollout years. |
Across the three figures, the spread is mostly explained by scope decisions and timing, rather than a disagreement that adoption is accelerating. Our sizing stays traceable because it links revenue to a defined set of use cases, keeps assumptions like penetration and services intensity visible, and then rechecks them against what implementers and buyers say is actually being purchased.
Key Questions Answered in the Report
How big is the blockchain in media, advertising, and entertainment market in 2026?
It stands at USD 4.46 billion and is projected to grow sharply to USD 40.44 billion through 2031.
What is the forecast CAGR for blockchain in media and entertainment through 2031?
The market is expected to register a robust 55.42% CAGR from 2026 to 2031.
Which segment is expanding fastest within blockchain media applications?
Smart contracts for licensing and royalty management are advancing at a 61.35% CAGR.
Which region will witness the strongest growth?
Asia Pacific is set to record a 60.35% CAGR, outpacing all other regions.
Why are sports organizations embracing blockchain?
Tokenized tickets and fan tokens unlock new revenue and engagement, leading the sports vertical to a 60.95% CAGR.
What is the main barrier to wider blockchain adoption in media?
Regulatory ambiguity around tokenized revenue remains the most significant constraint.