
Black Tea Extracts Market Size and Share
Market Overview
| Study Period | 2021 - 2031 |
|---|---|
| Market Size (2026) | USD 8.96 Billion |
| Market Size (2031) | USD 11.13 Billion |
| Growth Rate (2026 - 2031) | 4.44 % |
| Fastest Growing Market | Middle East and Africa |
| Largest Market | Europe |
| Market Concentration | Medium |
Major Players
*Disclaimer: Major Players sorted in no particular order Image © Mordor Intelligence. Reuse requires attribution under CC BY 4.0. |
|
Black Tea Extracts Market Analysis by Mordor Intelligence
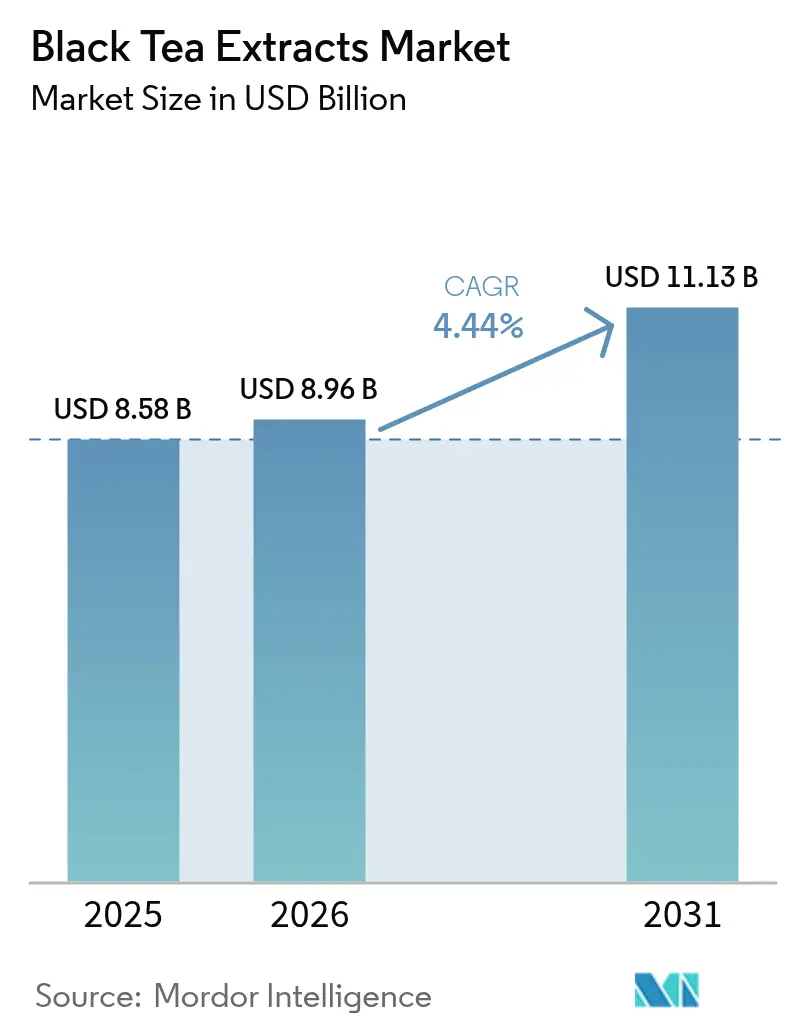
The black tea extract market size was valued at USD 8.58 billion in 2025 and estimated to grow from USD 8.96 billion in 2026 to reach USD 11.13 billion by 2031, at a CAGR of 4.44% during the forecast period (2026-2031). This growth is driven by the increasing adoption of black tea extracts in functional foods, dietary supplements, and cosmetics, where polyphenol-rich botanicals are replacing synthetic additives due to their health-enhancing properties and consumer preference for natural ingredients. Europe currently leads the market, supported by stringent organic regulations, a well-established premium ingredient culture, and high consumer awareness regarding health and wellness. Meanwhile, the Middle East and Africa is experiencing the fastest growth, attributed to rising health consciousness, expanding local processing hubs, and increasing investments in regional production capabilities. However, supply chain disruptions, particularly delays in Red Sea shipping routes, are prompting manufacturers to diversify sourcing strategies and enhance regional extraction capacities to mitigate risks. Additionally, technological advancements, such as the development of clear, cold-water-soluble concentrates, are broadening the scope of applications in the beverage industry, further driving market growth.
Key Report Takeaways
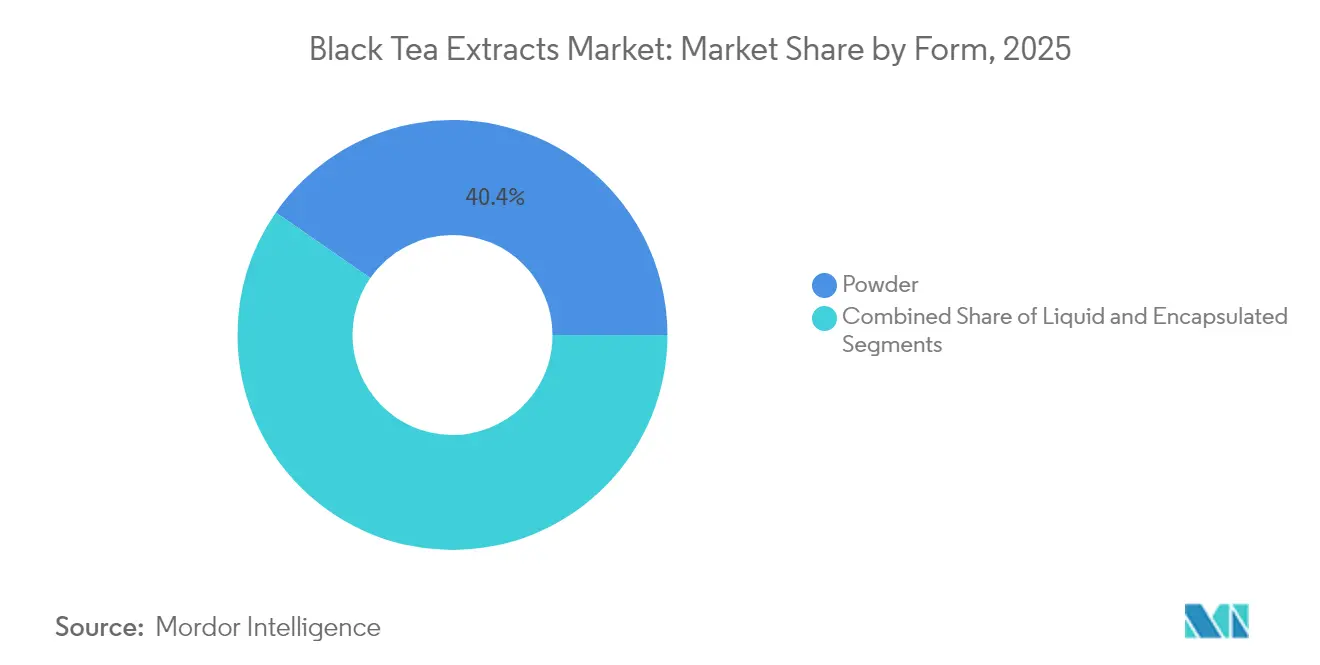
- By form, powder products held 40.35% revenue share in 2025, while liquid extracts are projected to post the fastest 4.48% CAGR through 2031.
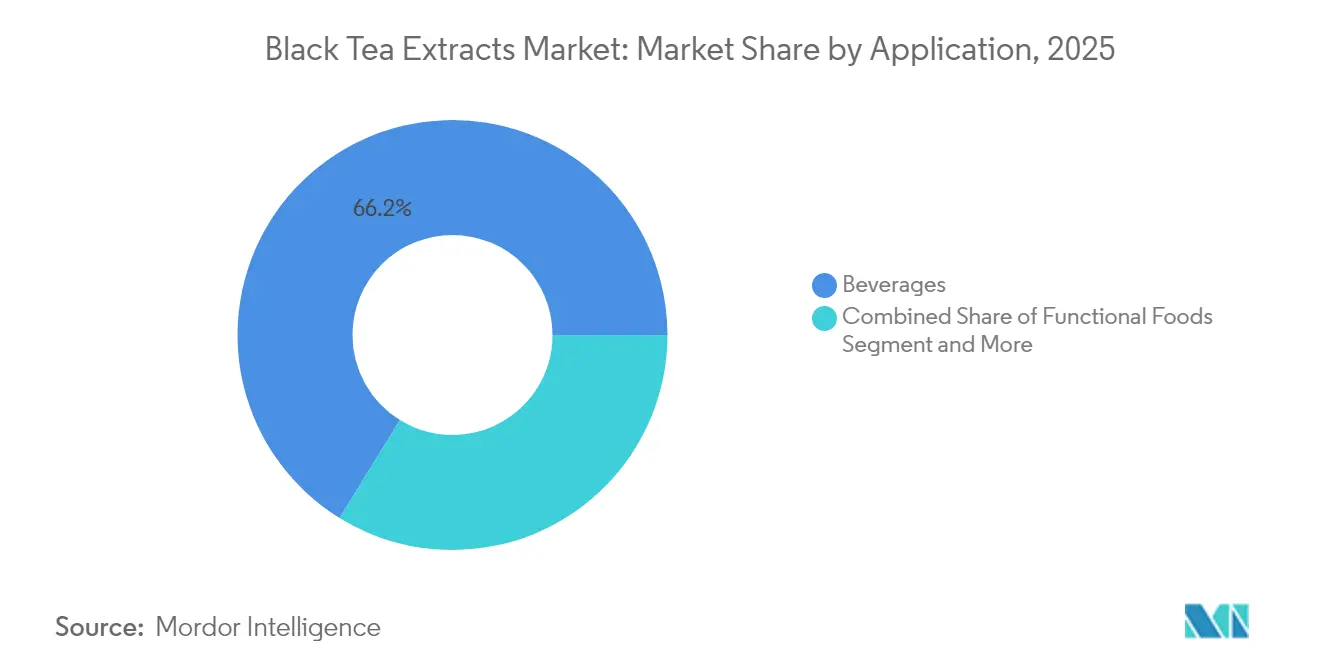
- By application, beverages captured 66.20% revenue share in 2025; dietary supplements are on track for a 4.86% CAGR through 2031.
- By type, hot-water-soluble variants dominated with a 62.90% share in 2025, while cold-water-soluble products are expected to expand at a 4.8% CAGR through 2031.
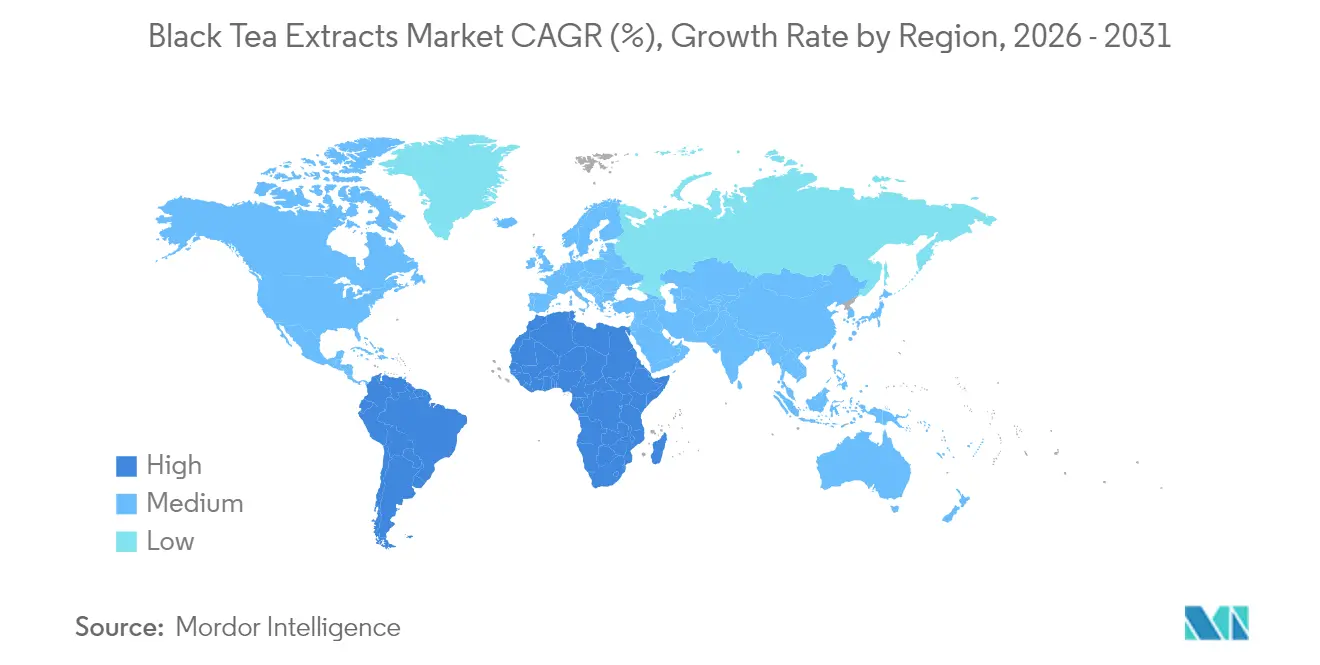
- By geography, Europe commanded a 35.20% share in 2025; the Middle East and Africa region is set to grow fastest at 4.26% CAGR through 2031.
Note: Market size and forecast figures in this report are generated using Mordor Intelligence’s proprietary estimation framework, updated with the latest available data and insights as of 2026.
Market Trends and Insights
Drivers Impact Analysis of Black Tea Extracts Market*
| Drivers | (~) % Impact on CAGR Forecast | Geographic Relevance | Impact Timeline |
|---|---|---|---|
| Rising consumer inclination toward natural and plant based ingredients | +0.8% | Global, with strongest impact in North America and Europe | Medium term (2-4 years) |
| Expanding use of black tea extract in functional beverages | +0.6% | Global, led by Asia-Pacific and North America | Short term (≤ 2 years) |
| Health benefits of polyphenols and antioxidants in black tea | +0.5% | Global, with premium segments in developed markets | Long term (≥ 4 years) |
| Surge in use of black tea extract in dietary supplements | +0.4% | North America and Europe, expanding to Asia-Pacific | Medium term (2-4 years) |
| Inclusion of black tea extract in nutracetical and wellness products market | +0.3% | Global, concentrated in urban markets | Medium term (2-4 years) |
| Surging demand for organic and sustainable ingredients | +0.2% | Europe and North America, emerging in Middle East and Africa | Long term (≥ 4 years) |
| Source: Mordor Intelligence | |||
Rising Consumer Inclination Toward Natural and Plant Based Ingredients
Consumer preferences are increasingly shifting toward natural ingredients, driven by regulatory frameworks that prioritize plant-based alternatives over synthetic additives. The U.S. Department of Agriculture's Foreign Supplier Verification Programs highlight the growing regulatory focus on imported ingredients, ensuring safety and authenticity through compliance programs involving companies across all 50 states. Similarly, EU Regulation 2018/848 establishes stringent organic certification standards in Europe, creating premium market opportunities for certified black tea extracts while restricting access for non-compliant suppliers[1]The European Commission, "Commission Implementing Regulation (EU)", www.eur-lex.europa.eu. The Food and Agriculture Organization's standards framework further supports this trend by promoting harmonized international regulations for organic production. As a result, black tea extracts are gaining traction as preferred alternatives to synthetic antioxidants in food preservation applications, offering both functional and market advantages. Beyond food applications, this shift is also evident in the cosmetics and personal care industries, where natural ingredient claims are driving premium product positioning and fostering strong consumer loyalty. The regulatory landscape and evolving consumer preferences collectively position black tea extracts as a natural and plant-based solution across multiple industries.
Expanding Use of Black Tea Extract in Functional Beverages
The functional beverage market is experiencing rapid growth, driven by technological advancements that preserve bioactive compounds while enhancing product functionality and consumer appeal. According to the Institute of Food Technologists, there is an increasing incorporation of tea extracts into ready-to-drink beverages, soups, and other innovative culinary applications[2]The Institute of Food Technologists, "Coffee Talk and Tea Time", www.ift.org. Companies are actively developing specialized tea concentrates and flavorings to cater to diverse food product formulations, reflecting the market's dynamic nature. Advanced extraction technologies are enabling manufacturers to produce premium functional beverages with higher bioactive content, meeting the growing demand for health-focused products. Additionally, innovations in cold-water solubility are expanding the application range of tea extracts, particularly in convenience-oriented products that align with modern consumer preferences. The functional beverage segment continues to benefit from increasing consumer demand for health-enhancing drinks that combine the traditional benefits of tea with modern convenience and improved taste profiles. This trend underscores the market's potential for sustained growth, driven by a combination of technological innovation, strategic regional investments, and evolving consumer preferences.
Health Benefits of Polyphenols and Antioxidants in Black tea
Scientific validation of black tea's health benefits continues to drive sustained demand across multiple application sectors. Extensive research on polyphenols has demonstrated their significant antioxidant and anti-inflammatory properties, which support a wide range of health claims. According to the International Institute for Sustainable Development's global tea market report, these health benefits have been a key factor in increasing tea consumption, particularly during the COVID-19 pandemic, when consumers actively sought beverages with immune-supporting properties. The growing understanding of polyphenol bioavailability has led to the development of advanced delivery systems, such as encapsulation technologies. These systems protect sensitive compounds during processing and storage while enhancing their absorption in the human body, ensuring maximum efficacy. Theaflavins and thearubigins, compounds unique to black tea's fermentation process, provide distinct antioxidant profiles that differentiate black tea extracts from other botanical alternatives in functional food applications. This scientific validation of health benefits has accelerated black tea's adoption in dietary supplements, functional foods, and cosmetic applications, where its antioxidant properties deliver measurable consumer benefits and support premium positioning strategies in the market.
Surge in Use of Black Tea Extract in Dietary Supplements
The dietary supplements sector is experiencing significant growth, driven by increasing consumer interest in preventive healthcare and the nutraceutical industry's shift toward natural ingredient formulations. The personalized nutrition trends and the rising demand for immune health support are key factors accelerating the adoption of natural ingredients. This creates a favorable market for black tea extracts, which are well-documented for their antioxidant and anti-inflammatory properties. Stability challenges in liquid formulations are being addressed through encapsulation technologies, while advanced processing methods enable the production of powder forms that preserve the integrity of bioactive compounds during extended storage. The Tea Alliance of Nepal highlights the critical role of international certifications, such as USDA Organic, EU Organic, and Fair Trade, for tea producers aiming to penetrate premium supplement markets[3]The Tea Alliance of Nepal, "Tea Standards & Certifications", www.tan.org.np. These certifications are essential in meeting stringent quality standards and traceability requirements, which often act as barriers for non-compliant suppliers. Furthermore, regulatory frameworks in established supplement markets support health claims for tea polyphenols, allowing manufacturers to achieve higher profit margins while meeting consumer demand for scientifically validated ingredients.
Restraints Impact Analysis of Black Tea Extracts Market*
| Restraint | (~) % Impact on CAGR Forecast | Geographic Relevance | Impact Timeline |
|---|---|---|---|
| Limited shelf life and stability of liquid extracts | -0.4% | Global, particularly in hot climates and developing markets | Short term (≤ 2 years) |
| High cost of organic and high purity black tea extracts | -0.3% | Price-sensitive markets in Asia-Pacific and emerging economies | Medium term (2-4 years) |
| Presence of substitutes like green tea, matcha, and herbal blends | -0.2% | Global, with stronger impact in health-conscious segments | Medium term (2-4 years) |
| Price sensitivity in cost-conscious market | -0.1% | Emerging markets and bulk applications | Short term (≤ 2 years) |
| Source: Mordor Intelligence | |||
Limited Shelf Life and Stability of Liquid Extracts
Stability challenges in liquid extracts significantly hinder operational efficiency, particularly due to the accelerated degradation of polyphenols under heat and light exposure, conditions prevalent in global supply chains. Although advanced preservation technologies provide partial solutions, their high implementation costs and technical complexities restrict adoption, especially among smaller manufacturers lacking access to sophisticated processing equipment. In developing markets, the issue is exacerbated by limited cold chain infrastructure, which accelerates product degradation. Consequently, manufacturers are often forced to invest in protective packaging or transition to powder formulations that offer better shelf stability. Industry efforts to address these constraints are evident in patent innovations focusing on encapsulation and preservation methods. However, these solutions introduce additional processing costs and complexities, which can increase product prices and limit market accessibility. To counter these challenges, the development of natural preservation systems has gained momentum. These systems aim to extend shelf life without compromising product quality or significantly raising production costs, reflecting the industry's commitment to balancing sustainability, affordability, and operational efficiency.
High Cost of Organic and High Purity Black Tea Extracts
Premium extract pricing creates significant barriers to market access, particularly in cost-sensitive segments where synthetic alternatives provide similar functionality at much lower costs. Compliance, testing, and supply chain verification processes drive up the costs of organic certification. Additionally, producing high-purity extracts necessitates advanced processing technologies, which further elevate both capital and operational expenditures. Supply chain disruptions, such as Red Sea shipping delays that extend delivery times by 10-14 days, exacerbate these challenges by increasing logistics expenses and inventory carrying costs. This cost disparity is especially pronounced in bulk applications, where purchasing decisions are primarily driven by functionality rather than premium positioning. However, the premium pricing structure creates opportunities in value-added applications, particularly in cosmetics and nutraceuticals. In these sectors, consumers are more willing to pay a premium for certified organic and sustainably sourced ingredients. The key challenge lies in developing cost-efficient processing methods that preserve quality standards while achieving price points accessible to broader market segments. Addressing this issue could enable organic extracts to expand their reach beyond premium applications and gain traction in more cost-conscious markets.
*Our forecasts treat driver/restraint impacts as directional, not additive. The impact forecasts reflect baseline growth, mix effects, and variable interactions.
Black Tea Extracts Market Segment Analysis
By Form:
Powder Extracts Lead Market ShareIn 2025, powder extracts dominate the market with a 40.35% share, thanks to their stability, ease of handling, and versatility in food, beverage, and supplement manufacturing. The Institute of Food Technologists underscores the advantages of encapsulation, especially in safeguarding sensitive ingredients like tea polyphenols. Powder forms not only extend shelf life but also enhance functionality across various food applications. Thanks to advanced spray-drying and freeze-drying technologies, manufacturers can now preserve bioactive compounds, producing powders that are instantly applicable. Moreover, these innovations ensure the standardized potency levels essential for supplement formulations. The powder segment enjoys manufacturing efficiency and cost benefits, especially in bulk applications, where consistent quality and a longer shelf life offer clear advantages over liquid counterparts.
Liquid extracts are on the rise, boasting the fastest growth rate at a 4.48% CAGR through 2031. This surge is fueled by the demand for liquid black tea extract in ready-to-drink beverage applications and advancements in processing technologies that tackle traditional stability issues. The liquid segment caters to premium markets, where the need for immediate solubility and enhanced bioavailability justifies the higher price tag. This is especially true for functional beverages and niche cosmetic products. Thanks to technological strides, manufacturers can now craft liquid concentrates that boast better stability without compromising the sensory attributes that make liquid extracts so desirable in specific applications.


By Type:
Hot-Water-Soluble Extracts Dominate ApplicationsIn 2025, hot-water-soluble extracts hold a commanding 62.90% market share, reflecting the well-established manufacturing processes across beverage and food applications. Hot-water-soluble extracts deliver brew-like flavor profiles while achieving high concentration levels, making them ideal for commercial applications. Their widespread consumer acceptance and proven functionality in traditional tea products provide manufacturers with consistent performance and reliable quality. This segment effectively supports both conventional and innovative applications, where hot preparation methods align seamlessly with product positioning and consumer preferences, ensuring sustained market leadership.
Cold-water-soluble variants exhibit significant growth potential, with a projected CAGR of 4.8%, driven by the increasing demand in the ready-to-drink beverage market and increasing consumer demand for convenient preparation methods that preserve heat-sensitive compounds. Nestec's patented cold-water-soluble instant tea technology addresses traditional solubility challenges by eliminating caffeine-polyphenol precipitates, which often cause cloudiness in cold beverages. This innovation enables the production of clear, high-quality formulations that meet evolving consumer expectations. Although the cold-water-soluble segment requires advanced processing techniques that elevate production costs, it allows for premium product positioning in the convenience-focused market. Technical advancements, such as co-extraction methods, ensure cold-water solubility without the use of chemical additives, resulting in products with superior stability and organoleptic properties, making them highly suitable for ready-to-drink applications.
By Application:
Beverages Maintain Market LeadershipIn 2025, the beverages segment holds a dominant 66.20% market share, driven by a diverse portfolio that includes traditional tea products, functional drinks, and ready-to-drink formulations. These products leverage black tea's strong consumer acceptance and scientifically backed health benefits. Traditional beverage applications benefit from well-established consumer familiarity and robust supply chains, while innovations in functional beverages unlock premium market opportunities by offering enhanced health benefits and improved convenience. This segment effectively caters to both mass-market and premium consumers, with product differentiation achieved through advanced processing techniques, superior ingredient quality, and strategic functional positioning.
The dietary supplements segment is poised to be the fastest-growing application, with a projected CAGR of 4.86% through 2031. This growth aligns with the rapid expansion of the nutraceutical industry and a growing consumer focus on preventive healthcare, particularly through the use of natural ingredients. Personalized nutrition trends and a heightened emphasis on immune health as key factors driving the adoption of natural ingredients in supplement formulations. The segment benefits from higher profit margins and opportunities for premium positioning, supported by standardized extract formulations that ensure precise dosing and credible health claims. Additionally, regulatory frameworks in developed markets validate health claims for tea polyphenols, creating significant opportunities for suppliers who can substantiate product efficacy and safety through rigorous clinical validation.
Geography Analysis
Europe Black Tea Extracts Market
In 2025, Europe secures a leading 35.20% market share, driven by advanced regulatory frameworks that prioritize organic and sustainably certified ingredients. These frameworks not only enhance product quality but also create premium positioning opportunities for suppliers adhering to compliance standards. The European Commission's regulations, which authorize specific products for organic production, establish stringent benchmarks that ensure quality while restricting market access to certified suppliers. European consumers exhibit a strong preference for products with certified organic tea extract ingredients, willingly paying premium prices for products backed by established certification programs such as the Rainforest Alliance. Furthermore, the region's strict Maximum Residue Levels for pesticides in tea, combined with robust traceability requirements, ensure product safety, authenticity, and compliance with quality standards, enabling suppliers to command premium pricing. This regulatory rigor and consumer demand position Europe as a key market for high-quality organic tea extracts.
MEA Black Tea Extracts Market
The Middle East and Africa region is projected to achieve the highest growth, with a 4.26% CAGR through 2031. This growth is fueled by increasing health awareness, improving regulatory frameworks, and the region's strategic positioning as a global trade hub for natural ingredients. The UAE exemplifies this trend, emerging as a key tea processing center. The Dubai Multi-Commodities Center for Tea and Coffee, which hosts 17,500 member companies and contributes 10% to Dubai's GDP in 2025, highlights the UAE's commitment to becoming a leading distribution hub for tea and related products. In Saudi Arabia, the expanding food retail sector and the growth of the food processing industry create significant opportunities for black tea extract manufacturers. Additionally, the region's strategic geographic location, situated between major tea-producing countries and expanding consumer markets, facilitates efficient distribution and processing operations. This advantageous positioning, combined with growing demand for natural and health-focused products, underscores the Middle East and Africa's potential as a critical growth region in the global tea extract market.
The Americas and APAC Black Tea Extracts Market
Asia-Pacific serves as a key production and consumption hub for black tea extracts, with India and China leading in cultivation and advancing value-added processing, supported by government initiatives despite challenges in quality standardization. North America shows steady demand growth fueled by consumer preference for natural ingredients, strong regulatory oversight, and advanced processing capabilities, although recent tariffs on imports have led to strategic shifts in sourcing. Meanwhile, South America is emerging as a vital source of organic tea, bolstered by improving certification systems and governmental support, positioning the region as a sustainable partner in global tea extract supply chains.

Regulatory Landscape
Regulation for black tea extracts spans food, supplement, and cosmetics end uses, with tighter documentation and safety assurance requirements for imported botanicals. In Europe, black tea extracts used as ingredients must align with EU organic rules (EU Regulation 2018/848 for certified organic supply) and broader EU food safety and additive oversight, while EFSA updated guidance in 2026 on data requirements used in food additive risk assessment. This raises the bar for dossiers and specification control where extracts function as improvement agents, or where risk assessment is triggered by use and claims.
On the trade and import side, compliance is increasingly shaped by import licensing, phytosanitary controls, and local testing regimes. A concrete example is India, where Tea Board of India Directive 02/2026 (July 2026) mandated 100% testing for re-export tea consignments through FSSAI-notified labs, which increases lead times and testing costs for export-oriented supply chains. Similar import management and permitting requirements (plant import permits and phytosanitary certificates) across jurisdictions, combined with digitized licensing workflows (including WTO-tracked import licensing procedures), reinforces the need for traceability, Certificates of Analysis, and residue-management programs for tea-derived extracts.
Value Chain Analysis
The black tea extracts value chain begins with cultivation and primary processing of fully fermented Camellia sinensis leaves, followed by procurement through auctions, direct sourcing, and long-term grower relationships. Major sourcing corridors link to tea-producing origins including India, China, and Kenya. Ingredient manufacturers and specialized extractors then convert bulk tea into standardized concentrates and powders, sold largely through B2B channels to beverage, functional food, dietary supplement, and personal-care formulators, as well as to contract manufacturers supporting brand owners.
Core processing typically includes withering, hot water extraction (commonly around 80-90C), separation (filtration or centrifugation), concentration (evaporation), and drying, often via spray drying for powder formats. Differentiation and quality assurance sit mid-chain through specification setting and testing for theaflavins, total polyphenols, caffeine, microbiological limits, and physical parameters (particle size, bulk density). Added steps, such as enzymatic treatments (for yield and solubility adjustment) and haze-reduction approaches for beverage grades, are used to meet formulation needs. Logistics and regional warehousing weigh more heavily for liquid extracts due to stability constraints and temperature exposure risks, which encourages some suppliers and buyers to shift toward powder or encapsulated formats for longer-distance distribution.
Competitive Landscape
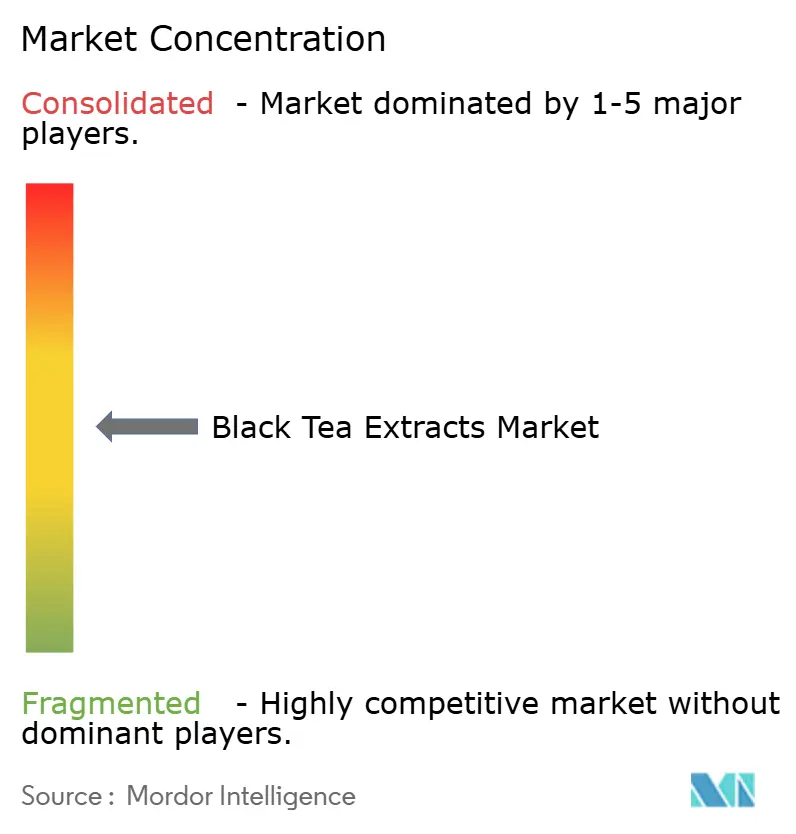
The global black tea extract market exhibits a moderately consolidated structure, with a few prominent players holding significant market shares, while regional and niche companies compete on specialized formulations. Some of the key players in the market include Swire Group, The Archer-Daniels-Midland Company, Synthite Industries Ltd., MartinBauer, and A.V. Thomas Group.
Major firms, capitalizing on vertical integration and expansive global distribution networks, have solidified their foothold, especially in functional food, beverage, and nutraceutical sectors. Meanwhile, mid-sized and local manufacturers are making their mark by emphasizing organic certifications, clean-label ingredients, and sourcing specific to their regions.
As consumers increasingly prioritize health and wellness, competition has surged around value-added extracts, notably decaffeinated and polyphenol-rich variants. Despite the dominance of established players, avenues for emerging brands remain open, particularly through innovation, research and development, and sustainable practices. With demand surging in North America, Asia-Pacific, and Europe, the market is poised for heightened collaboration and consolidation activities.
Black Tea Extracts Industry Leaders
-
The Archer-Daniels-Midland Company
-
Synthite Industries Ltd.
-
MartinBauer
-
Swire Group
-
A.V. Thomas Group
- *Disclaimer: Major Players sorted in no particular order
Black Tea Extracts Market Companies Covered in this Report
- The Archer-Daniels-Midland Company
- Synthite Industries Ltd.
- MartinBauer
- Mlesna Tea
- Apex Flavors, Inc.
- Medikonda Nutrients
- A.V. Thomas Group
- Swire Group
- Phyto Life Sciences P. Ltd
- Teawolf, LLC
- Cymbio Pharma Pvt Ltd
- Blueberry Agro Products PVT. LTD.
- Foodchem International Corporation
- Shaanxi Dongyu Bio-Tech Co., Ltd.
- Kemin Industries Inc.
- Taiyo Kagaku Co Ltd
- Hälssen & Lyon
- Hayleys PLC
- Hunan Nutramax Inc.
- Huisong Inc

Market Opportunities and Future Outlook
Product and process innovation is creating room for higher-performance extracts tailored to modern beverage formats, especially clear and stable solutions for cold-fill and ready-to-drink applications. Patent and research activity points to opportunities in precise polyphenol targeting and higher-value positioning. In January 2026, Jiangsu Dehe Biological Technology Co., Ltd. was granted US Patent 12,533,386 covering an enzyme-catalyzed fermentation method to prepare black tea extract with high theaflavin content, supporting differentiation around standardized actives. Academic work also continues to refine powder extract performance, including a May 2026 Foods (MDPI) paper that describes an aqueous ethanol extraction approach for producing instant black tea powder with quantified theasinensin A levels of 457.60 mg/100 g, reinforcing the move toward more measurable, application-led specifications.
Supply chain localization and regional capacity are another opportunity area as buyers manage longer transit times and disruption risk on global routes. April 2026 activity from Layn Natural Ingredients, highlighting tea extract and instant tea powder concepts and indicating manufacturing in Jeffersonville, Indiana, reflects a push to shorten lead times and support local formulation cycles in North America. Europe continues to act as a premium demand center where organic compliance and residue control support higher-value extract programs. Meanwhile, fast-growing processing and distribution hubs in the Middle East and Africa, including the UAE through the Dubai Multi Commodities Centre for Tea and Coffee ecosystem, provide a base for regional extraction, blending, and re-export strategies aligned with traceability and certification needs.
Recent Industry Developments in Black Tea Extracts Market
- April 2026: Synthite Industries Ltd. highlighted continued emphasis on high-value, non-solvent-based extraction technologies in its plant-based extracts portfolio. The company focus supports cleaner-label positioning and tighter contaminant control, which aligns with beverage, supplement, and personal-care customers that specify solvent-free processing and more consistent botanical profiles.
- July 2025: MartinBauer announced investment in a new spraying tower at its Kleinostheim, Germany site to increase capacity for liquid green and black tea extracts and to cut carbon emissions by 800 tonnes annually. The project expands supply flexibility for liquid formats while reinforcing sustainability credentials that are increasingly used in premium ingredient sourcing decisions.
- May 2025: Finlays launched Finlays Solutions, an evolved extracts business designed to support beverage operators and brands with technology and consumer-insight-led development. The move strengthens application support and co-creation capabilities around tea extracts, helping customers accelerate reformulation and new product development in functional and ready-to-drink beverages.


Black Tea Extracts Market Report Scope and Research Methodology
Market Definition and Coverage
This market covers B2B sales of black tea extracts made from fully fermented Camellia sinensis leaves, supplied as concentrates, powders, or encapsulated formats for downstream manufacturing.
Scope exclusions: ready-to-drink tea beverages, bulk unprocessed tea leaves, and extracts blended with non-tea botanicals are excluded from this sizing.
Segments Covered in This Report
-
By Form
- Liquid
- Powder
- Encapsulated
-
By Type
- Hot-Water-Soluble (HWS)
- Cold-Water-Soluble (CWS)
-
By Application
- Beverages
- Functional Food
- Cosmetics and Personal Care
- Dietary Supplements
- Others
-
By Geography
-
North America
- United States
- Canada
- Mexico
- Rest of North America
-
Europe
- United Kingdom
- Germany
- Spain
- France
- Italy
- Russia
- Rest of Europe
-
Asia-Pacific
- China
- India
- Japan
- Australia
- Rest of Asia-Pacific
-
South America
- Brazil
- Argentina
- Rest of South America
-
Middle East and Africa
- Saudi Arabia
- South Africa
- Rest of Middle East and Africa
-
North America
Data Sources, Market Sizing, and Validation
Desk Research
Desk work starts by building the supply and demand context for black tea extract ingredients, since extract sales track tea leaf availability, processing economics, and downstream formulation trends. We used public sources such as FAOSTAT for tea production, UN Comtrade for trade flows of tea and related inputs, the USDA for agriculture and food market context, and the European Commission and US FDA pages for food-ingredient and labeling references. Scientific and technical anchors were also taken from peer-reviewed journals covering tea polyphenols, caffeine, and extraction yield behavior across different extract formats.
Company annual reports, investor presentations, and press releases were then used to map product positioning, capacity moves, and application focus across beverages, functional foods, supplements, and personal care. We also referenced paid subscriptions for company financials and intelligence, patent databases, and shipment-level import and export data when it helped validate pricing direction and cross-border supply patterns. The sources listed here are illustrative only, and we reviewed many other public documents and datasets for data collection, cross-checking, and clarification.
Primary Interviews and Surveys
Primary work was used to test what desk sources cannot show clearly, such as typical contract pricing behavior, the split between powder and liquid usage, and how demand changes by application. We spoke with stakeholders across ingredient manufacturing, tea processing, brand owners, and distribution, then ran follow-up checks across APAC, EMEA, and the Americas to confirm assumptions around solubility requirements, formulation dosage, and the timing of price changes.
Distribution of primary research fieldwork respondents
| Company type | Respondent position | Region |
|---|---|---|
| Top tier: 30% | CXOs: 13% | APAC: 43% |
| Mid tier: 48% | Functional/Unit leaders: 37% | EMEA: 31% |
| Smaller Players: 22% | Managers: 50% | Americas: 26% |
Market-Sizing & Forecasting
Sizing is built using top-down and bottom-up logic. The main build starts from tea leaf availability and extractable solids, then applies processing conversion ranges and filters by the share routed into extract formats sold to industrial buyers. To keep the model grounded, we corroborate totals with selective bottom-up checks, including sampled supplier revenue ranges, distributor channel checks, and a volume-times-average-selling-price build for key extract forms.
Inputs that influence the model include black tea leaf production and export trends, extraction yield and concentration norms by format (powder, liquid, encapsulated), average dosage and adoption in beverages and functional foods, and pricing movement linked to crop seasonality and freight volatility. When interview feedback showed gaps in visibility, such as smaller contract volumes that are not publicly disclosed, we used conservative ranges first, then tightened them using cross-region consistency checks.
For forecasting, scenario analysis is used so demand can be flexed with changes in tea output, ingredient inflation, and reformulation activity toward natural extracts. Growth rates are then validated through expert consensus on expected penetration gains in beverages, supplements, and personal care. The final outlook is adjusted only when drivers align with observed trade and pricing signals.
Data Validation & Update Cycle
Validation is done by comparing model outputs against independent signals, including tea production direction, trade momentum, and the implied price per kilogram ranges by extract form. Outliers are reviewed step by step, and if a region shows an unusual jump, we recheck assumptions and re-contact respondents to confirm whether the change reflects real movement or timing.
Before sign-off, the full model goes through internal analyst review so unit logic, currency conversions, and year alignment stay consistent across regions. Reports are refreshed annually, and interim updates are triggered when material events occur, such as sharp crop disruptions or sustained input cost shocks. Right before delivery, a final pass is completed so clients receive the latest updated view.
Mordor Intelligence's Black Tea Extracts Market Size Versus Other Published Estimates
Published market sizes for black tea extracts often do not match because the included product scope and valuation point in the chain are not the same across publishers. Differences also show up when one publisher uses a different base year, treats blended extracts as in-scope, or applies a different currency timing and inflation path.
The main gap comes from whether ready-to-drink tea sales or broader tea extract ingredients are counted. Mordor Intelligence only counts commercial black tea extract ingredients (concentrates, powders, and encapsulated formats) sold to downstream formulators, and it excludes RTD beverages and non-tea botanical blends. In practice, spreads also come from how average selling prices are moved forward, since some estimates keep pricing flat while others bake in stronger ingredient inflation, and from how frequently assumptions are re-validated with manufacturers and channel participants.
Benchmark comparison
| Source | Market Size | Gaps in Research Methodology |
|---|---|---|
| Mordor Intelligence | USD 8.96 B (2026) | |
| Global Consultancy A | USD 8.43 B (2024) | Uses a 2023 base year and reports a 2024 value, which shifts the comparison window, and its scope language is broader across forms and applications without clearly stating exclusions like RTD beverages or blended botanicals. |
| Industry Publisher B | USD 8.60 B (2025) | Sets 2025 as the base year and extends a longer forecast horizon, which can smooth near-term pricing swings, and it does not clearly state whether valuation is at manufacturer selling price or includes downstream processing and formulation margins. |
The comparison shows that the spread is mostly explained by scope choices and year alignment rather than a single demand assumption. By keeping inclusions tied to extract ingredients sold to industrial buyers and checking totals against production and trade signals, we end up with a market value that is easier to trace and repeat when the model is updated.


Key Questions Answered in the Report
What is the current value of the black tea extract market?
The market stands at USD 8.96 billion in 2026 and is projected to reach USD 11.13 billion by 2031.
Which region leads consumption of black tea extracts?
Europe holds the top position with 35.20% revenue share in 2025, supported by strict organic regulations and premium consumer demand.
Which application segment is growing fastest?
Dietary supplements are expanding at a 4.86% CAGR through 2031, driven by personalised nutrition and immune-health trends.
How are supply chain disruptions affecting the sector?
Red Sea route delays add 10-14 days to transit times and increase freight costs, encouraging companies to develop regional extraction and warehousing options.
Page last updated on:


 Your data is secure and never sold or shared.


