
Bioprocess Validation Market Size and Share
Market Overview
| Study Period | 2021 - 2032 |
|---|---|
| Market Size (2027) | USD 0.54 Billion |
| Market Size (2032) | USD 1.06 Billion |
| Growth Rate (2027 - 2032) | 14.38 % |
| Fastest Growing Market | Asia-Pacific |
| Largest Market | North America |
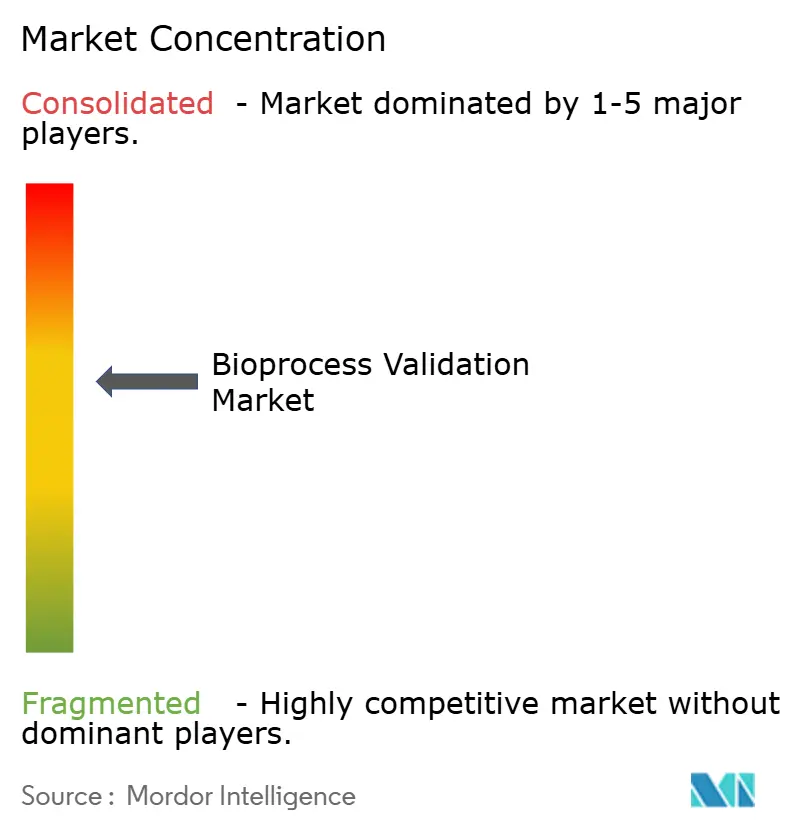
| Market Concentration | Medium |
Major Players *Disclaimer: Major Players sorted in no particular order Image © Mordor Intelligence. Reuse requires attribution under CC BY 4.0. | |
Bioprocess Validation Market Analysis by Mordor Intelligence
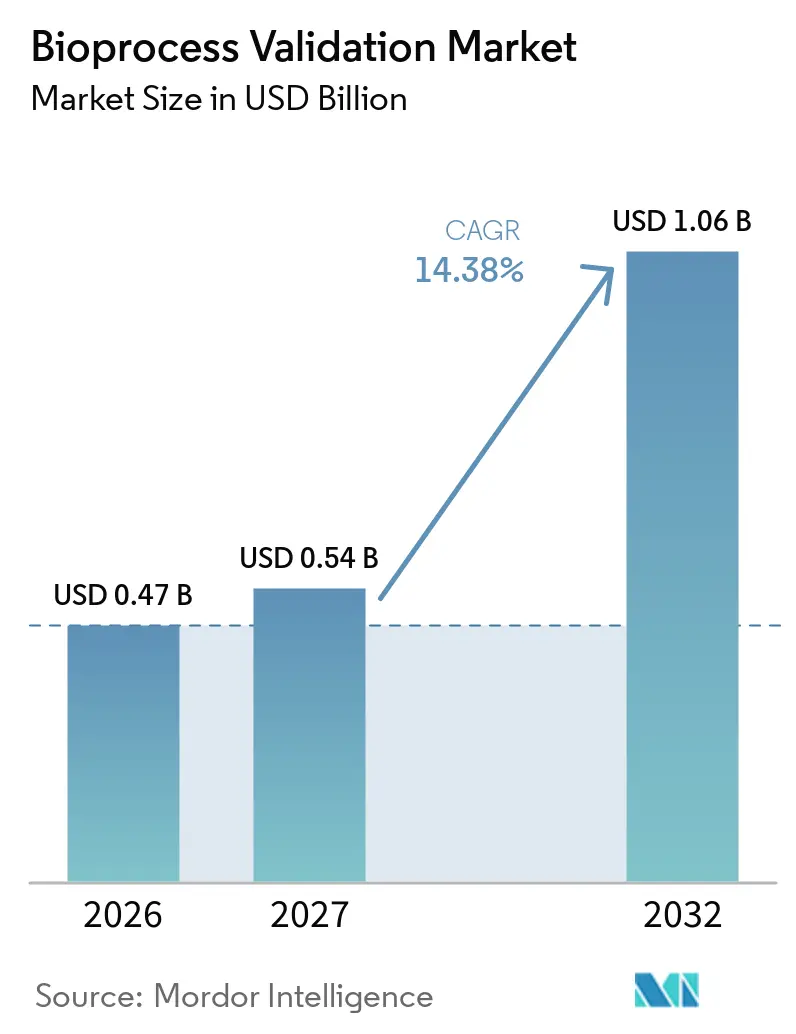
The Bioprocess Validation Market size is projected to expand from USD 0.47 billion in 2026 and USD 0.54 billion in 2027 to USD 1.06 billion by 2032, registering a CAGR of 14.38% between 2027 and 2032.
Growth is anchored in three inter-locking forces: stricter global regulatory guidance, greater volumes of commercial and clinical biologics, and the steady migration of validation work to contract development and manufacturing organizations (CDMOs). Demand has broadened as biologics account for around 50% of all drug candidates, which magnifies the number of facilities, processes, and analytical procedures that must be formally qualified. The United States Food and Drug Administration (FDA) and the European Medicines Agency (EMA) updated viral safety, analytical procedure, and contamination-control expectations in 2024, creating new compliance milestones that most producers must meet before batch release[1]. Digital validation frameworks—built around electronic batch records, data-integrity checkpoints, and audit-ready data trails—are now a major differentiator because they shorten inspection cycles and reduce the risk of compliance findings[2].
Key Report Takeaways
- By test type, extractables testing led with 38.07% of bioprocess validation market share in 2026, while integrity testing is forecast to expand at a 15.92% CAGR through 2032.
- By process component, filter elements accounted for 26.12% share of the bioprocess validation market size in 2026; bioreactors are projected to grow at a 13.98% CAGR between 2027-2032.
- By end user, pharmaceutical and biotechnology companies held 56.82% of the bioprocess validation market share in 2026, whereas CDMOs are advancing at a 16.88% CAGR through 2032.
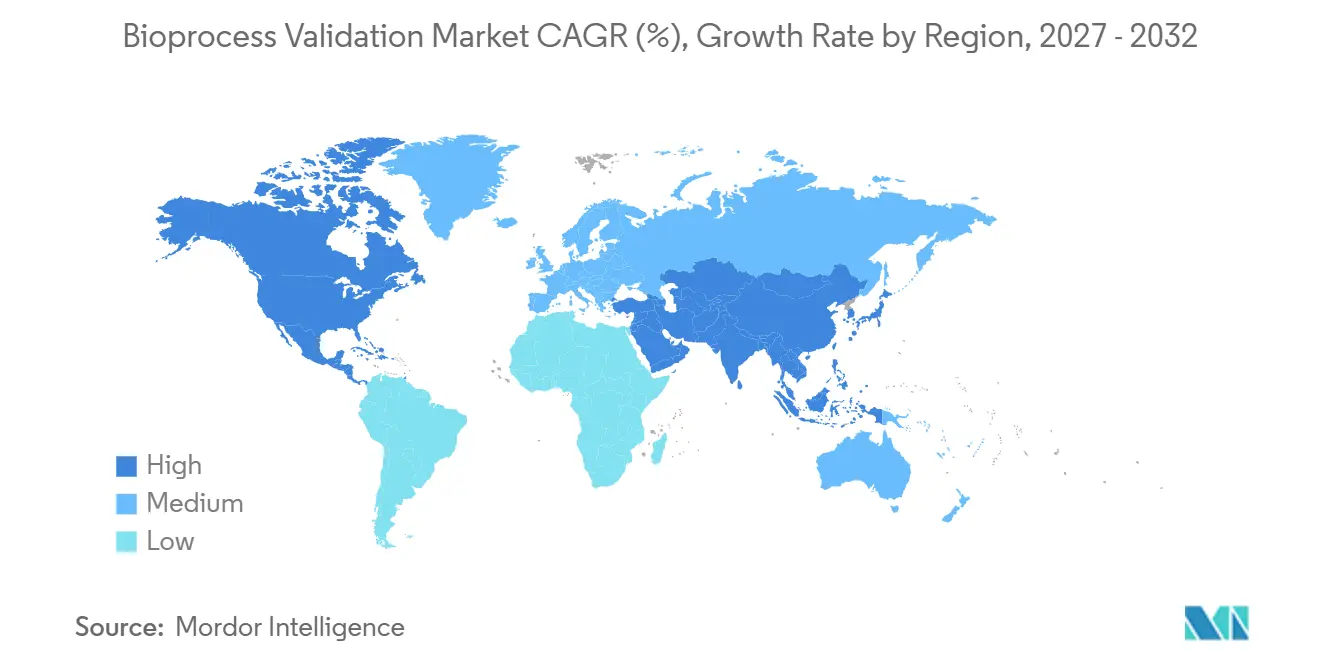
- By geography, North America captured 48.12% of the bioprocess validation market size in 2026; Asia-Pacific is the fastest-growing region at a 15.31% CAGR to 2032.
Note: Market numbers in this report are based on Mordor Intelligence's proprietary estimation framework, which combines nine months of actuals with Q4 projections for base year 2026.
Market Trends and Insights
Drivers Impact Analysis of Bioprocess Validation Market*
| Driver | (~) % Impact on CAGR Forecast | Geographic Relevance | Impact Timeline |
|---|---|---|---|
| Expanding global biopharmaceutical production volume | +3.2% | Global, concentrated in North America & EU | Medium term (2-4 years) |
| Stringent regulatory compliance requirements | +2.8% | Global, led by North America, EU, and Asia-Pacific | Short term (≤2 years) |
| Rising outsourcing of validation services to CDMOs | +2.1% | Global, with Asia-Pacific showing the highest growth | Medium term (2-4 years) |
| Adoption of advanced process analytical technology tools | +1.9% | North America & EU core, spill-over to Asia-Pacific | Long term (≥4 years) |
| Transition toward integrated continuous manufacturing lines | +1.6% | North America & EU early adopters, gaining traction in APAC | Long term (≥4 years) |
| Emergence of data-driven lifecycle validation frameworks | +1.3% | Global, strongest uptake in North America & EU | Medium term (2-4 years) |
| Source: Mordor Intelligence | |||
Expanding Global Biopharmaceutical Production Volume
Manufacturing scale-up fuels the bioprocess validation market as every new line, facility, and process change must be re-qualified. Lonza’s USD 1.2 billion purchase of Roche’s Vacaville plant in October 2024, which adds 330,000 L of bioreactor capacity, typifies large-scale expansions that generate multi-year validation programs. Continuous-manufacturing lines further elevate complexity because sensors, process-analytical-technology (PAT) modules, and real-time release strategies all need bespoke validation. Capacity utilization hovering near 85% in mature hubs tightens project timelines and nudges manufacturers to transfer part of the workload to specialty validation providers, especially for high-throughput extractables and microbiological studies.
Stringent Regulatory Compliance Requirements
The FDA’s Q5A(R2) viral-safety guide and Q2(R2) analytical-procedure guide set deeper expectations for viral-clearance validation and method robustness. In parallel, EMA’s revised Annex 1 compels continuous environmental monitoring in Grade A cleanrooms, adding routine pre-use and post-use filter-integrity tests. Data-integrity rules based on the ALCOA+ framework mean firms must deliver tamper-evident audit trails, pushing electronic batch records from nice-to-have to prerequisite. Harmonized guidelines reduce regional ambiguity yet accelerate compliance deadlines, prompting companies to front-load validation resources or risk marketing-authorization delays.
Rising Outsourcing of Validation Services to CDMOs
Roughly 72.6% of biomanufacturers now outsource some or all validation activities, citing cost control and access to specialized know-how. Eurofins Scientific reported EUR 3.419 billion BioPharma revenue in H1 2024, underpinned by validation demand that it absorbs across a global lab network. CDMOs bundle extractables, leachables, microbiological, and physical testing into turnkey packages, often priced below in-house alternatives once capital depreciation is considered. Cross-border footprints allow CDMOs to shift analytical workloads to lower-cost labs while maintaining quality-system parity, giving clients a double benefit of speed and price.
Adoption of Advanced Process Analytical Technology Tools
PAT instruments add continuous data feeds that compress the time between sampling and corrective action. Near-infrared, mid-infrared, and Raman spectroscopies deliver real-time concentration profiles that once took hours of off-line assays. Digital twins replicate process kinetics in silico, letting validation teams test control limits without touching hardware and thereby cutting re-qualification cycles. Machine-learning models now parse these data streams for deviation signatures, flagging potential losses before product attributes drift. Regulators view such tools favorably, seeing them as enablers of real-time release testing and reduced batch-record review.
Restraints Impact Analysis of Bioprocess Validation Market*
| Restraints Impact Analysis | (~) % Impact on CAGR Forecast | Geographic Relevance | Impact Timeline |
|---|---|---|---|
| High capital and operational costs of validation testing | -1.8% | Global, with higher impact in emerging markets | Short term (≤2 years) |
| Limited availability of skilled validation workforce | -1.4% | Global, particularly acute in North America & EU | Medium term (2-4 years) |
| Complexity of extractables and leachables assessments | -1.2% | Global, most challenging for single-use heavy facilities | Medium term (2-4 years) |
| Data integrity and cybersecurity challenges in digital validation | -1.0% | Global, heightened in highly digitized plants | Long term (≥4 years) |
| Source: Mordor Intelligence | |||
High Capital and Operational Costs of Validation Testing
Specialized equipment, controlled environments, and data-integrity platforms drive validation costs far above typical quality-control budgets. End-to-end extractables and leachables studies for a single biologic can top USD 500,000 when exhaustive analytical panels are required. Smaller biotechnology firms often lack the capital for dedicated validation suites, pushing them toward outsourcing, but even CDMO prices climb as materials, reference standards, and analytical talent become scarce. The cost burden is heavier in emerging economies where capital allocations must also cover basic facility upgrades to meet global Good Manufacturing Practice (GMP) expectations.
Limited Availability of Skilled Validation Workforce
About 38.5% of companies report difficulty hiring upstream process-development staff, while 37.2% struggle with downstream validation roles. Roles demand fluency in regulatory affairs, analytics, automation, and data security—a blend that traditional academic curricula rarely deliver. Salary premiums in mature hubs lure talent away from smaller centers, widening regional gaps. The move toward Industry 4.0 intensifies the crunch because validation engineers now need coding, statistical-modeling, and cybersecurity fundamentals on top of microbiology and chemistry.
*Our forecasts treat driver/restraint impacts as directional, not additive. The impact forecasts reflect baseline growth, mix effects, and variable interactions.
Bioprocess Validation Market Segment Analysis
By Test Type:
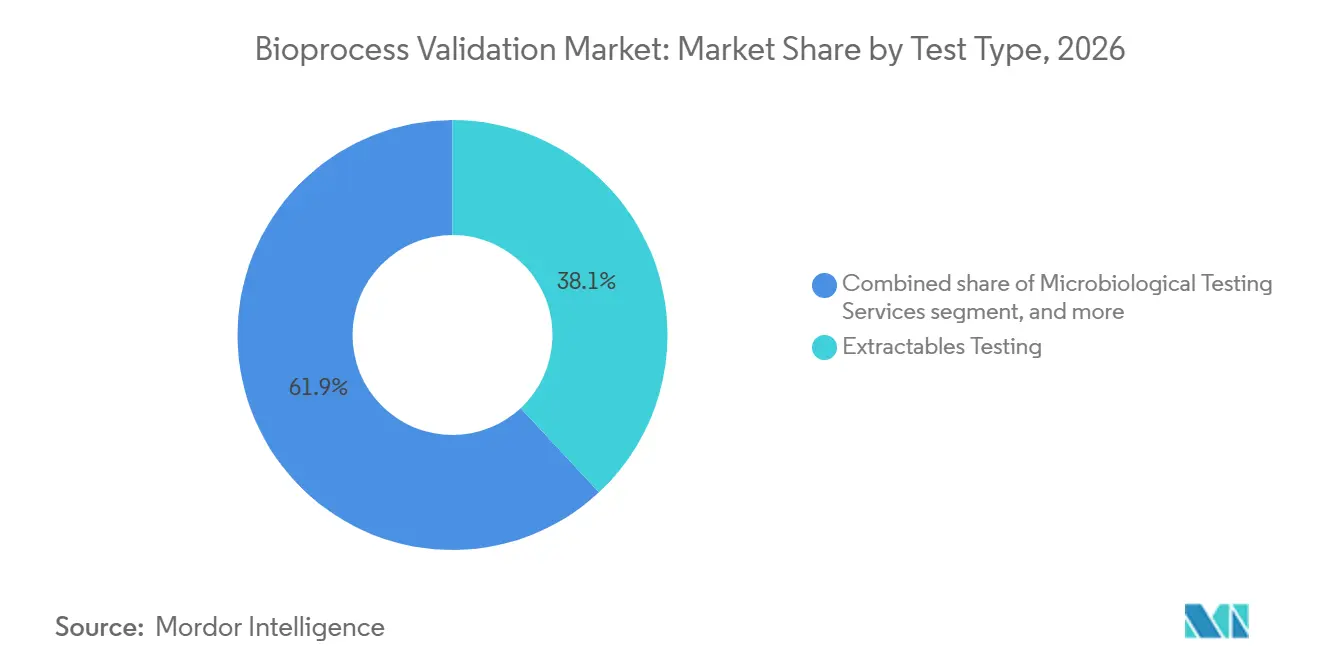
Extractables Testing Dominates Complex Validation LandscapeExtractables testing captured 38.07% of the bioprocess validation market in 2026, underlining the acute focus on material-derived impurities that could jeopardize drug safety. Regulatory expectations for single-use systems require full chemical profiling, with the FDA’s April 2024 draft on ANDA submissions laying out tightly scripted protocols. Suppliers and manufacturers jointly map polymer compositions, solvents, and potential leachables, then translate these findings into risk assessments before commercial batches can run. Integrity testing services, positioned to grow at a 15.92% CAGR through 2032, benefit from EMA mandates for pre-use/post-sterilization assessments. The shift toward closed processing gives integrity testing extra weight, because even a minute filter compromise invites contamination.
Accelerating demand for rapid methods reshapes microbiological and physicochemical testing. Platforms such as the BACT/ALERT 3D system cut sterility timelines to six days, freeing warehouse space and cash that would otherwise sit in quarantine. Physicochemical assays remain essential for routine release, but automation upgrades deliver higher throughput with fewer analysts, mitigating the labor pinch. Compatibility studies for novel excipients, combination devices, and high-concentration formulations add fresh revenue pockets. Non-growth-based sterility testing—such as SCANRDI, which gives results in under four hours—emerges as a differentiator for producers chasing rapid release in competitive therapeutic classes.

By Process Component:
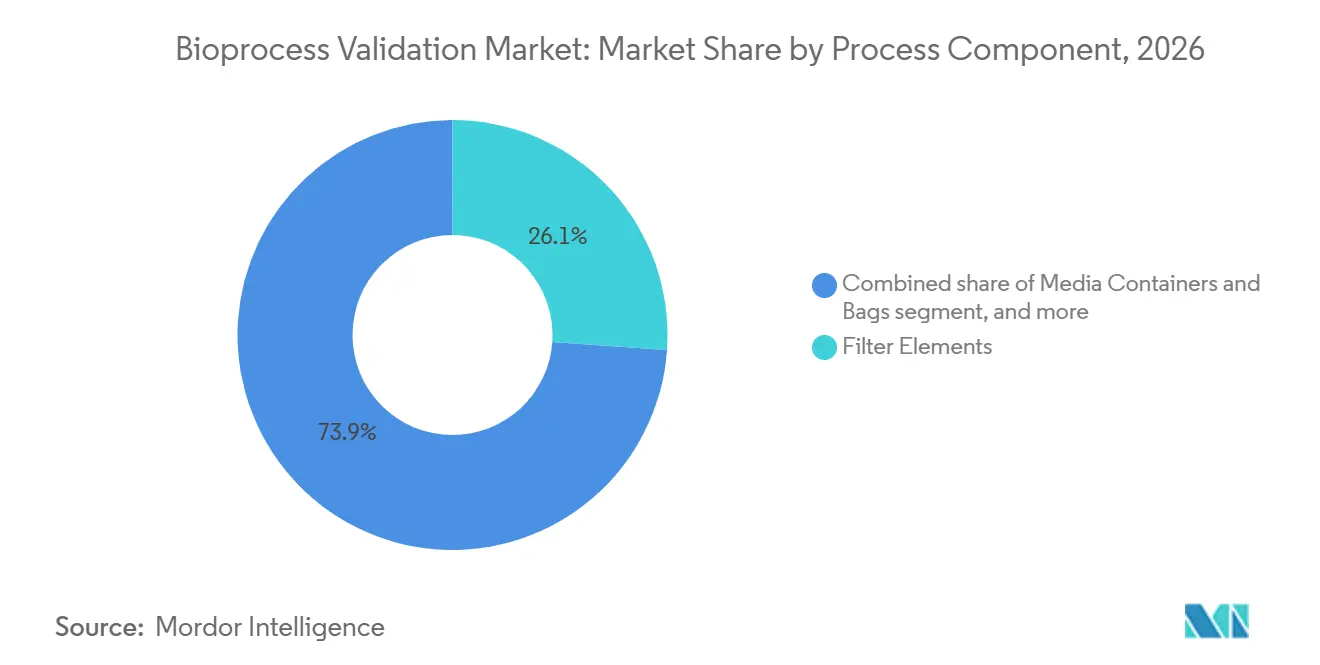
Filter Elements Lead Amid Bioreactor InnovationFilter elements controlled 26.12% of the bioprocess validation market size in 2026 and remain central to any contamination-control strategy. Regulators demand documented proof of retention, pressure endurance, and integrity across the life cycle of each filter, whether stainless steel or single-use. Annex 1 adds compulsory point-of-use integrity checks, swelling demand for high-accuracy test rigs and trained operators. Viral-clearance claims further multiply analytical runs because filters must prove log-reduction values under worst-case loads and flow rates.
Bioreactors, slated for a 13.98% CAGR, echo the broader movement toward intensified and continuous processing. Perfusion, single-use reactors, and automated feeding loops require validation plans that blend classical parameters (agitation, temperature, pH) with software validations for control logic. Lonza’s Vacaville purchase showcases how legacy stainless infrastructure and next-gen single-use modules coexist in mega-plants, each with unique validation dossiers. Media containers, bags, and mixing systems maintain steady mid-single-digit growth because closed processing pushes fluid handling into disposable formats that still demand chemical compatibility and extractables proof. Transfer systems ride a similar curve, propelled by multi-suite facilities that prefer modular skids and sterile connectors over hard-piped loops.
By End User:
CDMOs Drive Outsourcing TransformationPharmaceutical and biotechnology firms supplied 56.82% of overall revenue in 2026 as they financed lot-specific tests, method transfers, and facility re-qualifications tied to pipeline progression. Internal quality groups still run core studies, but they increasingly ration their bandwidth to products in late-stage or commercial phases. CDMOs, posting a 16.88% CAGR through 2032, win the rest through bundled validation packages that span extractables, microbiology, viral clearance, and data-migration services. Eurofins’ multiyear track record—closing H1 2024 at EUR 3.419 billion BioPharma revenue—confirms the model’s global pull.
CDMOs also convert scale economies into favorable pricing, absorbing peak workloads during facility upgrades or expedited regulatory filings. Charles River Laboratories faced near-term revenue pressure in 2025 yet preserved its biotherapeutic-testing pipeline by reallocating resources to higher-margin cell and gene therapy programs. Academic centers, non-profit institutes, and government labs hold modest shares but remain critical for early-stage methods and regulatory science. Virtual biotech start-ups, often outsourcing 100% of CMC tasks, represent a consistent inflow of project-based validation business for CDMOs equipped with flexible capacity.
Geography Analysis
North America Bioprocess Validation Market
North America retained 48.12% of the bioprocess validation market in 2026, powered by the FDA’s leadership on global GMP norms and a dense cluster of commercial biologics producers. U.S. laboratories pioneer rapid-microbiology innovations, such as real-time viable-particle counters used in environmental monitoring, which translate into additional validation work for early adopters. SGS, for instance, achieved a zero-483 outcome in a 2024 FDA audit of its North American biologics center, underscoring the region’s high compliance bar. Canada expands through biologics corridor incentives in Québec and Ontario, whereas Mexico attracts fill-finish projects that channel validation fees into local service providers.
APAC Bioprocess Validation Market
Asia-Pacific is set to outpace all regions at a 15.31% CAGR during 2027-2032. China’s five-year biotech roadmap funds capacity additions alongside domestic regulatory upgrades that increasingly mirror ICH standards. Surveys show 90% of Chinese plant managers aim for full global GMP alignment within ten years. India pushes forward through policy reforms that simplify import permits for reference standards and encourage third-party validation labs. Singapore partners with Charles River Laboratories to offer master cell-banking services that require CGMP-level validation, signalling a regional move toward advanced therapy production.
EMEA and South America Bioprocess Validation Market
Europe commands mature demand shaped by the EMA’s Annex 1 and the continent’s strong biosimilar pipeline. Germany anchors the region with clusters in Bavaria and North Rhine-Westphalia running high-capacity stainless and single-use suites. France and Spain add modular facilities built for flexible campaigns, each calling for concurrent validation plans. Brexit generates dual-submission obligations for products sold in both the EU and United Kingdom, effectively doubling some validation documentation. The Middle East & Africa and South America lag in absolute size but gain from rising generic and biosimilar ambitions, notably in Brazil where ANVISA fortifies GMP inspections that elevate local demand for accredited validation labs.
Regulatory Landscape
Bioprocess validation continues to rely on GMP and ICH quality guidance, with regulators emphasizing lifecycle validation, data integrity, and risk-based control across upstream and downstream operations. In the U.S., the FDA sets expectations through its process validation and biologics guidances, while the EMA’s process-validation guidance for biotechnology-derived active substances and finished products shapes how submissions are prepared.
EMA communications also point to tighter change control and more complete validation lifecycle documentation, including the December 2025 EMA Q&A for biological medicinal products and the January 2026 concept paper to revise EudraLex Volume 4, Annex 15. Health Canada monitors ICH implementation status to keep validation packages aligned across major regions.
Competitive Landscape
The bioprocess validation market shows moderate fragmentation. Merck KGaA, SGS, Eurofins Scientific, and Thermo Fisher Scientific field global networks that handle volume spikes and specialized assays. Thermo Fisher’s USD 4.1 billion purchase of Solventum’s purification and filtration arm in February 2025 deepens its downstream and validation bench strength, with management projecting USD 1 billion in incremental revenue from the deal. Danaher merged Cytiva and Pall into a USD 7.5 billion bioprocess unit that bundles filtration, chromatography, and single-use hardware, presenting customers with an integrated validation roadmap.
Technology leadership matters more each year. Firms investing in automated sample prep, cloud-native data lakes, and AI-driven trend analytics trim lot release time, making them preferred partners for speed-sensitive launches. Providers wielding six-day sterility tests capture share over labs that still rely on 14-day compendial methods. Smaller regional specialists carve profitable niches in extractables for novel polymers, cell and gene therapy assays, and digital-validation consulting. Market consolidation will likely continue as full-service players pick up niche labs to round out portfolios and secure local regulatory relationships.
Geographical white spaces persist, chiefly in fast-growing Asia-Pacific markets where validation capacity remains below projected manufacturing output. International firms use joint ventures and strategic site openings to close those gaps and lock in early customers. Competition also centers on workforce development; multinationals with in-house academies for validation science stand apart in hiring and retention, enabling them to sustain throughput even as project loads climb.
Bioprocess Validation Industry Leaders
-
Merck KGaA
-
Eurofins Scientific
-
SGS S.A.
-
Sartorius AG
-
Pall Corporation
- *Disclaimer: Major Players sorted in no particular order
Bioprocess Validation Market Companies Covered in this Report
- Merck
- SGS
- Eurofins
- Sartorius
- Pall
- Thermo Fisher Scientific
- Lonza Group
- Charles River
- Catalent
- Cytiva
- Intertek Group
- Element (VR Analytical)
- Aizon
- ValGenesis
- Cobetter Filtration Equipments
- DOC
- Meissner Filtration Products
- Almac Group
- LabCorp
- Cytiva Fast-Trak Services
- US Validation
Market Opportunities and Future Outlook
Single-use system compliance is increasing demand for extractables and leachables validation packages, supplier qualification, and additional testing capacity that can scale with component variety. USP General Chapter 665 became mandatory on May 1, 2026, creating a standardized extractables-testing baseline for many U.S.-linked quality systems, and USP’s July 17, 2026 revision notice expands the scope of 1663 and 1664 to all single-use bioprocessing system components.
As a result, the addressable validation workload widens, with more emphasis on harmonized material characterization, structured risk assessments, and traceable evidence that connects component selection to product and process risk.
Recent Industry Developments in Bioprocess Validation Market
- July 2026: MilliporeSigma (Merck KGaA) opened a new EUR 25 million BioReliance testing facility in Darmstadt, Germany, for commercial drug substance and drug product release testing and GMP-compliant stability studies for biopharmaceuticals. The expanded European footprint reduces sample logistics time and supports faster batch disposition for manufacturers working under EU release and stability requirements.
- February 2025: Thermo Fisher Scientific finalized the acquisition of Solventum's purification and filtration business for USD 4.1 billion. The deal strengthens Thermo Fisher's downstream portfolio and expands its ability to pair filtration hardware with qualification and validation support across bioproduction workflows.
- October 2024: SGS expanded its biopharmaceutical testing center in Lincolnshire, Illinois, adding capacity for early cell bank safety assessment, product characterization, and method validation. The site expansion increases near-site testing throughput for biologics developers and supports higher validation volumes tied to new processes and facility upgrades.
Bioprocess Validation Market Report Scope and Research Methodology
Market Definition and Coverage
For this report, the bioprocess validation market is defined as the revenue generated from activities and services that qualify, test, and document bioprocessing steps to meet quality and regulatory expectations across biopharma manufacturing.
Scope exclusions: We exclude pilot-scale academic research validation work and software-only quality tools that do not involve validation testing or qualification services.
Segments Covered in This Report
- By Test Type
- Extractables Testing Services
- Microbiological Testing Services
- Physicochemical Testing Services
- Integrity Testing Services
- Compatibility Testing Services
- Other Testing Services
- By Process Component
- Filter Elements
- Media Containers & Bags
- Freezing & Thawing Process Bags
- Mixing Systems
- Bioreactors
- Transfer Systems
- Other Process Components
- By End User
- Pharmaceutical & Biotechnology Companies
- Contract Development & Manufacturing Organizations
- Other End Users
- Geography
- North America
- United States
- Canada
- Mexico
- Europe
- Germany
- United Kingdom
- France
- Italy
- Spain
- Rest of Europe
- Asia-Pacific
- China
- Japan
- India
- Australia
- South Korea
- Rest of Asia-Pacific
- Middle East & Africa
- GCC
- South Africa
- Rest of Middle East & Africa
- South America
- Brazil
- Argentina
- Rest of South America
- North America
Data Sources, Market Sizing, and Validation
Desk Research
Desk research is used to build the first structure of the model and set boundaries on what revenue should be counted as bioprocess validation. We review public regulatory and quality guidance that drives validation demand, along with biomanufacturing activity indicators that indirectly set the testing and qualification workload.
Public sources we typically rely on include guidance and databases from bodies such as the US FDA, EMA, and WHO, plus GMP related references and standards from organizations such as ISO. We also use manufacturing and trade context from sources such as the US International Trade Commission, UN Comtrade, and national statistics offices where biopharma production indicators are available. To keep the revenue model grounded, we cross-check company filings, annual reports, investor presentations, and trusted industry news coverage, and we selectively use paid databases for company financials, news and financials screening, patent databases, and import-export shipment-level signals when they help validate activity levels. The sources listed here are illustrative only, and many other public and paid references are used to collect, validate, and clarify data points throughout the study.
Primary Interviews and Surveys
Primary work is used to pressure-test our assumptions on what is being bought, how contracts are priced, and where validation demand is shifting across modalities and facilities. We interview a mix of service providers, biomanufacturers, CDMOs, and quality and validation specialists across major regions so gaps left by public data can be filled. After that, we recheck the key assumptions before finalizing the market totals.
Distribution of primary research fieldwork respondents
| Company type | Respondent position | Region |
|---|---|---|
| Top tier: 26% | CXOs: 19% | APAC: 41% |
| Mid tier: 55% | Functional/Unit leaders: 21% | EMEA: 36% |
| Smaller Players: 19% | Managers: 60% | Americas: 23% |
Market-Sizing & Forecasting
Sizing starts with a top-down build where biomanufacturing activity and compliance needs are translated into a demand pool for validation testing and qualification work, and then converted into revenue using typical pricing ranges observed in the field. We then corroborate the totals using selective bottom-up approximations, such as rolling up sampled service revenue disclosures, applying average pricing to estimated test volumes, and using channel checks with labs and CDMOs to adjust the totals where gaps show up.
Key inputs that shape the model include trends in biologics and biosimilars production runs, facility additions and expansions, the frequency of changeovers and revalidation events, demand for microbiological testing and viral clearance work, and the mix shift toward single-use systems which changes extractables and leachables testing intensity. Currency conversion is handled consistently by using the same reference period rates for the market year so regional totals stay comparable. For forecasting, we use scenario analysis supported by expert views on capacity additions, regulatory scrutiny, and outsourcing intensity, and then we convert those scenarios into a single base case after checking that the implied testing workloads remain realistic for the installed manufacturing footprint. Where bottom-up information is thin for smaller regions or niche test categories, we apply conservative penetration assumptions and validate them through follow-up calls before locking the series.
Data Validation & Update Cycle
Validation is done by cross-checking modeled revenue against independent signals, such as biopharma manufacturing expansion announcements, outsourcing intensity reported by CDMOs, and the pace of regulatory observations linked to quality systems. When outputs look inconsistent, we reopen the drivers and check for unit mistakes, double counting across test types, or incorrect timing of facility ramp-ups, and then recalibrate the affected assumptions.
Before sign-off, the work goes through multi-step analyst reviews where the logic is challenged and the key parameters are compared across regions for reasonableness. Reports are refreshed annually, and interim updates are made when material events can shift demand or pricing, such as major regulatory changes or visible capacity swings. Right before delivery, we run a final update pass so the client receives the most current view supported by the latest available signals.
Mordor Intelligence's Biprocess Validation Market Size Versus Other Published Estimates
Published market sizes for bioprocess validation can look far apart because the market boundary is easy to stretch, and because different teams rely on different price and volume anchors. The split usually comes from what is counted as validation work, the year used as the starting point, and how quickly price and outsourcing assumptions are allowed to move.
The table shows a noticeable spread, and in Mordor Intelligence's model the total is tied to validation testing and qualification revenue linked to regulated bioprocess steps (including microbiological testing and viral clearance), while adjacent software-only quality tools and non-manufacturing research validation work are not counted. Differences also come from whether estimates assume a high share of outsourced testing at premium pricing, or whether they use more blended in-house rates, and these choices can shift totals even when the same end users are discussed.
Benchmark comparison
| Source | Market Size | Gaps in Research Methodology |
|---|---|---|
| Mordor Intelligence | USD 472.04 M (2026) | |
| Industry Data Provider A | USD 537.67 M (2025) | Uses a different base year and appears to apply a broader service bundle that can fold in quality support activities beyond validation testing, which lifts the near-term number and changes the growth path. |
| Press Release Summary B | USD 416.50 M (2024) | Relies on a press-level figure that can be based on a narrower set of test types and a more conservative outsourcing and pricing mix, and the lower starting year also reduces the headline market value. |
Taken together, the comparison suggests that scope boundaries and base-year choice do most of the work in explaining the gap, followed by how pricing and outsourcing assumptions are set. We keep the steps traceable by linking revenue to observable manufacturing activity and validation workloads, and then rechecking the outputs with field feedback before finalizing the base case.
Key Questions Answered in the Report
What is the current value of the bioprocess validation market?
The market is valued at USD 0.54 billion in 2027 and is forecast to grow to USD 1.06 billion by 2032.
Which test type holds the largest share?
Extractables testing dominates with 38.07% of 2026 revenue, driven by single-use system adoption and regulatory focus on patient safety.
Why are CDMOs growing faster than other end users?
Pharmaceutical companies outsource validation to CDMOs for cost savings and specialized expertise, giving CDMOs a 16.88% projected CAGR through 2032.
Which region is expanding the fastest?
Asia-Pacific leads with a 15.31% CAGR thanks to capacity additions in China and India and closer alignment with global GMP standards.
How are new regulations affecting validation workloads?
Updated FDA and EMA guidance adds more stringent viral safety, analytical method, and contamination-control requirements, increasing the volume and complexity of validation studies.
What technologies are transforming validation practices?
Process analytical technology tools such as real-time spectroscopy, digital twins, and machine-learning models enable continuous monitoring and shorten release timelines.