
Biotechnology Instruments Market Size and Share
Market Overview
| Study Period | 2020 - 2031 |
|---|---|
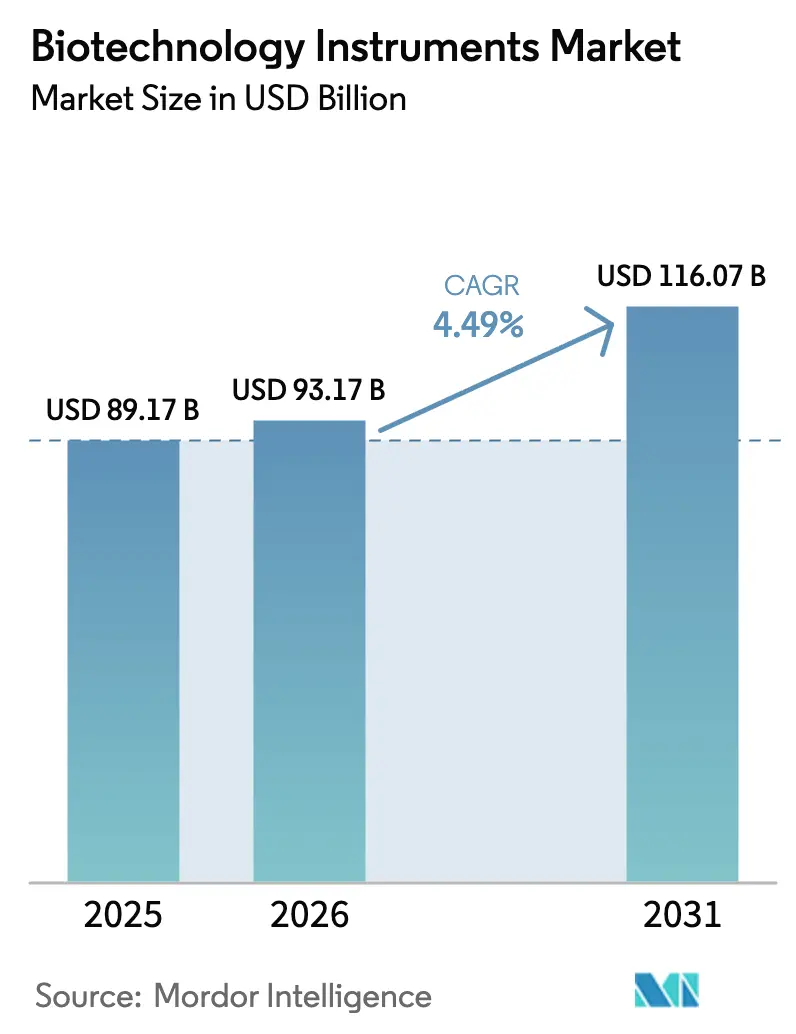
| Market Size (2026) | USD 93.17 Billion |
| Market Size (2031) | USD 116.07 Billion |
| Growth Rate (2026 - 2031) | 4.49 % |
| Fastest Growing Market | Asia-Pacific |
| Largest Market | North America |
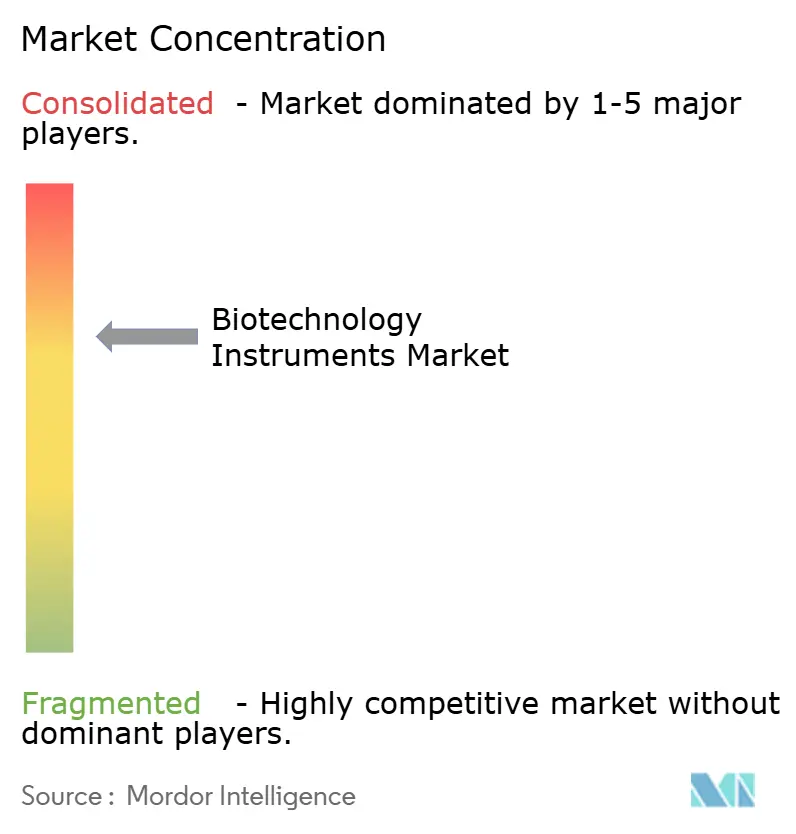
| Market Concentration | Medium |
Major Players *Disclaimer: Major Players sorted in no particular order Image © Mordor Intelligence. Reuse requires attribution under CC BY 4.0. | |
Biotechnology Instruments Market Analysis by Mordor Intelligence
The biotechnology instruments market size is expected to grow from USD 89.17 billion in 2025 to USD 93.17 billion in 2026 and is forecast to reach USD 116.07 billion by 2031 at 4.49% CAGR over 2026-2031. This steady headline figure conceals rapid changes below the surface: laboratory managers now prioritize fully automated, AI-enabled workflows that shorten discovery cycles, guard against human error, and stretch limited technical staff. Growth concentrates in high-throughput applications such as synthetic biology, personalized cell therapy, and point-of-care molecular diagnostics, each of which demands compact instruments that integrate hardware, software, and data analytics. Long procurement lead times caused by component shortages encourage buyers to favor vendors able to guarantee supply continuity through multi-sourced parts and predictive maintenance services. In parallel, strict energy-efficiency regulations in Europe and parts of Asia reward instrument designs with lower standby power and recyclable plastics, giving manufacturers a new path to differentiation.
Key Report Takeaways
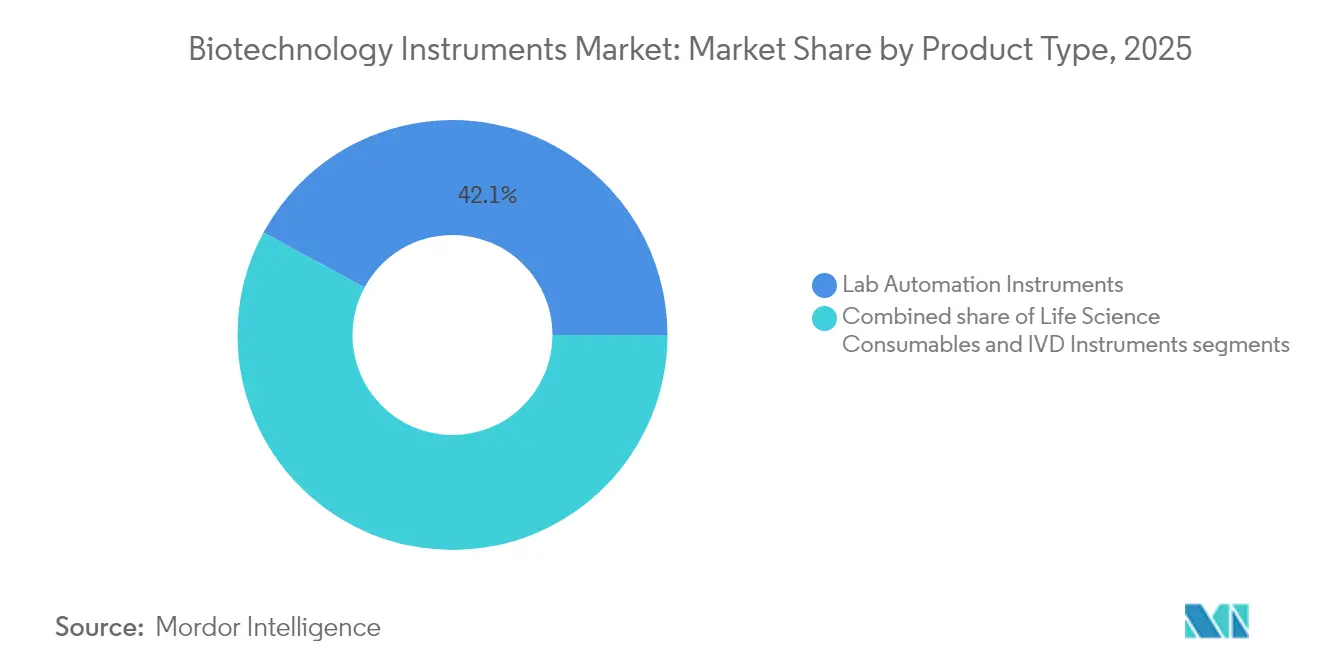
- By product type, lab automation platforms held 42.10% of the biotechnology instruments market share in 2025, while life science consumables are advancing at a 5.77% CAGR through 2031.
- By distribution channel, offline sales accounted for 80.62% of the biotechnology instruments market size in 2025, whereas online platforms are expanding at a 6.64% CAGR to 2031.
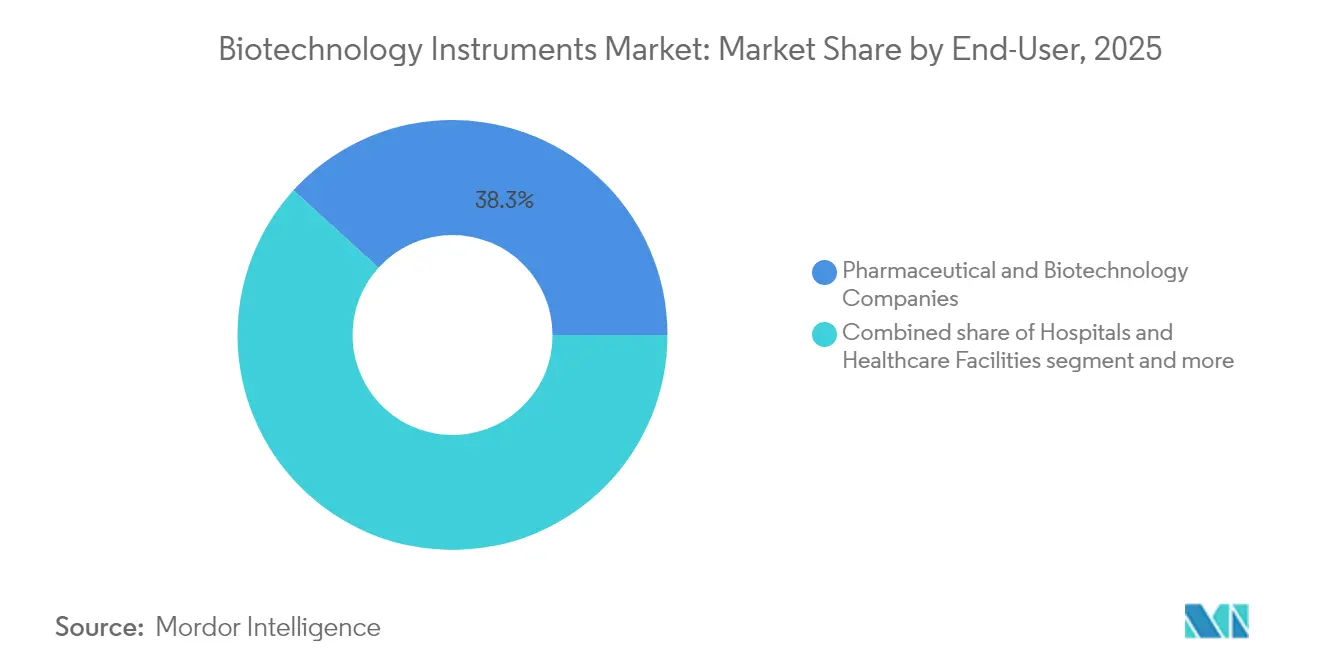
- By end-user, pharmaceutical and biotechnology companies led with a 38.25% share of the biotechnology instruments market in 2025; contract research and manufacturing organizations recorded the fastest 5.36% CAGR.
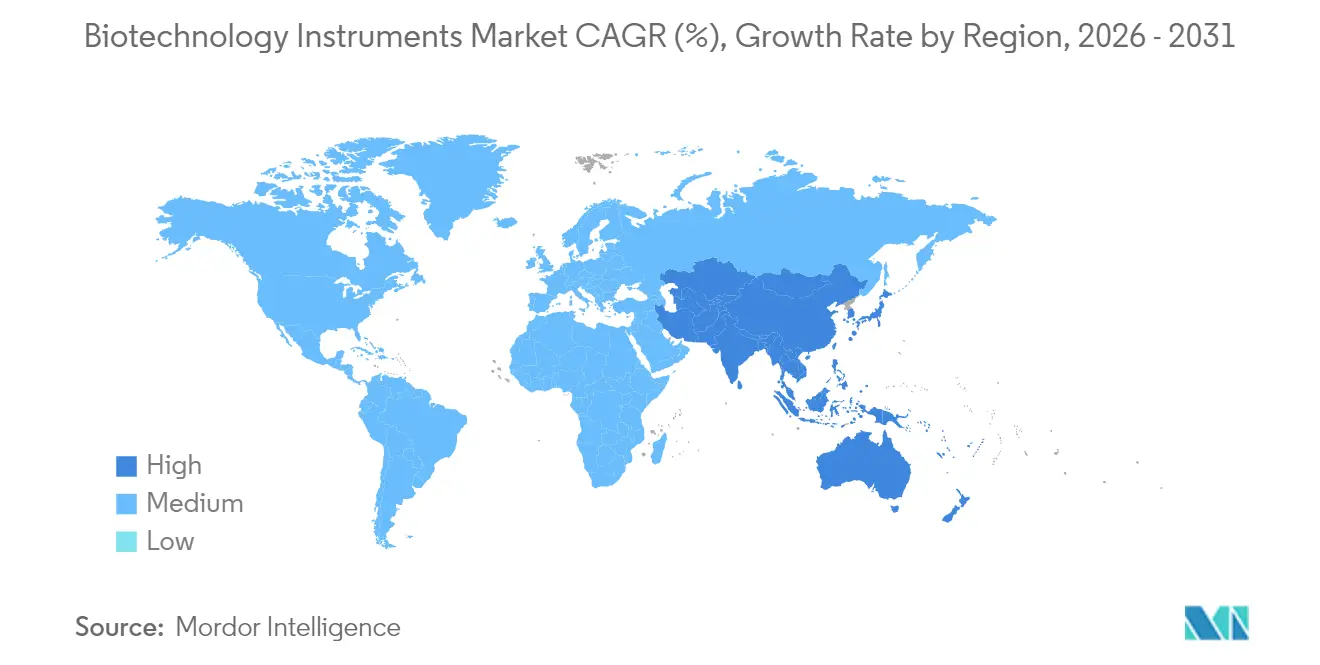
- By geography, North America commanded 40.85% share in 2025, yet Asia-Pacific exhibits the swiftest 6.05% CAGR through 2031.
Note: Market size and forecast figures in this report are generated using Mordor Intelligence’s proprietary estimation framework, updated with the latest available data and insights as of 2026.
Market Trends and Insights
Drivers Impact Analysis of Biotechnology Instruments Market*
| Driver | (~) % Impact on CAGR Forecast | Geographic Relevance | Impact Timeline |
|---|---|---|---|
| Surge in large-scale biologics & cell-therapy manufacturing | +0.9% | Global, concentrated in US, Germany, Singapore | Medium term (2-4 years) |
| Growth in point-of-care molecular tests | +0.8% | Global, with early gains in North America & EU | Medium term (2-4 years) |
| Expansion of high-throughput screening in drug discovery | +0.7% | North America & EU core, spill-over to APAC | Long term (≥ 4 years) |
| AI-driven predictive maintenance cuts instrument downtime | +0.5% | APAC core, spill-over to North America | Short term (≤ 2 years) |
| Synthetic DNA foundries demanding next-gen automation | +0.4% | North America & EU | Long term (≥ 4 years) |
| Government decarbonization rules favor low-energy lab devices | +0.3% | EU core, spill-over to North America & APAC | Long term (≥ 4 years) |
| Source: Mordor Intelligence | |||
Surge in Large-Scale Biologics & Cell-Therapy Manufacturing
Manufacturers scaling monoclonal antibodies and autologous cell therapies require closed, modular automation that controls sterility, traceability, and batch variability. Platforms such as the CliniMACS Prodigy integrate washing, selection, activation, and formulation in a single enclosed device that meets GMP guidelines while trimming clean-room footprint. This preference for plug-and-play systems pushes suppliers to bundle hardware, single-use consumables, and process software under one contract, raising switching costs and deepening vendor relationships.
Growth in Point-of-Care Molecular Tests
Hospitals that installed rapid PCR analyzers during the pandemic now extend them to antimicrobial resistance, oncology, and transplant monitoring. Sample-to-answer cartridges collapse extraction, amplification, and detection into a handheld format; premium price tags are justified by shorter waiting times and reduced inpatient stays. Emergency Use Authorization pathways set during COVID-19 have also shortened approval cycles for future bedside assays, accelerating volume commitments for compact thermal cyclers and integrated optics.
Expansion of High-Throughput Screening in Drug Discovery
Screening laboratories migrate from microplate readers to acoustic liquid handlers coupled with real-time AI analytics. SCIEX’s Echo MS+[1] streams one sample each second and feeds spectral data into machine-learning models that rank hits in hours rather than weeks. This shift compresses discovery timelines and expands demand for integrated decks combining storage, pipetting, incubation, and analytics, thereby locking in long-term reagent and service revenues.
AI-Driven Predictive Maintenance Cutting Instrument Downtime
Predictive algorithms embedded in cloud-connected centrifuges and chromatography systems analyze motor current, vibration, and temperature signals to detect drift days before failure. Thermo Fisher instruments equipped with these features have reported 20% shorter lead times and 30% higher capacity utilization, reinforcing the notion that service ecosystems now influence procurement as strongly as hardware specifications.
Restraints Impact Analysis of Biotechnology Instruments Market*
| Restraint | (~) % Impact on CAGR Forecast | Geographic Relevance | Impact Timeline |
|---|---|---|---|
| Lengthy FDA & CE-IVDR change-control cycles | -0.6% | Global, concentrated in US & EU | Medium term (2-4 years) |
| Volatile rare-earth & semiconductor supply for precision motors | -0.5% | Global, acute in APAC manufacturing | Medium term (2-4 years) |
| Shortage of automation-savvy lab technicians | -0.4% | Global, acute in North America & EU | Long term (≥ 4 years) |
| Cyber-security risks in cloud-connected platforms | -0.3% | Global | Short term (≤ 2 years) |
| Source: Mordor Intelligence | |||
Lengthy FDA & CE-IVDR Change-Control Cycles
Software updates or minor hardware tweaks can trigger full validation[2] under CE-IVDR, extending launch timelines by 12–18 months and absorbing scarce regulatory headcount. Mid-tier firms respond by outsourcing compliance documentation to specialized consultancies, but that raises cost bases and discourages frequent iteration of instrument firmware or assay protocols.
Shortage of Automation-Savvy Lab Technicians
Sixty-nine percent of new bioprocess vacancies now list robotics or coding skills, yet most university curricula still focus on manual bench techniques. Firms therefore invest in intuitive graphical user interfaces, self-calibrating sensors, and on-board training wizards that shorten onboarding from months to weeks while keeping error rates low.
*Our forecasts treat driver/restraint impacts as directional, not additive. The impact forecasts reflect baseline growth, mix effects, and variable interactions.
Biotechnology Instruments Market Segment Analysis
By Product:
Automation Drives Lab TransformationLab automation platforms held 42.10% biotechnology instruments market share in 2025 as pharmaceutical sponsors prioritized reproducibility across sprawling compound libraries and multi-site trials. The biotechnology instruments market size for automation rose alongside single-use bioreactor adoption, which forces every upstream and downstream step onto robotic carriers. Ten-axis collaborative arms paired with vision systems now load microtiter plates, swap pipette tips, and scan barcodes without human intervention, unlocking overnight run capability. Life science consumables record the swiftest 5.77% CAGR because single-use bags, filters, and tips eliminate labor-intensive cleaning steps and assure sterility in personalized therapies. Reagents pre-validated for specific assay kits further reduce downtime, fostering just-in-time inventory models that tie consumable reorder triggers to instrument software. Although IVD platforms sit in the mature basket, their molecular sub-segment climbs steadily as clinicians embrace syndromic panels that consolidate multiple pathogen targets into one swab, narrowing empirical antibiotic use.

By Distribution Channel:
Digital Transformation AcceleratesOffline specialists controlled 80.62% of biotechnology instruments market size in 2025 because complex installations still require site surveys, custom integration, and validation scripts. Even so, the 6.64% CAGR in online sales underscores a generational pivot toward e-commerce for standardized benchtop devices and kits under USD 20,000. Cloud-based quoting engines now let customers configure modules, choose service tiers, and schedule installation crews in a single session, cutting purchasing cycles from months to days. Vendors supplement virtual showrooms with augmented-reality demonstrations that guide users through footprint planning and cable routing. Consumables benefit most: bar-coded cartridges ordered automatically through application programming interfaces keep critical reagents in stock and feed real-time demand forecasts back to suppliers. Hybrid arrangements are emerging in which enterprise agreements are negotiated face-to-face yet executed through digital portals, blending the assurance of in-person consultation with the speed of web checkout.
By End-User:
CRO/CDMO Growth Reshapes ProcurementPharmaceutical and biotechnology companies retained 38.25% of the biotechnology instruments market share in 2025, thanks to deep R&D pipelines and internal biologics production. Their procurement teams, however, increasingly defer early-stage screening, toxicology, and even late-phase cell-therapy manufacturing to CRO/CDMO partners. These service providers post a 5.36% CAGR because they bundle regulatory documentation, capacity scalability, and client data segregation into one offering. As a result, the biotechnology instruments market now experiences bulk purchases geared toward multi-client workflows, favoring platforms that log sample provenance, automate chain-of-custody audits, and support electronic batch records. Academic and government laboratories remain steady yet budget-constrained, often stretching service contracts and extending depreciation schedules. Hospitals adopt compact molecular systems that slot into emergency rooms and transplant wards, demanding intuitive interfaces that clinicians can master without full-time laboratory oversight.
Geography Analysis
North America and Europe Biotechnology Instruments Market
North America retained the largest share of the biotechnology instruments market in 2025 at 40.85%, supported by clustered biopharma headquarters, deep venture funding, and mature contract service ecosystems. Subsidies for domestic semiconductor fabs also aim to buffer the market against future chip shortages. Europe follows with steady expansion driven by robust industrial-biotech policies in Germany and the United Kingdom's focus on synthetic biology startups. Energy-efficiency mandates such as draft ENERGY STAR specifications spur laboratories to replace legacy freezers and incubators with lower-wattage alternatives.
APAC Biotechnology Instruments Market
Asia-Pacific registers the fastest 6.05% CAGR to 2031 as China pours capital into biomanufacturing parks, Japan revitalizes its regenerative-medicine sector, and India scales contract chemistry services. Singapore, through tax incentives and predictable regulatory pathways, positions itself as a regional cell-therapy hub that demands automated closed-system instrumentation. Local suppliers coexist with multinationals, but integration competence often tips awards toward global brands able to provide 24-hour service coverage.
MEA and South America Biotechnology Instruments Market
The Middle East and Africa record 5.18% CAGR on the back of hospital modernization programs and government-backed research campuses in Saudi Arabia and the United Arab Emirates. South America posts 4.86% growth, with Brazil’s vaccine expansion and Argentina’s seed-trait research driving demand for portable genomic analyzers that function reliably in high-humidity environments. While purchasing power differs widely, the underlying need for quality-assured instruments that meet global accreditation standards converges across regions, aligning vendor roadmaps toward harmonized specifications.
Value Chain Analysis
The biotechnology instruments value chain starts with suppliers of specialized inputs such as semiconductors, precision optics, sensors, rare-earth motor components, reagents, and engineered plastics used in single-use fluid paths and cartridges. Instrument OEMs then integrate these components into automation platforms, analytical systems (for example, LC/MS), molecular diagnostics, and closed-system cell-processing devices, followed by performance validation and cybersecurity controls through software and firmware. Profit pools skew toward recurring revenue from proprietary consumables, assay kits, service contracts, and uptime-oriented maintenance programs that support installed bases across multi-year lifecycles.
Downstream, distribution and deployment are handled by direct sales teams and value-added distributors, including site surveys, installation, qualification (IQ/OQ/PQ), and user training, while CROs and CDMOs increasingly consolidate multi-client workflows that depend on standardization and documentation support. The supply chain is still sensitive to logistics and component constraints for temperature-sensitive or high-precision shipments; for example, July 2026 freight tightness on the Shanghai-Rotterdam route was associated with higher spot rates and reduced access to temperature-controlled space, extending delivery cycles for certain laboratory devices. In response, buyers and vendors emphasize multi-sourcing, local service coverage, and digital remote diagnostics to limit downtime when parts availability or transit times fluctuate.
Competitive Landscape
Market consolidation intensifies as diversified conglomerates acquire niche innovators to deliver end-to-end workflows extending from sample prep to cloud analytics. Thermo Fisher Scientific’s USD 4.1 billion acquisition of Solventum’s purification and filtration portfolio exemplifies this platform strategy and strengthens its upstream-to-downstream coverage in biologics purification. Competitors now rush to match breadth, prompting a wave of minority investments, co-development partnerships, and exclusive distribution agreements designed to plug capability gaps without full takeovers.
Technology differentiation centers on AI engines that slash unplanned downtime, embedded sensors that certify each run, and open software development kits that allow third-party apps to optimize protocols. Becton Dickinson’s latest flow-cytometry line couples robotics with spectral imaging to measure up to 50 markers in real time, reducing assay development cycles and opening new multiplexed-analysis revenue streams. Smaller challengers focus on miniaturization and cost, releasing portable mass specs and benchtop next-generation sequencers aimed at resource-limited labs; their success often depends on forging OEM alliances that secure access to stable supply chains.
Price competition remains moderate because validation overhead and operator training lock in installed bases for 7–10 years. Nonetheless, buyers are pushing for outcome-based contracts tied to uptime, throughput, or cost-per-sample. Vendors responding with integrated service bundles—combining consumables, remote monitoring, and on-site support—are capturing premium renewals and deepening customer loyalty. Cyber-security certifications increasingly influence award decisions as regulators scrutinize cloud-connected devices, motivating manufacturers to embed encryption, audit logging, and over-the-air patching into flagship platforms.
Biotechnology Instruments Industry Leaders
-
Agilent Technologies, Inc.
-
Becton, Dickinson and Company
-
bioMérieux SA
-
Danaher Corporation
-
Thermo Fisher Scientific
- *Disclaimer: Major Players sorted in no particular order
Biotechnology Instruments Market Companies Covered in this Report
- Agilent Technologies
- Azenta
- Beckton Dickinson
- bioMérieux
- Bio-Rad Laboratories
- Bruker
- Danaher
- Eppendorf
- Roche
- Hamilton Company
- Hudson Robotics
- Illumina
- Promega
- QIAGEN
- Quest Diagnostics
- Revvity Inc
- Siemens Healthineers
- Tecan Group
- Thermo Fisher Scientific
- Waters Corporation
Market Opportunities and Future Outlook
Integrated multiomics workflows are a key opportunity, because they combine higher sensitivity, extended mass range, and faster acquisition with software that can manage large data volumes. The 2026 product activity points to this demand direction: Waters launched new mass spectrometry systems positioned for multiomics (including cyclic IMS and a benchtop HRMS offering higher MS/MS sensitivity), and Agilent expanded integrated LC/MS workflow collaborations linking chromatography, mass spectrometry, and informatics. For labs running high-throughput discovery and translational programs, method-development friction tends to drop when instruments, data pipelines, and service ecosystems are delivered as a validated package rather than through piecemeal purchases.
A second opportunity sits in faster, more decentralized molecular testing and sequencing platforms that shorten turnaround times while operating closer to patients or manufacturing floors. In 2026, Roche introduced a next-generation sequencing platform framed around same-day whole-genome sequencing, and bioMerieux received IVDR CE-marking for a BIOFIRE SPOTFIRE near-patient respiratory/sore throat panel expansion, which supports demand for compact, regulated, sample-to-answer systems. On the industrial side, investment in sterile fill-finish, drug-device assembly, and biomanufacturing capacity across the United States and Europe continues to reinforce pull for closed, automated instrumentation and robust quality-control analytics in GMP settings, especially where staffing constraints and chain-of-custody requirements push adoption of traceable, software-connected instruments.
Recent Industry Developments in Biotechnology Instruments Market
- July 2026: Agilent Technologies expanded its Altura HPLC column portfolio with new size exclusion chromatography and PLRP-S columns aimed at biotherapeutic analysis. The additions broaden method options for protein characterization workflows and support recurring consumables pull-through tied to installed LC and LC/MS systems.
- March 2026: bioMerieux received IVDR CE-marking for its BIOFIRE SPOTFIRE Respiratory/Sore Throat plus (R/STplus) Panel and Panel Mini. The clearance extends near-patient multiplex molecular testing beyond traditional laboratories, supporting faster clinical decision-making and higher utilization of compact molecular platforms.
- January 2025: bioMerieux completed the acquisition of Accellix, a developer of a compact flow cytometry platform used for cell therapy manufacturing quality control. The deal expands bioMerieux capabilities in regulated cell therapy workflows where rapid, standardized release testing supports scaled manufacturing.
Biotechnology Instruments Market Report Scope and Research Methodology
Market Definition and Coverage
This market covers revenue earned from biotechnology instruments used to isolate, detect, measure, and analyze biological samples across research, clinical, and industrial laboratories, counted at the point where the instrument is sold.
Scope exclusions: We exclude refurbished or used instruments and routine lab consumables with no embedded technology value.
Segments Covered in This Report
- By Product Type
- Lab Automation Instruments
- Liquid Handling Systems
- Automated Plate Handlers
- Robotic Sample Processors
- Life Science Consumables
- Reagents & Buffers
- Microplates & Tubes
- Pipette Tips & Filtration
- IVD Instruments
- Clinical Chemistry Analyzers
- Hematology Analyzers
- Immunoassay Platforms
- Molecular Diagnostics Systems
- Lab Automation Instruments
- By Distribution Channel
- Offline
- Online
- By End-User
- Government & Academic Institutes
- Pharmaceutical & Biotechnology Companies
- Hospitals & Healthcare Facilities
- Contract Research & Manufacturing Organizations
- By Geography
- North America
- United States
- Canada
- Mexico
- Europe
- Germany
- United Kingdom
- France
- Italy
- Spain
- Rest of Europe
- Asia-Pacific
- China
- India
- Japan
- Australia
- South Korea
- Rest of Asia-Pacific
- Middle East and Africa
- GCC
- South Africa
- Rest of Middle East and Africa
- South America
- Brazil
- Argentina
- Rest of South America
- North America
Data Sources, Market Sizing, and Validation
Desk Research
Desk research was used to set the market boundaries and build the initial demand and supply picture by instrument class and end use. We referenced public science and health datasets and research funding signals that influence instrument demand, along with trade and manufacturing indicators that reflect where systems are produced and shipped.
Common inputs came from sources such as the US FDA (device and lab related listings where relevant), the US NIH and NSF (grant volumes and focus areas), Eurostat and the OECD (R&D and health system indicators), the World Bank (macro and investment context), and patent publications (to track technology activity). We also reviewed company annual reports, investor presentations, reputable press, and selectively used paid subscriptions for company financials and patent intelligence to validate revenue splits and timing. These examples are not exhaustive, and many other sources were also referred to for data collection, validation, and research clarification.
Primary Interviews and Surveys
Primary work focused on interviews and surveys with instrument suppliers, distributors, lab managers, and procurement oriented roles across pharma and biotech labs, academic institutes, and clinical testing settings. We used these discussions to confirm shipment momentum, average selling price direction, replacement cycles, and mix shifts by region, and then to close gaps where public data did not clearly show the split across instrument classes.
Distribution of primary research fieldwork respondents
| Company type | Respondent position | Region |
|---|---|---|
| Top tier: 29% | CXOs: 15% | APAC: 42% |
| Mid tier: 50% | Functional/Unit leaders: 29% | EMEA: 32% |
| Smaller Players: 21% | Managers: 56% | Americas: 26% |
Market-Sizing & Forecasting
Sizing starts with a top-down build where R&D and biomanufacturing activity, along with installed lab capacity signals, are translated into instrument demand pools and then mapped to value using observed price bands. We then corroborate totals using selective bottom-up approximations such as sampled supplier revenues by product line, distributor channel checks, and volume times ASP sanity checks for high visibility systems.
The model is anchored on practical inputs that are repeatable: research and biotech funding levels, lab expansion and capacity additions, instrument replacement cycles, utilization rates in core labs, and pricing movement linked to technology upgrades. Where an input is missing for a smaller country or a niche instrument class, we apply proxy ratios from similar markets and then stress test the output with expert feedback before finalizing. For forecasting, we used scenario analysis supported by multivariate regression on the strongest demand drivers, and assumptions were aligned to what primary respondents indicated for budgets, refresh timing, and lead times.
Data Validation & Update Cycle
Validation is done through multiple checks so the final number does not rely on any single dataset. We compare outputs against independent signals such as reported capital spending trends, lab expansion announcements, and observable pricing ranges, and then investigate outliers that break expected patterns by region or instrument category.
Before sign-off, the model is reviewed in steps, including internal analyst review and re-contact triggers when a key assumption shifts, such as a sharp change in procurement cycles or an unusual price move. Reports are refreshed annually, and interim updates are done when material events occur, followed by a final pre-delivery pass so clients receive the latest updated view.
Mordor Intelligence's Biotechnology Instruments Market Sizing Compared With Other Published Estimates
Published market sizes for biotechnology instruments can look different even when the topic sounds the same, because the underlying instrument list, pricing point, and year and currency handling are often not aligned. We keep the model tied to real purchase behavior by checking demand signals and then validating the value outcome with supply side reality checks.
The main gap comes from whether adjacent lab equipment and low tech lab items get bundled into the total, plus whether used and refurbished systems are treated as new sales. Some estimates also mix factory gate revenue with downstream channel markups, or use spot currency conversion that can move the number in a strong FX year. The spread is also widened when ASP progression is assumed as a flat uplift without being tested against technology refresh cycles and procurement feedback, and that is where Mordor Intelligence counts only brand-new biotechnology instruments at factory gate prices and converts values to constant 2025 USD.
Benchmark comparison
| Source | Market Size | Gaps in Research Methodology |
|---|---|---|
| Mordor Intelligence | USD 89.17 B (2025) | |
| Global Consultancy A | USD 96.30 B (2025) | Uses a wider equipment bundle that can pull in adjacent life science lab tools and some downstream channel margin, which lifts the value even if unit demand is similar. |
| Industry Association B | USD 83.40 B (2025) | Leans on member reported sales that may undercount smaller suppliers and cross border shipments, and it often applies conservative replacement cycle assumptions during budget-tight years. |
The table shows that most differences come from scope and pricing mechanics rather than a disagreement on long term biotech activity. By keeping inclusions specific, using constant currency handling, and cross-checking assumptions with interviews, our estimate stays traceable to clear variables that can be reviewed and updated.
Key Questions Answered in the Report
How is AI adoption influencing maintenance strategies for biotechnology instruments?
Laboratories are embedding machine-learning analytics in centrifuges, chromatographs, and liquid handlers to predict component wear before failure, improving uptime while reallocating technician hours to higher-value tasks.
What factors are driving demand for single-use consumables in biologics production?
Single-use filters, bags, and tips cut cross-contamination risk, reduce cleaning validation workload, and allow rapid changeovers between personalized therapy batches, making them the preferred option for flexible manufacturing.
How are outsourcing trends reshaping instrument purchasing decisions?
Contract research and manufacturing organizations now negotiate multi-platform, service-bundled contracts that favor vendors offering integrated hardware, software, and validation support rather than standalone devices.
Why are point-of-care molecular diagnostic platforms attracting increased investment?
Decentralized PCR and isothermal systems provide rapid, bedside results that shorten clinical decision times, aligning with hospital goals to improve outcomes and relieve core laboratory bottlenecks.
What supply-chain challenges currently affect precision components in lab automation equipment?
Dependence on a limited number of rare-earth magnet suppliers and semiconductor fabs exposes liquid-handling motors and optical sensors to extended lead times and price volatility.
How are sustainability regulations shaping design priorities for new laboratory instruments?
Energy-efficiency targets and plastics-reduction mandates are prompting manufacturers to develop lower-standby-power electronics and recyclable cartridge materials, differentiating products through eco-label certifications.