
Bioprocess Technology Market Size and Share
Market Overview
| Study Period | 2020 - 2031 |
|---|---|
| Market Size (2026) | USD 43.95 Billion |
| Market Size (2031) | USD 85.73 Billion |
| Growth Rate (2026 - 2031) | 14.30 % |
| Fastest Growing Market | Asia Pacific |
| Largest Market | North America |
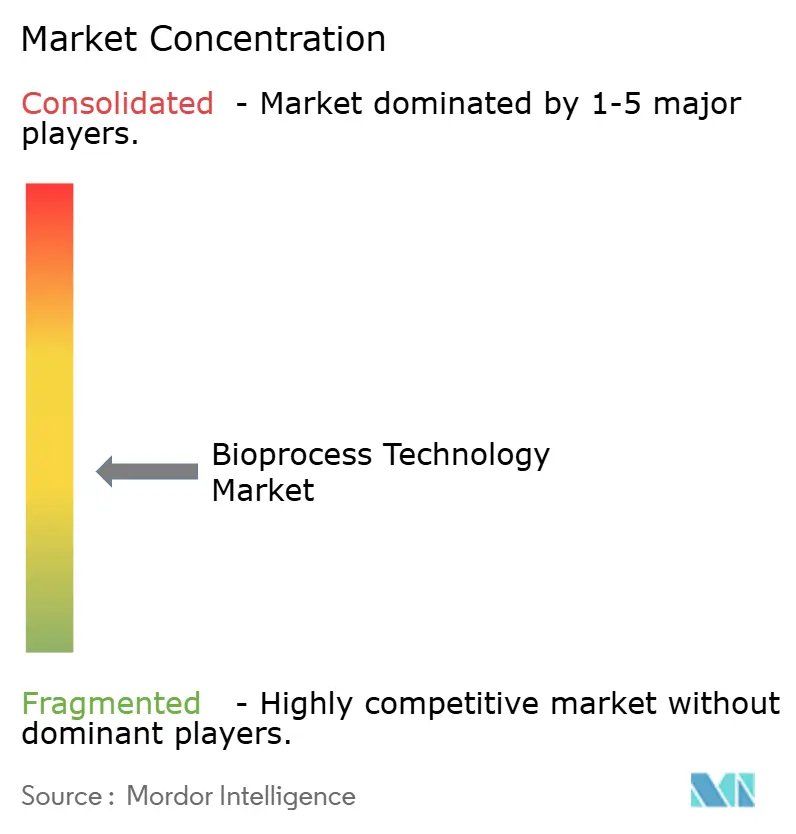
| Market Concentration | Medium |
Major Players *Disclaimer: Major Players sorted in no particular order Image © Mordor Intelligence. Reuse requires attribution under CC BY 4.0. | |
Bioprocess Technology Market Analysis by Mordor Intelligence
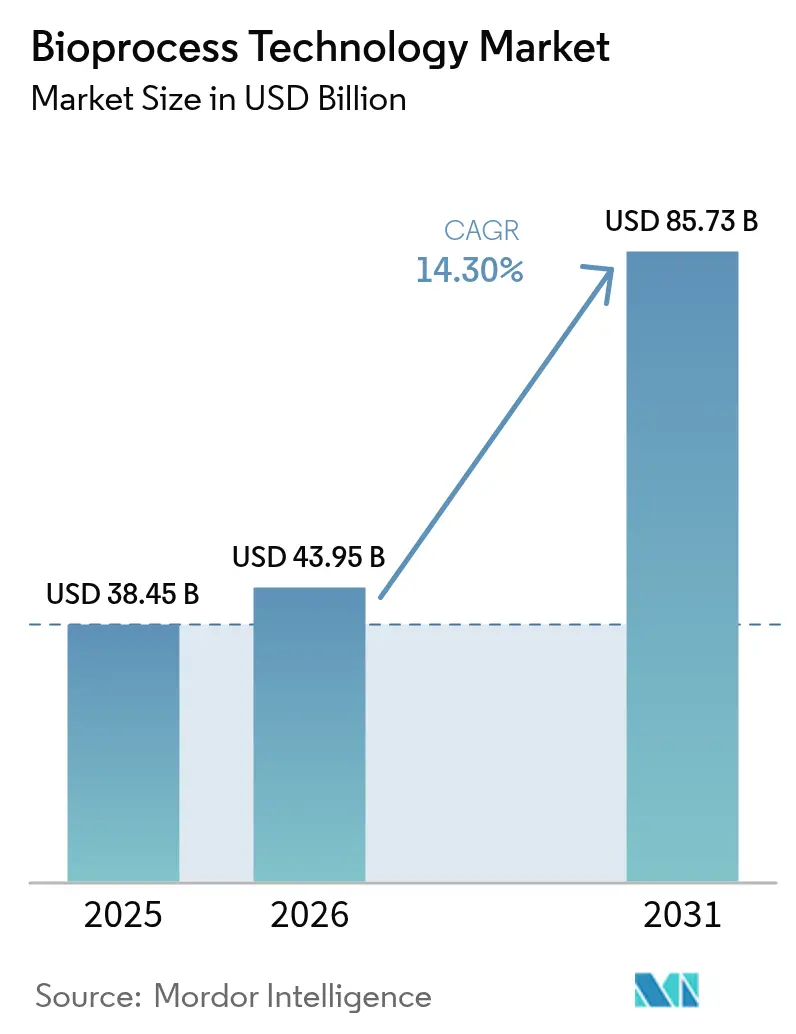
Bioprocess Technology market size in 2026 is estimated at USD 43.95 billion, growing from 2025 value of USD 38.45 billion with 2031 projections showing USD 85.73 billion, growing at 14.3% CAGR over 2026-2031.
Capacity additions at contract development and manufacturing organizations (CDMOs) are accelerating as the share of global biologics production outsourced is set to climb by 2030, reshaping competitive dynamics and creating sustained demand for upstream and downstream solutions. Rising pipelines in cell and gene therapy (CGT) have intensified requirements for advanced manufacturing platforms, with growing demand for CGT manufacturing services. The dominance of single-use consumables, broader adoption of perfusion culture, and regulators’ growing comfort with continuous manufacturing are lifting productivity benchmarks across the bioprocess technology market. Regional momentum is polarized: North America retains infrastructure leadership, yet Asia-Pacific is expanding fastest on the back of Chinese and South Korean capacity investments.
Key Report Takeaways
- By product, consumables and accessories led with 60.55% of the bioprocess technology market share in 2025 and it is projected to expand at a 16.42% CAGR to 2031.
- By process type, downstream processing held 51.20% share of the bioprocess technology market size in 2025; while upstream processing record the highest projected CAGR at 14.55% through 2031.
- By technology, fed-batch commanded 41.90% of the bioprocess technology market size in 2025, while continuous platforms recorded the highest CAGR at 14.10%.
- By application, monoclonal antibodies contributed 36.20% revenue in 2025; cell & gene therapy products registered the fastest 15.72% CAGR to 2031.
- By end user, biopharmaceutical companies accounted for 61.05% of demand in 2025, whereas CMOs expanded at a 14.75% CAGR.
- By geography, North America secured 38.90% share of the bioprocess technology market size in 2025; Asia-Pacific is on track for an 17.65% CAGR through 2031.
Note: Market size and forecast figures in this report are generated using Mordor Intelligence’s proprietary estimation framework, updated with the latest available data and insights as of 2026.
Global Bioprocess Technology Market Trends and Insights
Drivers Impact Analysis*
| Driver | (~) % Impact on CAGR Forecast | Geographic Relevance | Impact Timeline |
|---|---|---|---|
| Expansion in the Biopharmaceutical Industry | +2.8% | North America, EU lead | Medium term (2-4 years) |
| Growing Contract Development & Manufacturing Outsourcing | +2.1% | Global with APAC spill-over | Short term (≤ 2 years) |
| Surge in Cell & Gene Therapy Pipelines | +3.2% | North America, EU core, APAC rising | Long term (≥ 4 years) |
| Rising Demand for Single-Use Systems | +1.9% | Global | Short term (≤ 2 years) |
| Advent of Continuous & Hybrid Platforms | +1.7% | North America, EU focus | Medium term (2-4 years) |
| AI-Driven Bioprocess Optimization | +1.4% | Developed markets | Long term (≥ 4 years) |
| Source: Mordor Intelligence | |||


Expansion in the Biopharmaceutical Industry
Biopharmaceutical sales climbed lifting biologics’ contribution within overall drug spending from 41% in 2024 toward 45% by 2028. FDA projections of up to 20 CGT approvals annually from 2025 underline a new wave of complex modalities that require high-precision, GMP-compliant manufacturing suites. Samsung Biologics’ digital-twin deployment demonstrates how advanced modeling can compress validation timelines while maintaining data integrity.[1]Bioprocess International, “Digital Twins Transform Large-Scale Biologics Facilities,” bioprocessintl.com Capital-intensive upgrades are therefore migrating toward flexible, single-use configurations that accommodate multiple modalities without compromising regulatory expectations.
Growing Contract Development & Manufacturing Outsourcing
The biologics CDMO segment is on course, fueled by large pharma’s strategic divestment of non-core manufacturing assets. Samsung Biologics’ USD 1.4 billion Plant 5 expansion and Lonza’s USD 1.2 billion acquisition of Roche’s Vacaville site (330,000 L) illustrate an arms race for large-scale capacity.[2]CHEManager, “Samsung Biologics Breaks Ground on Plant 5,” chemanager.com Potential passage of the BIOSECURE Act could redirect outsourced volumes from Chinese providers to Western and Korean suppliers; 49% of executives surveyed in 2024 expected stronger contract services growth during 2025. The shift cements the bioprocess technology market as a pivotal enabler of global capacity realignment.
Surge in Cell & Gene Therapy Pipelines
Lonza’s commercial supply pact for CASGEVY, the first CRISPR-edited therapy, exemplifies demand for bespoke viral-vector suites and closed-system cell culture. Standardization remains elusive, yet automation and modular facilities are steadily reducing cost-of-goods. Gene therapy approvals like ELEVIDYS and ROCTAVIAN pushed the market, while the FDA's streamlined approval pathways encourage continued investment. Manufacturing challenges persist, with standardization gaps and workforce shortages creating bottlenecks, yet automation advances and platform process adoption are addressing scalability concerns. The shift from autologous to allogeneic therapies promises enhanced cost-effectiveness and treatment accessibility.
Rising Demand for Single-Use Bioprocessing Systems
Disposable technologies now dominate commercial biologics production workflows, offering reduced contamination risk and faster changeover versus stainless-steel installations. Thermo Fisher’s 5 L DynaDrive bioreactor boosts productivity by 27% while providing linear scalability up to 5,000 L. WuXi Biologics completed its first 5,000 L PPQ run in Hangzhou, cutting protein cost by 70% and raising yield 20%. Legacy players like GSK invested USD 120 million in Pennsylvania to deploy 2,000 L single-use reactors for complex biologics.
Restraints Impact Analysis*
| Restraint | (~) % Impact on CAGR Forecast | Geographic Relevance | Impact Timeline |
|---|---|---|---|
| High Capital Cost of Integrated Systems | -1.8% | Global, emerging markets sensitive | Medium term (2-4 years) |
| Stringent cGMP & Validation Requirements | -1.2% | Global, regional variability | Long term (≥ 4 years) |
| Chronic Skilled-Labor Shortages | -2.1% | Developed markets acute | Short term (≤ 2 years) |
| Upstream-Downstream Scale Mismatch | -0.9% | Process-specific | Medium term (2-4 years) |
| Source: Mordor Intelligence | |||
High Capital Cost of Integrated Systems
Up-front investments for state-of-the-art facilities can exceed USD 500 million, exemplified by Lonza’s planned Vacaville upgrades that target next-gen mammalian platforms. Inflationary pressures have lifted equipment and clean-room construction costs by double-digit percentages since 2023, forcing smaller biotech firms to lean on CDMOs for access to modern capacity.[3]Pharma Manufacturing, “Inflation’s Impact on Facility Projects,” pharmamanufacturing.com Continuous-manufacturing conversions are particularly capital heavy because parallel batch suites must stay online during validation, extending payback horizons. As a result, technology adoption cycles often hinge on demonstrable ROI and regulatory clarity, delaying penetration in cash-constrained geographies.
Chronic Skilled-Labor Shortages
Eighty percent of biomanufacturing sites reported hiring difficulties in 2024, and Cytiva’s resilience index dipped from 6.27 to 5.60 between 2021 and 2023, reflecting a shrinking specialist pool. Automation proficiency appears in 69% of advertised roles, yet academic curricula seldom provide hands-on exposure to GMP digital systems. The National Institute for Innovation in Manufacturing Biopharmaceuticals found that new hires require up to nine months of supplementary training, adding USD 100,000 per worker in opportunity costs. Employers are reducing degree requirements and introducing in-house academies, but retention remains problematic as industry demand outpaces supply.
*Our forecasts treat driver/restraint impacts as directional, not additive. The impact forecasts reflect baseline growth, mix effects, and variable interactions.
Segment Analysis
By Product: Consumables Drive Revenue and Innovation
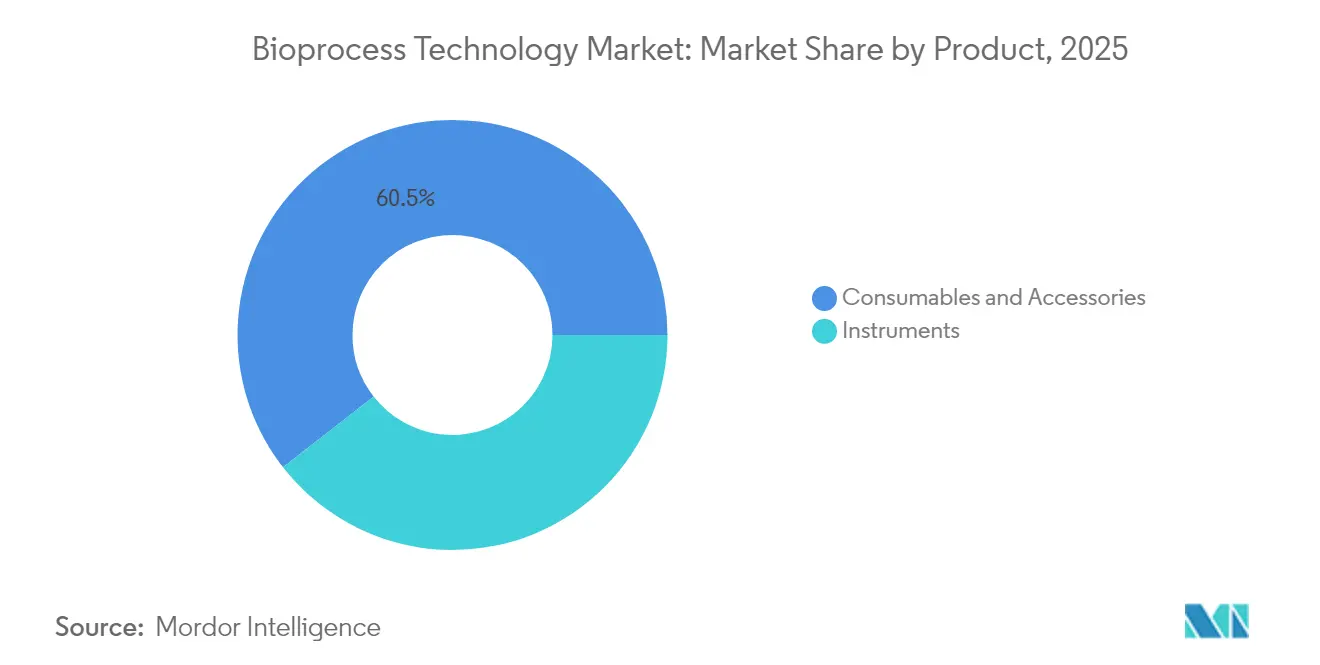
Consumables and accessories accounted for 60.55% of the bioprocess technology market share in 2025 and are forecast to advance at a 16.42% CAGR through 2031. This growth cements single-use bags, sterile connectors, and custom media as recurring revenue pillars within the bioprocess technology market. Culture media optimized for CGT has underscored value potential, with growing demand for gene-therapy media.
Instrument demand is comparatively steadier, underpinned by innovations such as the 5 L DynaDrive bioreactor and Sartorius’ BIOSTAT RM TX platform for automated cell expansion. Process analyzers are benefiting from heightened PAT adoption as facilities transition toward continuous workflows. The consumables boom embodies the larger structural shift away from stainless-steel dependencies, enabling faster turnarounds and lighter capital footprints across the bioprocess technology market.


By Process Type: Downstream Dominance with Upstream Acceleration
Downstream operations captured 51.20% of bioprocess technology market size in 2025, led by chromatography, filtration, and viral clearance solutions. Chromatography is evolving toward multi-column continuous formats that reclaim resin capacity and buffer efficiency. Upstream, perfusion culture adoption is propelling a 14.55% CAGR, as high cell-density systems cut bioreactor volume requirements while sustaining volumetric productivity.
Planova FG1’s seven-fold performance jump underscores the ongoing innovation race in virus filtration. Yet perfusion systems demonstrated at 2,000 L by Samsung Biologics embody upstream’s acceleration by offering steady-state cultures that pair seamlessly with continuous downstream platforms. These dynamics are tightening integration between unit operations, improving overall facility throughput across the bioprocess technology market.
By Technology: Fed-Batch Leadership with Continuous Processing Emergence
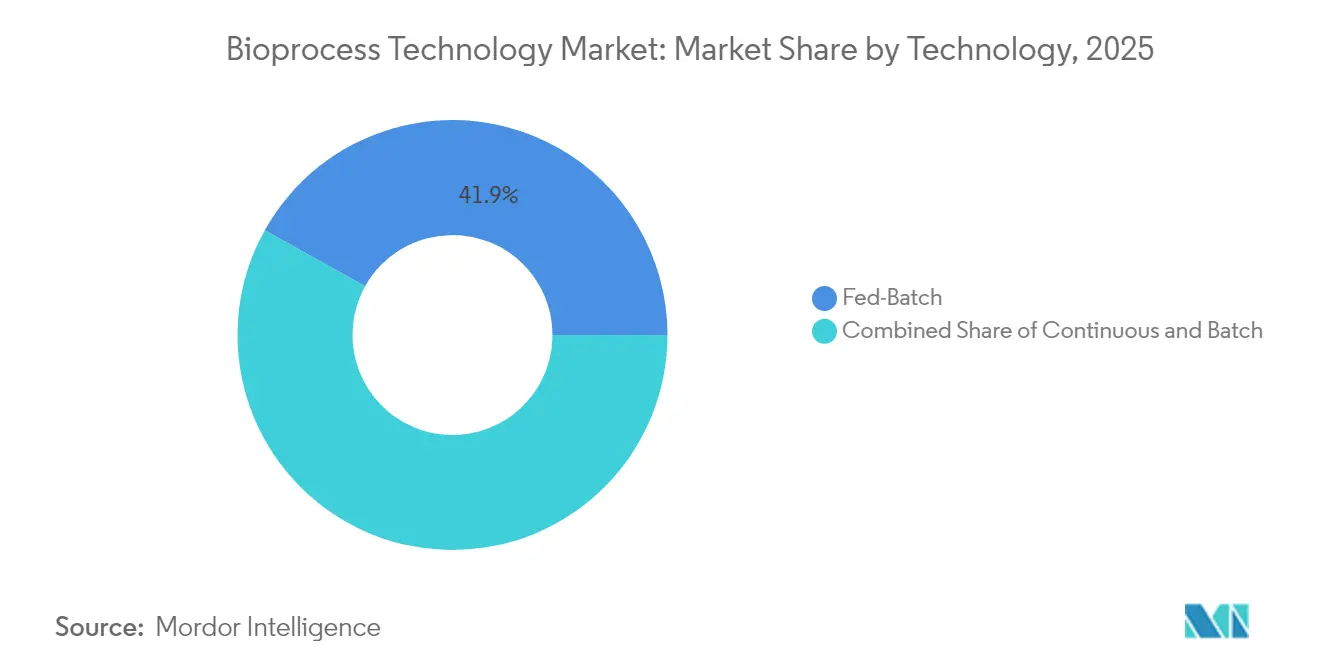
Fed-batch retained 41.90% share of the bioprocess technology market size in 2025 through its regulatory familiarity and extensive installed base. However, continuous setups are expanding at 14.10% CAGR as manufacturers chase smaller footprints and cost-of-goods gains.
ICH Q13 and FDA guidance have lowered adoption barriers, and multi-column chromatography is alleviating downstream bottlenecks in early adopters’ pipelines. Perfusion technologies serve as a pragmatic bridge, delivering continuous cell culture outputs while harvesting in batches to ease regulatory submissions. As more sponsors seek speed-to-clinic, continuous lines are expected to seize a larger slice of future capital budgets, pivoting the bioprocess technology market toward fully integrated, end-to-end continuous architectures.
By Application: Monoclonal Antibodies Lead with CGT Acceleration
Monoclonal antibodies contributed 36.20% of 2025 revenues, driven by expanding oncology and autoimmune portfolios and a steady trickle of biosimilar launches. CGT pipelines, however, are charting the steepest trajectory at a 15.72% CAGR through 2031, buoyed by the FDA’s expectation of approving up to 20 such products each year from 2025.
Lonza’s CASGEVY supply agreement illustrates escalating demand for CRISPR-enabled manufacturing know-how. Recombinant proteins and vaccines preserve diversified demand streams, yet their growth rates trail CGT’s explosive rise as regulatory pathways mature. Collectively, these trends underline the imperative for flexible platforms that can switch between high-titer monoclonal antibody runs and small-volume autologous CGT batches within the same facility footprint.
By End User: Biopharmaceutical Companies Dominate with CMO Growth
Biopharmaceutical sponsors controlled 61.05% of spending in 2025, leaning on internal networks for core franchises. Nonetheless, CMOs are expanding at a 14.75% CAGR as outsourced volumes climb, specifically for complex modalities requiring bespoke suites. Lonza’s integration of Roche’s Vacaville site now offers 330,000 L of capacity, signaling that big-ticket acquisitions remain a primary route to scale.
Academic institutes and government labs supply early-stage discovery work, often partnering with CDMOs for scale-up. The BIOSECURE Act could further pivot outsourcing to Western and Korean vendors, intensifying investment into greenfield builds and accelerating technology refresh cycles across the bioprocess technology market.

Geography Analysis
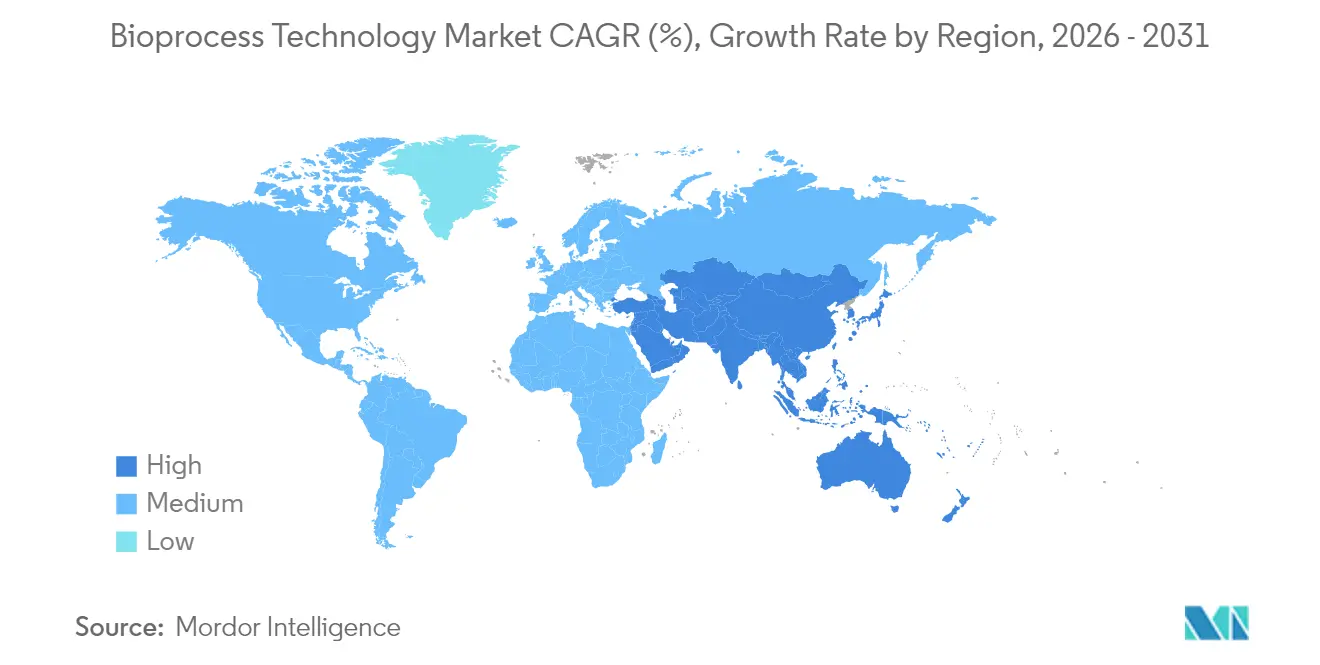
North America’s 38.90% market leadership is anchored by FDA regulatory depth and an ecosystem of established innovators. GSK’s USD 120 million single-use plant in Pennsylvania and Thermo Fisher’s pending Solventum deal reinforce domestic capacity commitments. Canada’s and Mexico’s cross-border supply chains complement United States strengths, leveraging USMCA provisions for frictionless component trade.
Europe maintains competitive parity through cohesive regulatory frameworks such as the EMA’s revised Annex 1 and upcoming ATMP guidelines, which advocate risk-based sterility assurance. Germany, the United Kingdom, and France provide dense biotech clusters, while Poland and the Czech Republic are capturing spill-over investments through favorable cost structures and EU funding.
Asia-Pacific is the growth pacesetter with an 17.65% CAGR, driven by China’s and South Korea’s extensive greenfield builds. WuXi Biologics’ 15,000 L single-use lines delivered 70% cost savings compared with stainless-steel incumbents. Cytiva’s new 6,100 m² filter plant in Incheon and Samsung Biologics’ digital-twin capacity expansion underscore South Korea’s vaccine hub ambitions. India is pivoting toward global GMP certification but faces infrastructure bottlenecks, prompting domestic firms to invest overseas rather than upgrade local sites. The Middle East, Africa, and South America remain emergent, with Saudi Arabia and Brazil leading nascent biomanufacturing initiatives.

Regulatory Landscape
Regulatory oversight for bioprocess technology is increasingly shaped by frameworks that support modernization of biologics manufacturing while maintaining cGMP expectations. In the United States, the FDA launched the PreCheck Pilot Program in February 2026 to structure early engagement for new domestic manufacturing facilities, reinforcing pre-submission alignment on facility readiness, controls, and data packages for advanced platforms such as single-use and more automated unit operations.
Regulators are also formalizing pathways for continuous and more distributed production models. ICH Q13 (Step 5) provides an internationally recognized foundation for continuous manufacturing of drug substances and drug products, with direct implications for validation strategy, process control, and documentation for biologics. In the EU, the EMA continues to expand its biological medicinal products Q&A set (updated in December 2025, including items such as critical in-process controls and bioburden testing), while its Quality Innovation Group develops considerations for pharmaceutical process models, pointing to higher expectations for model validation as digitalization and advanced process analytics become more prevalent. Complementing these changes, the FDA published a proposed rule in July 2026 to amend drug establishment registration requirements for distributed manufacturing establishments and certain foreign establishments, which can affect compliance practices for networked or modular manufacturing footprints.
Competitive Landscape
Sartorius, Thermo Fisher Scientific, and Danaher command a wide footprint that spans media, bioreactors, filtration, and analytics. Thermo Fisher’s USD 4.1 billion acquisition of Solventum’s purification business projected to contribute USD 1 billion in annual revenue—augments downstream depth while targeting USD 125 million in synergies within five years. Danaher’s consolidation of Cytiva and Pall yields a USD 7.5 billion bioprocess unit capable of one-stop solutions from cell line development to final fill-finish.
Sartorius continues to bulk up on consumables via its EUR 50 million purchase of Xell AG, solidifying its media and feed portfolio. White-space disruptors are carving niches in precision fermentation, automated CGT culture, and modular micro-factories that promise faster deployment. Digital transformation is now a decisive differentiator: Samsung Biologics’ CFD-based digital twin and Amgen’s data-driven run-rate optimization are tangible examples of operational superiority. Sustainable materials and closed-loop recycling schemes for single-use plastics are emerging as another battleground as regulators and clients scrutinize environmental footprints.
Bioprocess Technology Industry Leaders
Danaher Corporation
Sartorius AG
Bio-Rad Laboratories Inc.
Agilent Technologies Inc.
Thermo Fisher Scientific Inc.
- *Disclaimer: Major Players sorted in no particular order

Market Opportunities and Future Outlook
Recent investment and capacity moves point to specific whitespace in scalable, flexible biomanufacturing infrastructure and downstream processing capability. Fujifilm Biotechnologies opened expanded facilities in Teesside, England in February 2026 after a GBP 400 million investment, adding 2,000 L and 5,000 L single-use bioreactors that fit the market shift toward multi-product lines and faster changeover operations. Evonik also announced an EUR 80 million investment in April 2026 to expand downstream fermentation capabilities at its Fermas site in Slovenska Lupca, Slovakia, and later outlined a USD 100 million modernization program for its Lafayette, Indiana drug substance site, reinforcing how purification and late-stage processing capacity remain practical bottlenecks and a priority spend area.
A second opportunity zone is FDA-aligned, geographically diversified capacity that supports outsourcing growth and modality expansion, including for cell and gene therapy and other complex biologics. Samsung Biologics reported a U.S. footprint step in April 2026 through the acquisition of a Rockville, Maryland biomanufacturing site for USD 280 million, adding 60,000 L of cGMP capacity, while Bora Biologics expanded its U.S. platform with a Rockville facility and cited 20,000 L of installed single-use bioreactor capacity across two FDA-registered sites. As sponsors and CDMOs broaden their networks, demand is concentrating on standardized single-use consumables, closed-system unit operations, and QC-ready analytics that can shorten tech transfer and validation cycles across regions.
Recent Industry Developments
- May 2026: Sartorius Stedim Biotech opened a new EUR 140 million competence center in Freiburg, Germany, to produce quality-critical cell and gene therapy components such as cytokines and growth factors. The site expansion bolsters local supply of high-spec materials that can constrain CGT process throughput and tightens control over critical raw materials.
- February 2025: Thermo Fisher Scientific announced a USD 4.1 billion agreement to acquire Solventum's Purification and Filtration business. The deal expands Thermo Fisher's downstream processing portfolio in a segment central to chromatography and filtration intensity, and it targets greater end-to-end integration for biologics development and manufacturing workflows.
- October 2024: Lonza completed its USD 1.2 billion acquisition of Roche's Vacaville biologics manufacturing facility, adding a site with 330,000 L bioreactor capacity and integrating an established workforce. The acquisition reinforces large-scale mammalian capacity at a time when sponsors are reallocating manufacturing footprints, and it provides a base for planned next-generation platform upgrades at the facility.


Research Methodology Framework and Report Scope
Market Definition and Coverage
This market covers the technologies, instruments, and consumables that enable bioprocessing in biopharma and biotech manufacturing, from upstream activities like cell culture to downstream steps like purification and filtration, captured as revenue generated from these solutions.
Scope exclusions: services-only revenue and general lab equipment not primarily used for bioprocessing are excluded to avoid overstating manufacturing-specific demand.
Segmentation Overview
- By Product
- Instruments
- Bioprocess Analyzers
- Osmometers
- Bioreactors
- Incubators
- Other Instruments
- Consumables & Accessories
- Culture Media
- Reagents
- Other Consumables & Accessories
- Instruments
- By Process Type
- Upstream Processing
- Downstream Processing
- By Technology
- Batch
- Fed-Batch
- Continuous
- By Application
- Recombinant Proteins
- Monoclonal Antibodies
- Cell & Gene Therapy Products
- Antibiotics
- Other Applications
- By End User
- Biopharmaceutical Companies
- Contract Manufacturing Organizations
- Academic & Research Institutes
- Other End Users
- By Geography
- North America
- United States
- Canada
- Mexico
- Europe
- Germany
- United Kingdom
- France
- Italy
- Spain
- Rest of Europe
- Asia Pacific
- China
- Japan
- India
- Australia
- South Korea
- Rest of Asia-Pacific
- Middle East & Africa
- GCC
- South Africa
- Rest of Middle East & Africa
- South America
- Brazil
- Argentina
- Rest of South America
- North America
Data Sources, Market Sizing, and Validation
Desk Research
Desk research starts by mapping what is being made, where it is being made, and how production intensity is changing for biologics. For this, we referred to public sources such as the US FDA databases for biologics approvals and manufacturing updates, the European Medicines Agency product and assessment information, and the WHO vaccine and biologics related publications.
To ground the model with repeatable indicators, we also used sources such as OECD health statistics, World Bank macro indicators, and trade statistics published by UN Comtrade for relevant equipment and consumables categories, which helps check procurement directionally where buying is expanding. Company annual reports, investor presentations, and press releases were used to understand product mix and pricing direction, and patent databases were selectively used to spot where process innovation is being filed. In addition, a paid subscription for company financials and news was used to speed up coverage of smaller public disclosures and keep timelines consistent. The sources listed above are illustrative and not exhaustive, and many other public references were also used for data collection, validation, and clarification.
Primary Interviews and Surveys
Primary work was used to convert the desk signals into realistic adoption and spending assumptions, especially where published data does not separate bioprocess uses from general lab uses. We spoke with a mix of bioprocess equipment and consumables suppliers, biopharma manufacturing teams, and CMOs, and we made sure views were captured across major production hubs in APAC, EMEA, and the Americas to cross-check volumes, pricing, and buying cycles.
Distribution of primary research fieldwork respondents
| Company type | Respondent position | Region |
|---|---|---|
| Top tier: 33% | CXOs: 14% | APAC: 47% |
| Mid tier: 52% | Functional/Unit leaders: 36% | EMEA: 35% |
| Smaller Players: 15% | Managers: 50% | Americas: 18% |
Market-Sizing & Forecasting
Sizing was built using a top-down and bottom-up approach where the biologics manufacturing demand pool is reconstructed first, and then it is translated into bioprocess technology spend through penetration and intensity factors. In practice, the model starts from regional biomanufacturing activity signals and then applies assumptions for typical consumables burn rates, equipment replacement cycles, and expansion timing.
Key inputs used to keep the totals realistic include: the pace of biopharma capacity additions (new facilities and line expansions), installed bioreactor capacity growth and utilization direction, the mix shift toward single-use systems, the share of production moving to CMOs, and observable pricing changes for high-usage consumables (filters, bags, and related accessories). Where any input series was weak at country level, it was bridged using regional shares validated in interviews, and then rechecked against trade flow direction and company disclosure trends.
Forecasting relies mainly on scenario analysis because expansion plans, regulatory timing, and funding cycles can change the ramp-up speed, especially in newer modalities. The base case uses interview-confirmed expectations on capacity utilization and adoption of single-use and continuous processing steps, and it is then stress-tested with slower and faster ramp scenarios. As a safeguard, selective bottom-up approximations were used, such as sample supplier revenue roll-ups and volume times average selling price checks for a few high-consumption product groups, which helped adjust the top-down totals when gaps appeared.
Data Validation & Update Cycle
Validation is done by checking the model against independent signals that should move in the same direction, such as biologics approvals activity, major facility announcements, and trade movement for relevant categories. Outliers are reviewed by tracing them back to the assumption level, and then the underlying inputs are revisited before sign-off, with follow-up outreach triggered when responses conflict across regions or respondent types.
Each release goes through a multi-step internal review where calculations, unit consistency, and currency conversions are rechecked, and regional totals are compared for reasonableness. Reports are refreshed annually, and interim updates are made when material events occur (for example, large manufacturing expansions, major regulatory shifts, or sharp pricing changes). Before delivery, an analyst completes a fresh pass so the shared view reflects the latest publicly available developments.
Mordor Intelligence's Bioprocess Technology Market Size Measured Against Other Published Estimates
Published market values for bioprocess technology can look far apart because the scope boundary is not always the same, even when the titles sound similar. Differences usually come from what is counted as bioprocess-specific spend, which years are used for currency conversion, and whether the model leans on capacity and utilization signals or broader life science spend proxies.
The table points to a clear spread in 2025 to 2026 values, and in Mordor Intelligence's model the total is built from bioprocess instruments plus consumables and accessories tied to upstream and downstream production use, with services-only revenue and general lab equipment sitting outside the counted market. Gaps also show up when one estimate assumes a slower price progression for high-usage consumables, or when capacity expansion timing is treated as immediate demand instead of being staged across commissioning and ramp-up.
Benchmark comparison
| Source | Market Size | Gaps in Research Methodology |
|---|---|---|
| Mordor Intelligence | USD 43.95 B (2026) | |
| Global Consultancy A | USD 33.60 B (2025) | Uses a different base year and appears to apply a broader definition that can blend manufacturing-oriented tools with adjacent lab spending, which changes the demand pool and reduces year-to-year comparability. |
| Industry Publisher B | USD 33.30 B (2025) | Works with a lower growth profile over a longer horizon, and the sizing is less explicitly tied to production-intensity drivers such as single-use penetration, consumables burn rates, and staged ramp-up of new capacity. |
Overall, the differences are mostly explained by scope edges and how fast manufacturing activity is translated into technology spend. By tying the model to capacity additions, utilization direction, and consumables intensity checks, the sizing stays traceable to practical demand drivers and can be repeated when new public signals or interview inputs change.


Key Questions Answered in the Report
What is the projected value of the bioprocess technology market by 2031?
Forecasts place the bioprocess technology market at USD 85.73 billion by 2031, reflecting a 14.3% CAGR from 2026.
Which product category generates the highest revenue?
Consumables and accessories dominate with 60.55% revenue share in 2025 and continue to expand fastest on single-use demand.
How fast is the cell and gene therapy segment growing?
CGT applications are advancing at a 15.72% CAGR through 2031, driven by a pipeline of more than 1,200 active clinical studies.
Which region is exhibiting the fastest growth?
Asia-Pacific leads with an 17.65% CAGR through 2031, buoyed by Chinese and South Korean capacity additions.
What technology trend is reshaping future facilities?
Continuous manufacturing, underpinned by ICH Q13 guidance, is gaining momentum because it lowers cost-of-goods and boosts supply resilience.
Page last updated on:


 Your data is secure and never sold or shared.


