
Bioprocess Containers Market Size and Share
Market Overview
| Study Period | 2020 - 2031 |
|---|---|
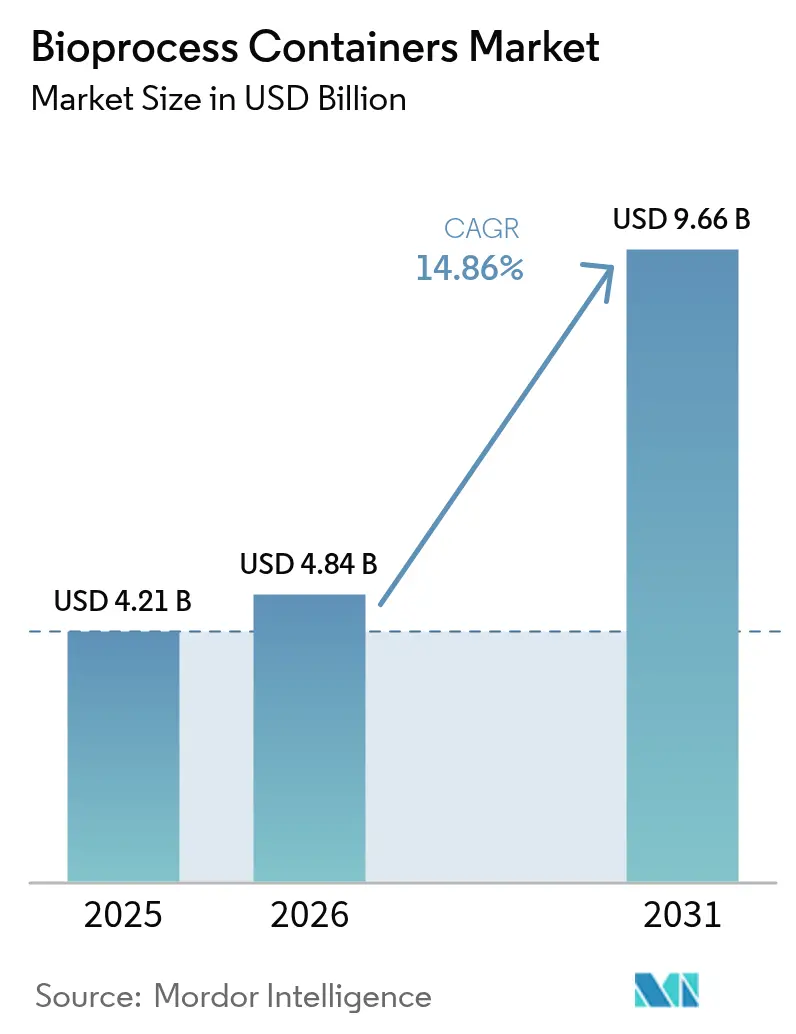
| Market Size (2026) | USD 4.84 Billion |
| Market Size (2031) | USD 9.66 Billion |
| Growth Rate (2026 - 2031) | 14.86 % |
| Fastest Growing Market | Asia-Pacific |
| Largest Market | North America |
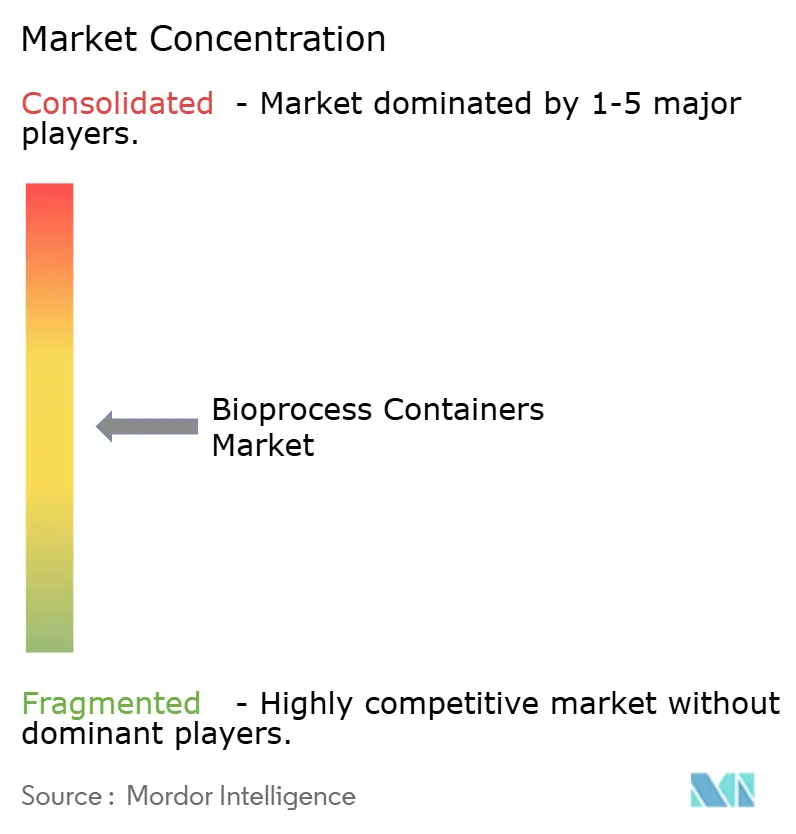
| Market Concentration | Medium |
Major Players *Disclaimer: Major Players sorted in no particular order Image © Mordor Intelligence. Reuse requires attribution under CC BY 4.0. | |
Bioprocess Containers Market Analysis by Mordor Intelligence
The bioprocess containers market size is expected to grow from USD 4.21 billion in 2025 to USD 4.84 billion in 2026 and is forecast to reach USD 9.66 billion by 2031 at 14.86% CAGR over 2026-2031. Rapid adoption of flexible manufacturing, pandemic-ready capacity planning, and lower capital outlays versus stainless-steel systems continue to reinforce demand for single-use containers. Biopharmaceutical manufacturers favor the technology for its proven ability to minimize cross-contamination while supporting accelerated product changeovers. Regulatory authorities now encourage closed, disposable processing trains that inherently align with automated, data-rich production lines. Together, these forces underscore how the bioprocess containers market is moving from niche installations toward mainstream status across commercial and clinical facilities.
Key Report Takeaways
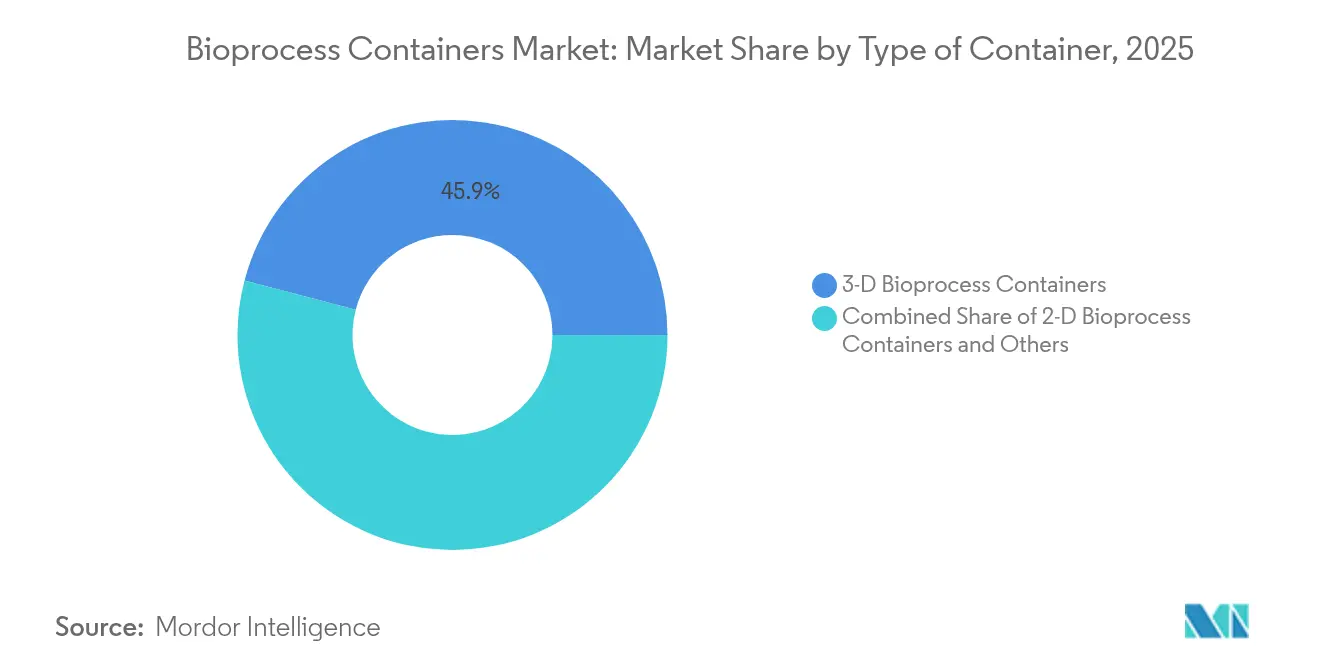
- By type, 3-D containers commanded 45.92% of bioprocess containers market share in 2025, while 2-D containers are advancing at 15.23% CAGR through 2031.
- By application, upstream processing held 54.56% share of the bioprocess containers market size in 2025, whereas downstream processing is forecast to expand at 15.62% CAGR to 2031.
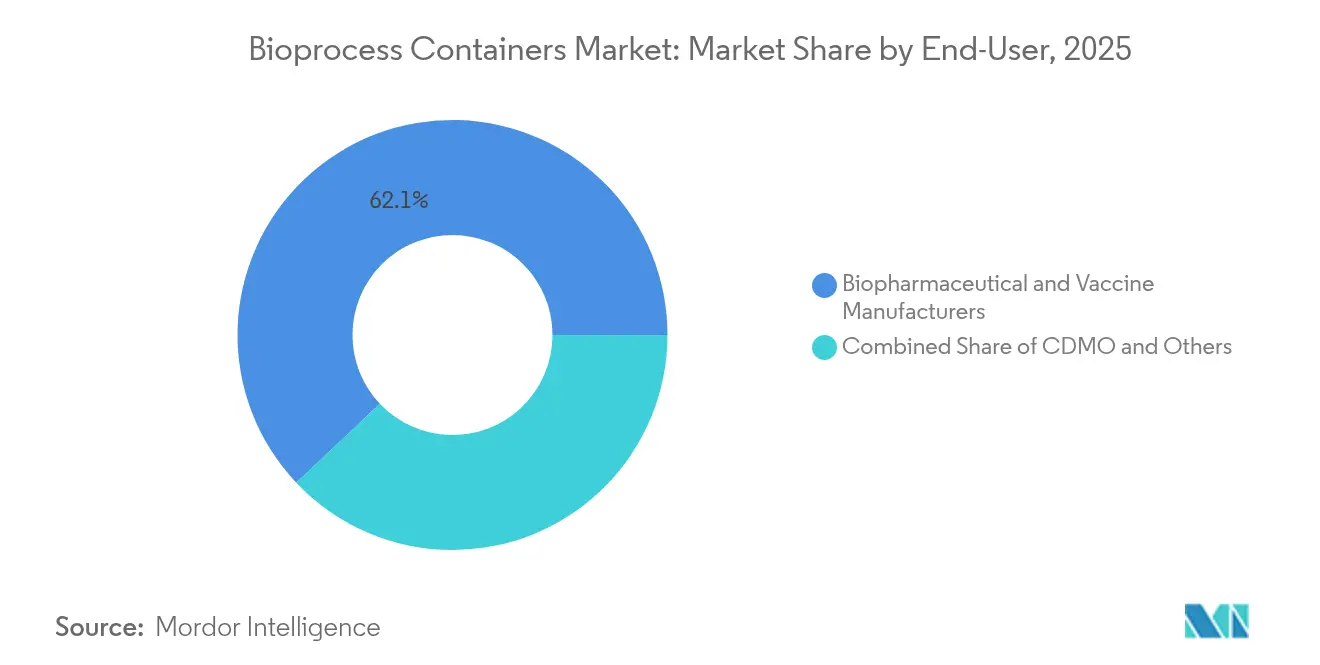
- By end-user, biopharmaceutical and vaccine manufacturers accounted for 62.05% revenue share in 2025; the CDMO segment is projected to record the fastest growth at 15.94% CAGR to 2031.
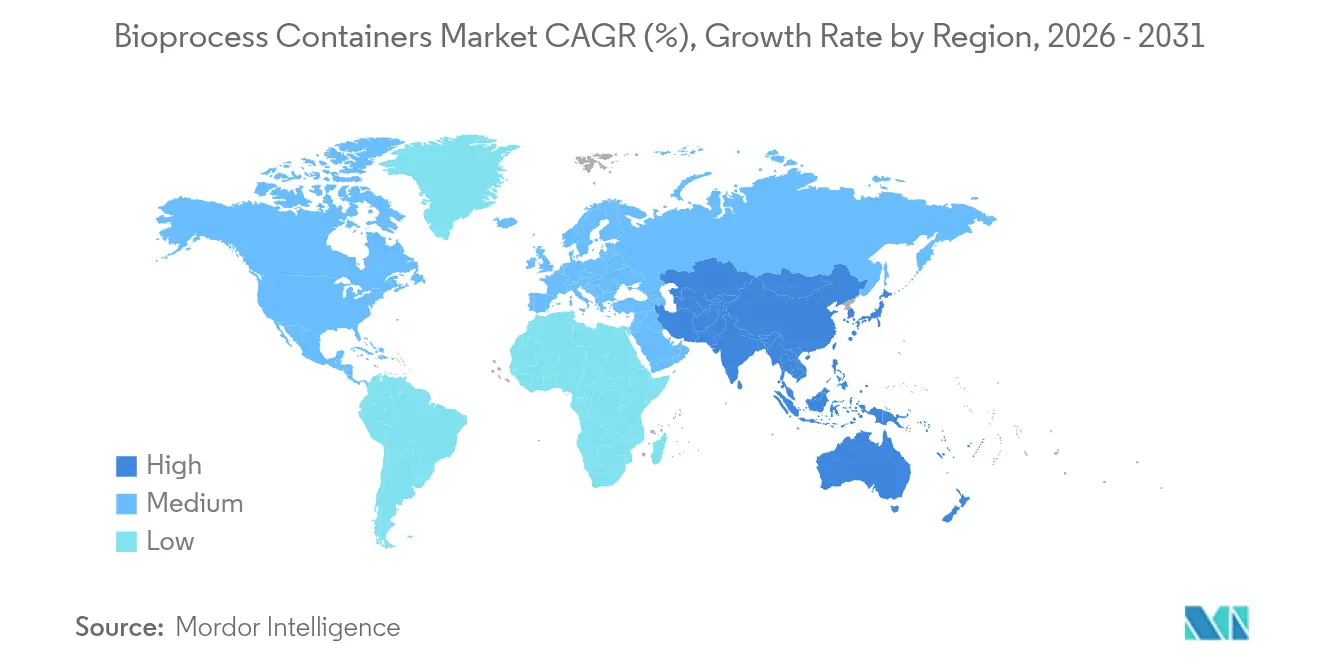
- By geography, North America led with 43.15% share in 2025, while Asia-Pacific is set to exhibit the highest regional CAGR at 16.2% through 2031.
Note: Market size and forecast figures in this report are generated using Mordor Intelligence’s proprietary estimation framework, updated with the latest available data and insights as of 2026.
Market Trends and Insights
Drivers Impact Analysis of Bioprocess Containers Market*
| Driver | (~) % Impact on CAGR Forecast | Geographic Relevance | Impact Timeline |
|---|---|---|---|
| Robust Biologics Pipeline Expansion | +2.8% | Global, with concentration in North America & EU | Long term (≥ 4 years) |
| Shift Toward Single-Use Platforms In CDMO | +2.1% | Global, accelerated in Asia-Pacific | Medium term (2-4 years) |
| Pandemic-Driven Vaccine Capacity Build-Out | +1.9% | Global, with emphasis on strategic regions | Short term (≤ 2 years) |
| Growing mRNA Therapeutics Fill-Finish Demand | +2.4% | North America & EU core, expanding to APAC | Medium term (2-4 years) |
| Adoption In Continuous Bioprocessing Skids | +1.8% | Global, with early adoption in North America & EU | Medium term (2-4 years) |
| ESG Push For Lower Energy & Water Footprints | +1.7% | Global, with stringent requirements in EU & North America | Long term (≥ 4 years) |
| Source: Mordor Intelligence | |||
Robust Biologics Pipeline Expansion
More than 7,000 biologic molecules were in clinical development during 2024, and the scale of this pipeline is pushing facilities to embrace disposable processing trains that avoid costly cleaning validations. The flexibility of the bioprocess containers market enables simultaneous campaigns for monoclonal antibodies, antibody-drug conjugates, and other complex modalities without cross-over risk. Samsung Biologics’ expansion to 784,000 L capacity in 2025 illustrates how leading CDMOs are investing in large volumes of disposable reactors to satisfy diversified client pipelines. Personalized and orphan therapeutics, often produced in small batches, particularly rely on single-use containers to remain economically viable. As these molecules progress to late-phase trials, sustained container demand is expected well into the next decade.
Shift Toward Single-Use Platforms in CDMO
Contract developers now redesign greenfield plants around disposable systems to shorten tech-transfer cycles and defer heavy capital spending. The BIOSECURE Act’s scrutiny of China-centric supply chains is prompting U.S. sponsors to pivot toward domestic or ally-based CDMOs equipped with flexible, single-use suites. Lonza’s USD 1.2 billion purchase of a Californian biologics site underscores the scale of investment being funneled into modular, disposable infrastructure. Rapid campaign changeovers, lower contamination risk, and simplified scale-out strategies mean CDMOs can secure multi-product contracts and improve asset utilization. Consequently, the bioprocess containers market is garnering incremental volumes from outsourced production pipelines previously dominated by fixed stainless-steel assets.
Pandemic-Driven Vaccine Capacity Build-Out
The race to supply COVID-19 vaccines validated single-use technology as the fastest route to market-ready capacity, a lesson now embedded in national preparedness roadmaps. Facilities erected in 2020-2022 continue operating for routine vaccines, complex viral vectors, and booster programs, maintaining container demand beyond acute pandemic needs. Fujifilm Diosynth’s USD 1.6 billion expansion in Denmark integrates fully disposable upstream and downstream modules, proving that governments and private partners see single-use as strategic infrastructure. Continuous bioprocessing combined with single-use reactors further amplifies throughput while retaining agility. This sustained capacity build directly enlarges the installed base driving recurring container consumption.
Growing mRNA Therapeutics Fill-Finish Demand
mRNA pipelines now span oncology, protein replacement, and gene-editing indications that require high-integrity fill-finish operations. Disposable bags and liners minimize nucleic-acid adsorption and particle load, critical for lipid-nanoparticle encapsulated products. ProBio’s 3-month GMP plasmid DNA service leverages pre-sterilized single-use vessels to guarantee turnaround times that stainless-steel lines cannot match. Investments by Merck KGaA in an advanced mRNA research center further cement long-term adoption of container formats tailored for small-volume, high-value batches. The bioprocess containers market therefore remains tightly coupled to the evolving messenger RNA manufacturing ecosystem.
Restraints Impact Analysis of Bioprocess Containers Market*
| Restraint | (~) % Impact on CAGR Forecast | Geographic Relevance | Impact Timeline |
|---|---|---|---|
| High Capital Outlay For GMP-Grade Polymer Films | -1.6% | Global, with acute impact in emerging markets | Medium term (2-4 years) |
| Leachables / Extractables Compliance Burden | -1.2% | Global, with stringent requirements in US & EU | Long term (≥ 4 years) |
| Supply-Chain Volatility In Pharma-Grade Resins | -1.1% | Global, with critical dependencies in Asia-Pacific | Short term (≤ 2 years) |
| End-Of-Life Waste-Management Liabilities | -0.9% | Global, with acute pressure in EU & emerging regulations in US | Long term (≥ 4 years) |
| Source: Mordor Intelligence | |||
High Capital Outlay For GMP-Grade Polymer Films
Manufacturing multilayer films that satisfy pharmaceutical GMP needs involves specialized extrusion lines, clean-room environments, and advanced analytical labs that elevate upfront cost by 40-60% relative to non-GMP plants. Supply concentration in a handful of resin producers exposes end-users to price premiums and allocation risk. Sartorius’ ISCC Plus certification for bio-based polymers shows additional investment now required to meet circularity targets alongside GMP obligations. Smaller regional suppliers face steep financial barriers, limiting geographic diversification and keeping film pricing elevated through mid-decade.
Leachables / Extractables Compliance Burden
Revisions to FDA and EMA guidance in 2024 heightened documentation and long-term stability test requirements for disposable assemblies [1]GMP Journal, “The GMP Update 2023/2024,” gmp-journal.com . Sophisticated mass-spectrometry protocols, toxicological risk assessments, and product-specific interaction studies can prolong container qualification by up to 18 months, delaying commercial deployment. High analytical workloads exacerbate talent shortages in polymer science and regulatory chemistry. Although large vendors offer standardized data packages, niche or custom bags still undergo lengthy validation, tempering overall adoption speed within the bioprocess containers market.
*Our forecasts treat driver/restraint impacts as directional, not additive. The impact forecasts reflect baseline growth, mix effects, and variable interactions.
Bioprocess Containers Market Segment Analysis
By Type of Container:
Scale Benefits of 3-D and Flexibility Gains of 2-D3-D bioprocess containers preserved 45.92% of bioprocess containers market share in 2025 on the strength of large-volume reactor applications where structural support and bag integrity are critical. They dominate fed-batch monoclonal antibody production, providing up to 6,000 L working volumes in modular, disposable format. Yet growth momentum tilts toward 2-D flat-panel bags, expanding at 15.23% CAGR as perfusion and continuous culture gain mainstream acceptance. These lower-profile vessels improve oxygen transfer rates and integrate seamlessly with automated rocking platforms, supporting intensified upstream workflows.
Advances in multilayer films and gamma-stable sensors are narrowing historical performance gaps between bag geometries. Corning’s HYPERStack family offers scalable surface area for adherent cultures while retaining single-use convenience, broadening 2-D utility into viral vector and vaccine production. Hybrid concepts that merge baffle structures from 3-D bags with monitoring ports from 2-D panels are beginning to surface, targeting cell-gene factories where space constraints and sterility assurance converge. Collectively, the container type landscape illustrates how the bioprocess containers market continues to innovate around both volume scalability and process-specific flexibility.


By Application:
Upstream Dominance With Downstream AccelerationUpstream unit operations held 54.56% of the bioprocess containers market size in 2025, affirming the long-proven compatibility between disposable bioreactors and mammalian cell culture. Eliminating CIP and SIP steps reduces turnaround by several hours per batch, translating into higher facility throughput and greater multiproduct agility. Nevertheless, downstream processing is now the fastest-rising niche, projected at 15.62% CAGR as single-use chromatography columns, buffer bags, and virus-inactivation tanks gain regulatory acceptance.
Continuous downstream trains using alternating-tangential-flow filtration and disposable polishing columns are allowing facilities to pair perfusion reactors with equally agile purification. Fill-finish suites for cell and gene therapies increasingly depend on pre-sterilized liners and manifolds that protect ultra-low-volume, high-value batches from environmental excursions. These developments confirm that the bioprocess containers market is migrating beyond its upstream comfort zone to support end-to-end disposable manufacturing.
By End-User:
Biopharma Core and CDMO UpswingBiopharmaceutical and vaccine producers commanded 62.05% revenue share in 2025, underpinning the centrality of owner-operated facilities to container demand. Big Pharma’s push toward modality diversity—spanning ADCs, fusion proteins, and viral vectors—elevates the need for multipurpose cleanrooms where single-use bags facilitate faster molecule turnover.
CDMOs, however, represent the expansion frontier, rising at 15.94% CAGR as outsourcing becomes a preferred risk-mitigation strategy. These service providers invest in standardized, flexible suites that accommodate fluctuating customer pipelines, making them avid consumers in the bioprocess containers industry. Emerging CDMOs targeting advanced therapies, such as plasmid DNA and mRNA, frequently build entire greenfield sites without fixed stainless assets, reinforcing a secular shift in procurement patterns.
Geography Analysis
North America Bioprocess Containers Market
North America retained 43.15% share of the bioprocess containers market in 2025, supported by entrenched biotech clusters in Boston, San Francisco, and Raleigh-Durham that prioritize rapid scale-up and stringent cGMP compliance. Federal incentives aimed at reshoring critical drug supply further energize regional adoption, while a robust venture capital ecosystem finances start-ups that default to disposable technology. Canada’s Montreal hub and Mexico’s emerging biologics corridor supply additional throughput, integrating regional supply chains.
APAC Bioprocess Containers Market
Asia-Pacific is forecast to post a 16.2% CAGR through 2031, the fastest regional trajectory in the bioprocess containers market. China’s commitment of USD 4.17 billion for biomanufacturing capacity in 2025, coupled with India’s aggressive push for global GMP accreditation, is unleashing a wave of facility construction that specifies single-use systems from inception. South Korea, Japan, and Singapore contribute advanced regulatory frameworks and high-tech talent pools, forming a diversified ecosystem that reduces dependence on Western supply routes.
EMEA and South America Bioprocess Containers Market
Europe remains a center of pharmaceutical excellence, with Germany, France, and the United Kingdom pioneering sustainable manufacturing models that dovetail with disposable platforms. Updated EMA GMP guidelines emphasizing closed operations encourage plants to retrofit stainless skids with bag-based alternatives. Government-supported green initiatives, such as reduced water-usage mandates, favor single-use over legacy CIP-intensive equipment. Meanwhile, Middle East & Africa and South America exhibit nascent but promising adoption rates as governments seek domestic vaccine sovereignty, positioning these territories as long-term growth reservoirs for the bioprocess containers market.

Regulatory Landscape
Bioprocess containers used in biomanufacturing generally sit within GMP requirements and container-closure expectations in major markets, with increasing attention on extractables and leachables, sterilization validation, and process-contact plastics documentation. A key anchor is USP General Chapter 665, which became effective in May 2026, reinforcing risk-based qualification for plastic components alongside established GMP documentation practices.
In Europe, harmonized requirements continue to evolve following Commission Implementing Decision 2024/817 issued in March 2024, updating sterilization and packaging standards. Globally, ICH Q3E reached Step 2 in July 2025, pointing to tighter alignment on E&L expectations across regions and strengthening the link between material data, risk assessments, and regulatory submissions.
Competitive Landscape
Moderate consolidation defines the current competitive hierarchy. Danaher’s USD 7.5 billion integration of Cytiva and Pall created a vertically aligned portfolio spanning filters, chromatography, and 2-D/3-D bags. Thermo Fisher Scientific and Sartorius AG follow similar one-stop strategies, combining analytics, automation, and consumables to embed themselves across customer workflows.
Material-science specialists such as Saint-Gobain Life Sciences and Entegris differentiate via high-purity polymer formulations, barrier-layer engineering, and advanced port weldability that resist extractables. These attributes resonate with cell and gene therapy producers seeking hyper-sterile, small-volume solutions, carving profitable niches outside the scope of large platform vendors.
Collaborative development agreements are proliferating, evidenced by Sartorius’ work with LFB Biomanufacturing on integrated cell-line development services [3]Sartorius, “First ISCC Plus Certifications Pave the Way for Renewable Plastics,” sartorius.com . Sustainability also drives competition: ISCC Plus-certified resin usage, recyclable packaging, and lower-carbon sterilization methods like X-ray or E-beam are becoming procurement criteria. Patent filings covering multilayer film architecture and real-time sensor-embedded bags underscore sustained R&D spend aimed at locking customers into proprietary ecosystems within the bioprocess containers market.
Bioprocess Containers Industry Leaders
Thermo Fisher Scientific Inc
Saint-Gobain S.A.
Lonza Group AG
Avantor Inc
Danaher Corporation (Cytiva)
- *Disclaimer: Major Players sorted in no particular order
Bioprocess Containers Market Companies Covered in this Report
- Thermo Fisher Scientific
- Sartorius
- Cytiva
- Saint-Gobain Life Sciences
- Merck KGaA (MilliporeSigma)
- Avantor Inc.
- Lonza Group
- Corning
- Entegris Inc.
- CellBios Healthcare & Life Sciences
- Cole-Parmer Instrument Co.
- Pall
- Parker Hannifin (Ratcheting Bags)
- Meissner Filtration Products
- Fujifilm Irvine Scientific
- Zhejiang Xinfuda Medical
- FlexBiosys
- Labplas Inc.
- MedInstill Technologies
- Biomass Sensor Singapore

Market Opportunities and Future Outlook
Standardization and readiness frameworks around single-use assemblies are clarifying pathways for multi-site adoption of bioprocess containers, particularly where facilities need interchangeable components, repeatable qualification, and faster changeovers across modalities. BioPhorum, in collaboration with the Bio-Process Systems Alliance (BPSA), published an updated Single-Use Assembly SUUR toolkit in March 2026, aligned with ASTM E3051-25, EU GMP Annex 1, and BPSA quality test matrices, which supports common language for specifications, supplier quality expectations, and risk assessments across end users and vendors.
Regulatory anchors also keep attention on E&L and contamination control, which is translating into higher demand for robust, auditable data packages and closed, prequalified designs. USP 665 became effective May 1, 2026, raising expectations for plastic component and system qualification and driving demand for film, connector, and assembly portfolios with strong documentation. Separately, on July 13, 2026, the US FDA published a proposed rule to establish a distributed manufacturing registration pathway for distributed manufacturing establishments, creating room for modular, closed single-use trains that can be deployed across smaller footprints. Asia capacity localization remains a practical supply lever for consumables, with Cytiva planning to commence filtration manufacturing at its South Korea Innovation Hub in 2026 to support regional demand.
Recent Industry Developments in Bioprocess Containers Market
- May 2026: Thermo Fisher Scientific introduced the Gibco CTS DynaXS Single-Use Bioreactor as part of an integrated platform aimed at scalable cell therapy manufacturing. The launch extends single-use capability for sensitive, closed processing workflows where contamination control and rapid changeover are central to clinical and commercial supply strategies.
- October 2025: Lonza received Swissmedic approval and achieved operational readiness for a new aseptic drug product filling line in Stein, Switzerland. The regulatory clearance and readiness milestone supports fill-finish capacity for biologics manufacturing programs that rely on validated sterile handling and compatible single-use fluid management components.
- November 2024: Lonza completed the first GMP batch at its next-generation mammalian manufacturing facility in Portsmouth, United States, using single-use systems. Bringing a new single-use-enabled site to GMP execution expands the installed base for disposable process-contact containers across upstream and downstream operations.


Bioprocess Containers Market Report Scope and Research Methodology
Market Definition and Coverage
This market is defined as revenues from disposable, flexible container systems used in bioprocessing and sterile media or buffer handling across biopharmaceutical and life science settings. It covers bags and related container formats used from development through commercial manufacturing, where single-use containment is the core value delivered.
Scope exclusions: Reusable stainless-steel vessels, general lab plasticware, and standalone bioprocess equipment that is not primarily a container are excluded from the market totals.
Segments Covered in This Report
- By Type of Container
- 2-D Bioprocess Containers
- 3-D Bioprocess Containers
- Others
- By Application
- Upstream Processing
- Downstream Processing
- Process Development / Scale-up
- Fill-Finish Operations
- By End-User
- Biopharmaceutical & Vaccine Manufacturers
- Contract Development & Manufacturing Organizations (CDMOs)
- Others
- By Geography
- North America
- United States
- Canada
- Mexico
- Europe
- Germany
- United Kingdom
- France
- Italy
- Spain
- Rest of Europe
- Asia-Pacific
- China
- Japan
- India
- Australia
- South Korea
- Rest of Asia-Pacific
- Middle East & Africa
- GCC
- South Africa
- Rest of Middle East & Africa
- South America
- Brazil
- Argentina
- Rest of South America
- North America
Data Sources, Market Sizing, and Validation
Desk Research
Desk research starts with building a demand context for biologics and single-use manufacturing, then narrowing to where containers are actually consumed in upstream and downstream workflows. For demand and compliance context, we referenced public sources such as US FDA databases for biologics approvals and manufacturing guidance, the US National Institutes of Health and PubMed for peer reviewed bioprocessing literature, and US International Trade Commission data for trade signals on relevant polymer films and components.
To ground the supply side, we also used company annual reports and investor presentations, earnings call transcripts accessed through a paid news and financials subscription, and selected patent databases to track material innovation and welding or connector related claims. Industry association pages and reputable life science press were used to confirm terminology, typical use steps, and adoption themes across upstream and downstream operations. The listed sources are illustrative, and we reviewed additional public and paid references to support data collection, validation, and clarifications.
Primary Interviews and Surveys
Primary inputs were taken from interviews and structured questionnaires with container suppliers, contract manufacturers, and end users running upstream and downstream lines, so assumptions on volumes and replacement cycles could be checked against how single-use workflows are executed in practice. Coverage was balanced across major biomanufacturing hubs in APAC, EMEA, and the Americas, and we revisited outlier inputs when the implied spend per batch or per facility did not match typical single-use containment usage patterns.
Distribution of primary research fieldwork respondents
| Company type | Respondent position | Region |
|---|---|---|
| Top tier: 27% | CXOs: 19% | APAC: 46% |
| Mid tier: 52% | Functional/Unit leaders: 22% | EMEA: 34% |
| Smaller Players: 21% | Managers: 59% | Americas: 20% |
Market-Sizing & Forecasting
Sizing was built using a top-down approach where biologics manufacturing activity is translated into a container demand pool using process step usage (media and buffer storage, transport, and single-use hold), then converted into value using typical price bands by container format. To keep the model grounded, we corroborated the totals with selective bottom-up checks, including supplier revenue splits disclosed in filings, sampled pricing discussed in procurement conversations, and channel feedback on mix shifts between 2D and 3D formats.
Key model inputs included biologics and vaccine manufacturing scale additions, the share of single-use adoption by process stage, average number of containers consumed per batch and per campaign, average working volumes and bag size mix, and polymer film and connector cost trends that influence average selling prices. For forecasting, we ran scenario analysis around expansion timing, with the base case guided by expectations on capacity utilization, outsourcing intensity, and regulatory-driven sterility requirements. Where direct volume indicators were not visible, gaps were handled through range-based assumptions that were stress tested in interviews and adjusted when the implied spend per facility looked unrealistic.
Data Validation & Update Cycle
Validation is done by triangulating the model against independent signals, including capacity expansion announcements, biomanufacturing utilization commentary, and observable shifts in single-use adoption. When variances were large, we investigated unit economics, re-ran currency conversions for the correct period, and re-contacted respondents when an assumption such as container replacement frequency appeared inconsistent with how operations were described.
Before sign-off, the work goes through multi-step analyst review to ensure inputs, calculations, and logic are consistent across regions and end users. The report is refreshed annually, and interim updates are made when material events occur, such as major capacity additions or meaningful changes in single-use supply availability. Right before delivery, a final review pass is completed so clients receive the latest updated view.
Mordor Intelligence's Bioprocess Containers Market Size Measured Against Other Published Estimates
Published market sizes for bioprocess containers often differ because counting rules are not the same across studies, even when the product name appears similar. The most common drivers are what is included as a container versus an accessory, which years are treated as the base, and how quickly price and adoption are assumed to move as new facilities come online.
In practice, the spread usually comes from scope and forecasting choices, such as whether connectors and tubing-heavy assemblies are fully rolled into container revenue, whether 2D and 3D products are valued at list prices or realized prices, and whether aggressive capacity expansion plans are treated as immediate demand. The table reflects these patterns, and the baseline is tied to disposable flexible containers used for bioprocessing and sterile media handling, with accessories counted only when they are part of the container system, a distinction applied by Mordor Intelligence.
Benchmark comparison
| Source | Market Size | Gaps in Research Methodology |
|---|---|---|
| Mordor Intelligence | USD 4.21 B (2025) | |
| Industry Research House A | USD 4.73 B (2025) | Uses a wider bundle that appears to roll in more accessory-heavy single-use assemblies alongside containers, which increases the 2025 value and also assumes faster price realization in the early years. |
| Industry Publisher B | USD 26.22 B (2033) | Reports a later-year endpoint with a high growth curve, and the press-style estimate does not clearly show how adoption timing, currency timing, and product boundaries were normalized across regions. |
Overall, the gap is explained more by what gets counted and how fast adoption and pricing are moved forward than by disagreements on demand direction. By keeping inputs traceable to process usage, facility activity, and realistic price bands, the resulting estimate stays repeatable and easier to reconcile when new capacity or mix changes show up.


Key Questions Answered in the Report
What is the current Bioprocess Containers Market size?
The market stands at USD 4.84 billion in 2026 and is forecast to grow at a 14.86% CAGR to USD 9.66 billion by 2031.
Why are CDMOs important to future demand?
CDMOs outsource production for multiple sponsors, and their investment in fully disposable suites is driving a 15.94% CAGR segment growth to 2031.
Which region has the biggest share in Bioprocess Containers Market?
In 2025, the North America accounts for the largest market share in Bioprocess Containers Market.
Which container type currently dominates installations?
3-D bags lead with 45.92% share in 2025, although 2-D formats are growing faster at 15.23% CAGR.
Page last updated on:


 Your data is secure and never sold or shared.


