
Bioplastics Packaging Market Size and Share
Market Overview
| Study Period | 2020 - 2031 |
|---|---|
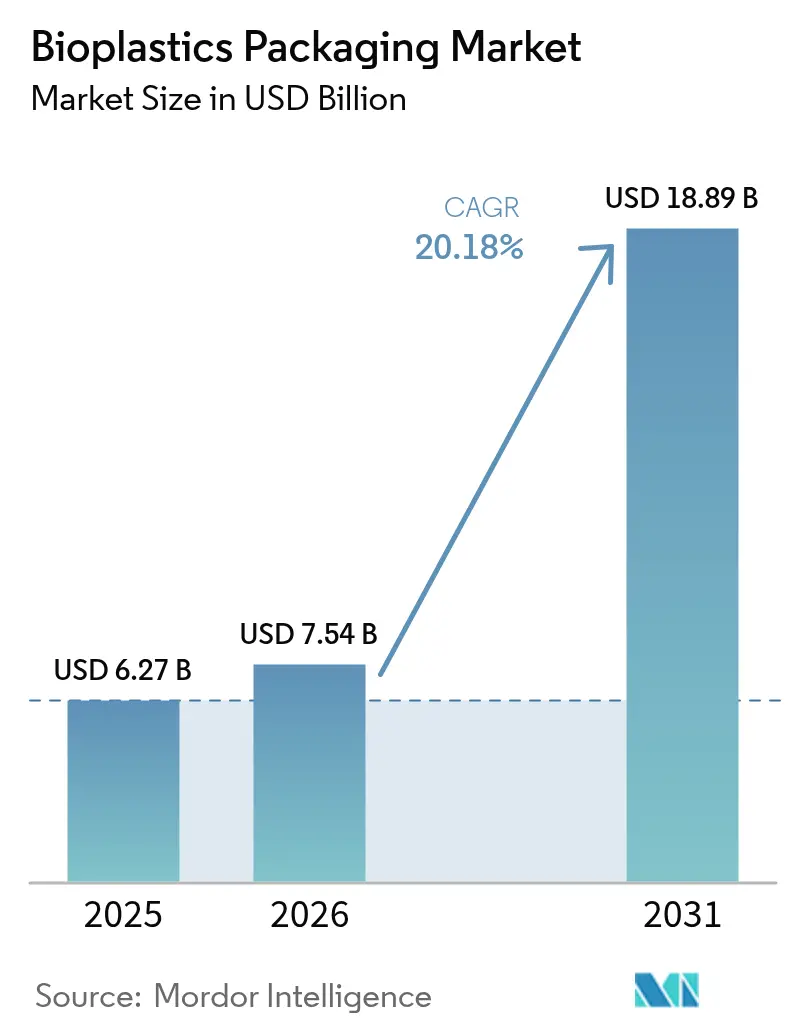
| Market Size (2026) | USD 7.54 Billion |
| Market Size (2031) | USD 18.89 Billion |
| Growth Rate (2026 - 2031) | 20.18 % |
| Fastest Growing Market | Asia Pacific |
| Largest Market | Europe |
| Market Concentration | Medium |
Major Players *Disclaimer: Major Players sorted in no particular order Image © Mordor Intelligence. Reuse requires attribution under CC BY 4.0. | |
Bioplastics Packaging Market Analysis by Mordor Intelligence
The bioplastic packaging market size is expected to grow from USD 6.27 billion in 2025 to USD 7.54 billion in 2026 and is forecast to reach USD 18.89 billion by 2031 at 20.18% CAGR over 2026-2031. Rising Extended Producer Responsibility (EPR) fees, cost-efficient bio-feedstock processing, and consumer preference for low-carbon materials are redefining supplier economics across the bioplastic packaging market. New European Union recycling targets, India’s traceability mandate, and China’s express-parcel standards are synchronizing regulatory timetables, while large PLA and Bio-PET capacity additions in the United Arab Emirates and Thailand remove legacy supply constraints. Global food-service chains and luxury personal care brands now treat bioplastic formats as mainstream, accelerating innovation in coatings, multilayer films, and barrier performance. These converging forces confirm a structural shift in packaging material choice that favors renewable feedstocks over fossil-based polymers.
Key Report Takeaways
- By material type, Bio-PET led with 39.10% of bioplastic packaging market share in 2025, whereas PHA is forecast to grow at 21.65% CAGR through 2031
- By product type, flexible packaging held 57.62% revenue share in 2025 and is set to expand at a 21.05% CAGR to 2031
- By end-use industry, food and beverage accounted for 29.25% of the bioplastic packaging market size in 2025; personal care and cosmetics is projected to post a 20.58% CAGR between 2026-2031
- By distribution channel, direct sales captured 59.55% share of the bioplastic packaging market in 2025, while indirect channels record the fastest 20.74% CAGR through 2031
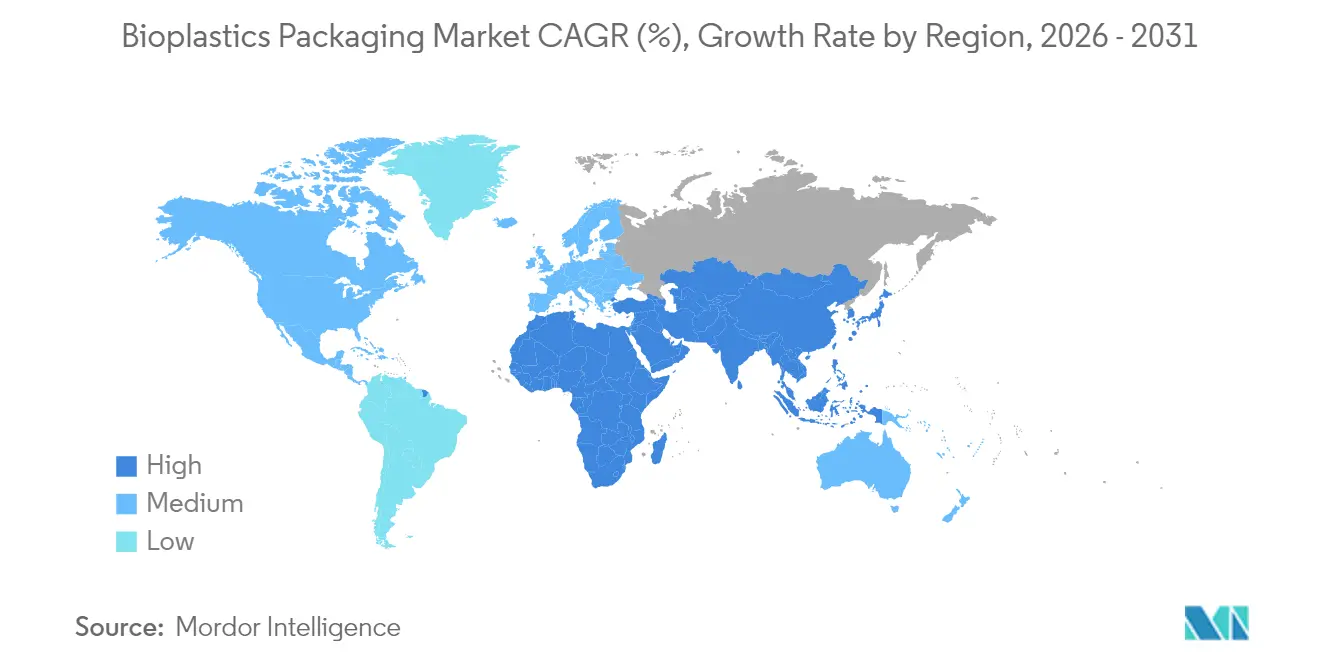
- By geography, Europe dominated with 37.95% share in 2025, whereas Asia-Pacific is the fastest-growing region at 21.93% CAGR to 2031
Note: Market size and forecast figures in this report are generated using Mordor Intelligence’s proprietary estimation framework, updated with the latest available data and insights as of 2026.
Global Bioplastics Packaging Market Trends and Insights
Drivers Impact Analysis*
| Driver | (~) % Impact on CAGR Forecast | Geographic Relevance | Impact Timeline |
|---|---|---|---|
| Global EPR Legislation Driving Bio-Based Packaging Adoption | +4.2% | Global, with early implementation in EU, North America, and APAC | Medium term (2-4 years) |
| Demand for bioplastic packaging surges as multinational food-service chains embrace compostable packaging | +3.8% | Global, concentrated in North America and Europe | Short term (≤ 2 years) |
| Asia-Pacific Policy Shifts Creating Momentum for Bioplastic Packaging | +3.1% | APAC core, spill-over to MEA | Medium term (2-4 years) |
| Expansion of global Bio-PET and PLA production is lowering cost barriers to adoption | +2.9% | Global, with major capacity additions in UAE, Thailand, and India | Long term (≥ 4 years) |
| Increasing adoption of bioplastic packaging among Luxury and personal care brands | +2.3% | North America & EU, expanding to APAC | Medium term (2-4 years) |
| Government Investment in Composting Infrastructure Accelerating Downstream Adoption | +1.9% | North America & EU, selective APAC markets | Long term (≥ 4 years) |
| Source: Mordor Intelligence | |||


Global EPR legislation driving bio-based packaging adoption
Mandatory EPR schemes in California, the European Union, and Kenya internalize end-of-life costs, creating direct financial incentives to switch from conventional plastics to renewable alternatives. [1]California Legislative Information, “Senate Bill No. 54 - Plastic pollution producer responsibility,” leginfo.legislature.ca.gov Producers now face differentiated fees based on recyclability, compostability, and recycled content, making bioplastic materials more cost-competitive in the bioplastic packaging market. Harmonized reporting deadlines beginning March 2025 simplify cross-border compliance, encouraging multinational brand owners to standardize sustainable formats. Fee modulation policies that penalize non-recyclable substrates further enlarge the addressable bioplastic packaging market. As regulatory timelines converge with the start-up of large PLA plants in Thailand and the UAE, predictable supply and lower prices reinforce adoption momentum.
Demand surge from multinational food-service chains
Leading restaurant brands accelerated trials and roll-outs of compostable formats, catalyzing new volume streams in the bioplastic packaging market. McDonald’s cups now use a 50% biopolymer blend, while Starbucks has extended molded-fiber cold-cup pilots across several US states. These firms leverage procurement scale to compress per-unit resin costs and validate consumer acceptance. Operational benefits—simpler sorting, reduced landfill fees, and brand equity gains—reinforce repeat purchasing. Their rapid adoption signals to converters that bioplastic stock-keeping units can match the throughput of conventional substrates without retooling bottlenecks.
Asia-Pacific policy shifts creating momentum
India’s QR code traceability requirement beginning July 2025 and China’s GB 43352-2023 standard impose tighter controls on heavy metals and specific additives. Coupled with Japanese procurement mandates favoring bamboo and other bio-based inputs, these rules promote regional manufacturing clusters supplying the global bioplastic packaging market. Government capital subsidies, such as India’s 50% investment grant for bioplastic projects, compress payback periods on new polymer assets. Accelerated policy harmonization reduces regulatory risk, supports trade flows, and encourages multinational converters to localize flexible packaging lines closer to feedstock sources.
Capacity expansion in Bio-PET and PLA
Sulzer’s process technology underpins Emirates Biotech’s 120,000 tpa PLA mega-site, while NatureWorks secured USD 350 million to add 75,000 tpa in Thailand. Braskem boosted biopolymer output 30% in Brazil, and Toray will introduce biomass-based ABS in 2025. The resulting scale economies could narrow the historical USD 300-500/t cost gap versus petroleum PET, eroding a key barrier for the bioplastic packaging market. Geographic diversification also mitigates freight volatility and geopolitical supply risks, providing brand owners with multi-regional sourcing options to manage inventory.
Restraints Impact Analysis*
| Restraint | (~) % Impact on CAGR Forecast | Geographic Relevance | Impact Timeline |
|---|---|---|---|
| Chronic shortage of bio-based feedstock owing to competing biofuel demand | -2.8% | Global, particularly acute in Brazil, USA, and EU | Long term (≥ 4 years) |
| Inconsistent industrial composting infrastructure hindering end-of-life claims | -2.1% | Global, with infrastructure gaps in developing markets | Medium term (2-4 years) |
| Functional performance limitations in high-temperature applications | -1.6% | Global, affecting food packaging and industrial applications | Medium term (2-4 years) |
| Source: Mordor Intelligence | |||
Chronic shortage of bio-based feedstock
Record ethanol runs in Brazil and rising US Renewable Fuel Standard volumes intensify feedstock competition, inflating corn and sugar prices that underpin PLA and Bio-PET production. Biofuel producers often win allocation battles thanks to legislated demand quotas and tax credits. While NatureWorks explores cassava and lignocellulosic routes, feedstock scarcity remains a structural headwind to the bioplastic packaging market until non-crop inputs reach scale.
Inconsistent industrial composting infrastructure
Only 185 US composters currently accept certified packaging, and many EU facilities fail to meet EN 13432 temperature thresholds. Jurisdictional inconsistencies undermine consumer trust and raise producer liability. California’s AB 1201 will enforce tighter compostability labeling in 2026, compelling converters to verify facility accessibility before mass launches. Without synchronized infrastructure upgrades, the bioplastic packaging market risks perception gaps between environmental claims and actual end-of-life outcomes.
*Our forecasts treat driver/restraint impacts as directional, not additive. The impact forecasts reflect baseline growth, mix effects, and variable interactions.
Segment Analysis
By Material Type: Bio-PET dominance faces PHA innovation
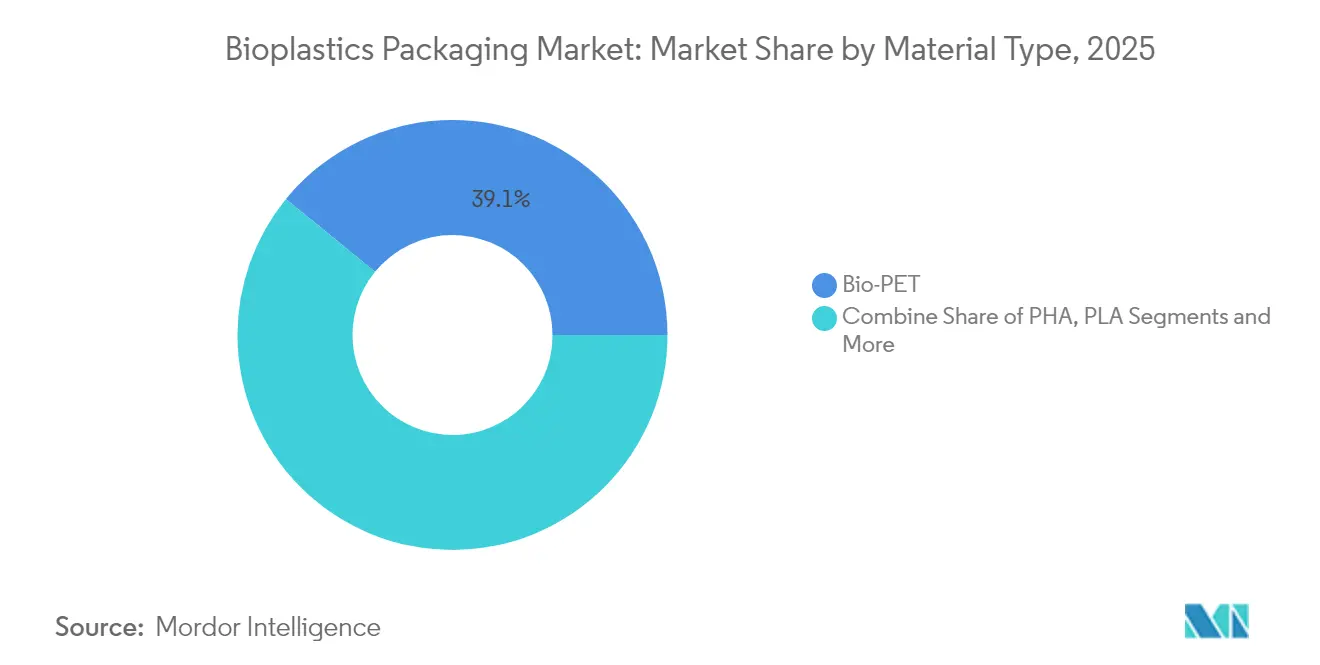
Bio-PET held 39.10% share of the bioplastic packaging market in 2025 as producers leveraged existing PET recycling streams for rapid drop-in substitution. The segment benefits from biomass-based PTA supply chains certified under ISCC PLUS. Coca-Cola’s EUR 180 million European transition illustrates how large buyers exert downward pressure on resin premiums, supporting stable bioplastic packaging market size expansion. PHA, while only a niche share today, is forecast at 21.65% CAGR as consolidation stabilizes and specialty grades target marine-degradable applications.
Starch blends remain the volume leader among biodegradable polymers, with maize, potato, and cassava feedstocks offering price hedging flexibility. PLA capacity from Thailand and the UAE boosts regional supply, while PBAT and PBS gain traction in films requiring enhanced toughness at lower processing temperatures. Dual-sourcing strategies protect converters from resin volatility, keeping the bioplastic packaging market resilient to price shocks.


By Product Type: Flexible packaging innovation drives growth
Flexible formats commanded 57.62% of 2025 revenue and are projected to lead at a 21.05% CAGR. Films, wraps, and pouches align well with the mechanical and barrier properties of PLA and Bio-PE. Nestlé’s CHF 120 million European retrofit shows the capital needed to switch over but also demonstrates consumer acceptance premiums that offset higher resin prices. Accredo’s sugarcane-based pouch series underscores carbon-reduction gains that drive procurement decisions.
Rigid containers lag due to higher heat-deflection standards, yet multilayer PLA-cellulose structures now approach oxygen barrier levels suitable for ambient sauces. Technology spillover from flexible to rigid applications is narrowing the performance delta, opening new revenue pockets inside the broader bioplastic packaging market.
By End-Use Industry: Food sector leadership enables personal care growth
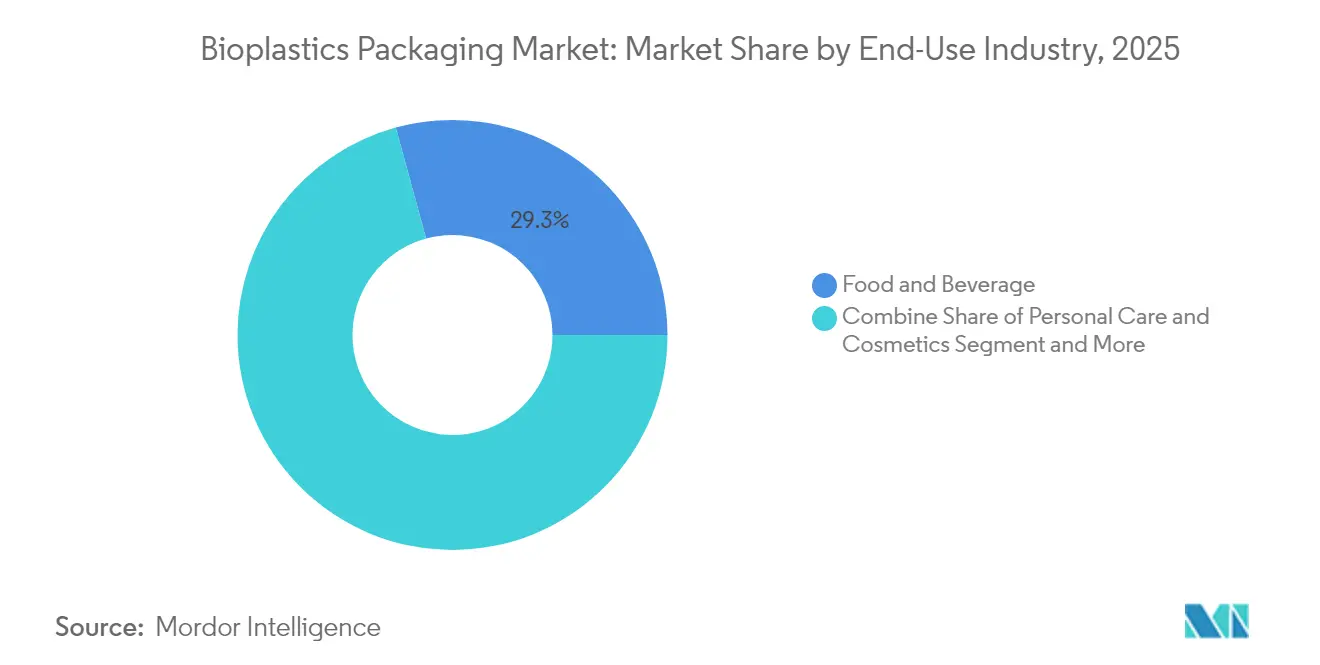
Food and beverage accounted for 29.25% revenue in 2025, underpinned by quick-service restaurant conversions and retailer own-label initiatives. Compostable serviceware simplifies waste sorting in arenas and campuses, adding high-volume outlets to the bioplastic packaging market. Personal care and cosmetics are set to post a 20.58% CAGR as L’Oréal, Estée Lauder, and Unilever channel more than USD 1 billion toward sustainable container redesigns.
Pharmaceutical use cases emerge where controlled degradation offers tamper evidence and reduced residue risk. Luxury beauty brands, producing an estimated 120 billion units annually, supply premium margins that underwrite R&D for color stability and fragrance-barrier enhancements, reinforcing long-term growth in the bioplastic packaging market.
By Distribution Channel: Direct sales efficiency supports indirect growth
Direct sales retained 59.55% share because converters require hands-on technical guidance to tailor resin blends and process settings. Amcor’s USD 45 million global partner-training spend illustrates the consultative workload behind every tonne sold. As quality grades standardize, indirect distributors are scaling at 20.74% CAGR, expanding access in secondary cities.
Digital ordering platforms now quote live carbon-footprint dashboards, allowing small brands to benchmark savings instantly. Tiered pricing still favors high-volume direct deals, yet streamlined e-commerce portals bridge the gap for emerging labels, broadening the addressable bioplastic packaging market.
Geography Analysis
Europe remained the largest regional contributor with 37.95% of the bioplastic packaging market in 2025, driven by the Packaging and Packaging Waste Regulation that mandates universal recyclability by 2030 and bans PFAS in food contact articles. Germany’s VerpackG imposed EUR 2.1 billion EPR fees in 2024, prompting brand owners to select bio-based formats that earn 30% fee discounts. Southern Europe witnesses swift adoption in fresh-produce films, while Northern markets focus on rigid yoghurt cups that meet cold-chain specifications.
Asia-Pacific is the fastest-growing region, projected at 21.93% CAGR through 2031. India’s traceability rule, China’s GB 43352-2023, and Japanese government procurement of biodegradable alternatives align policy levers with investment stimuli. NatureWorks and Balrampur Chini Mills supply domestic converters, cutting freight costs and hedging against currency swings. Proximity to agricultural feedstocks positions ASEAN nations as strategic export bases to high-demand EU markets, amplifying the bioplastic packaging market size in the region.
North America shows robust momentum as California, Oregon, and Colorado finalize EPR fee schedules that escalate annually. Food-service pilot programs at McDonald’s and Starbucks accelerate downstream converter qualifications. Federal grants worth USD 75 million for composting build-outs signal impending infrastructure parity, a critical enabler for bioplastic packaging market penetration beyond coastal cities. Canada and Mexico adopt harmonized labeling to protect cross-border supply chains, ensuring regulatory clarity for integrated brand roll-outs.

Regulatory Landscape
Regulation timelines are tightening around compostability, traceability, and food-contact compliance, shaping material choices in bioplastic packaging. In the European Union, the Packaging and Packaging Waste Regulation, Regulation (EU) 2025/40, entered into force on 11 February 2025 and applies from 12 August 2026, creating an enforceable compliance clock for packaging converters and brand owners selling into Europe.
PPWR also hardwires compostability requirements for specific applications, including fruit and vegetable labels, tea bags, and coffee pods, which must be industrially compostable by 12 February 2028. The European Commission is tasked to request, by 12 February 2026, the development of new EU-wide harmonized standards for compostability (Article 9(6)), while ISO activity such as ISO 15270-5:2025 provides additional guidance for plastics waste recovery via organic/biological recycling. In North America, US FDA Food Contact Substance Notifications continue to define what polymer chemistries can be used in food-contact packaging, with effective notifications in 2025-2026 supporting the market’s shift to compliant compostable and bio-based resins.
Value Chain Analysis
The bioplastics packaging value chain starts with agricultural and bio-based feedstocks, including corn, sugarcane, and starch inputs, and proceeds through monomer and bio-resin production (PLA, Bio-PET, PBAT, PBS, PHA, and starch blends), then into compounding and conversion into films, pouches, rigid containers, and serviceware. Converters and brand owners sit downstream, supported by certification and testing bodies that validate compostability and end-of-life claims, as well as waste-management stakeholders (collection, sorting, recycling, and industrial composting) that determine real-world disposal outcomes.
Bottlenecks are most visible around feedstock variability and regional logistics, where bio-based supply chains remain more localized than petrochemical polymer networks, and around end-of-life infrastructure gaps that limit where certified packaging can be processed. Regulatory anchors such as the EU PPWR (Regulation (EU) 2025/40) create clearer demand signals for certified industrially compostable formats in defined packaging types, increasing coordination across resin producers, converters, and certifiers. The chain is also adding digital traceability layers, including pilots that use blockchain to improve traceability and reduce transaction friction between feedstock aggregators and resin producers, supporting claims management and compliance reporting across markets.
Competitive Landscape
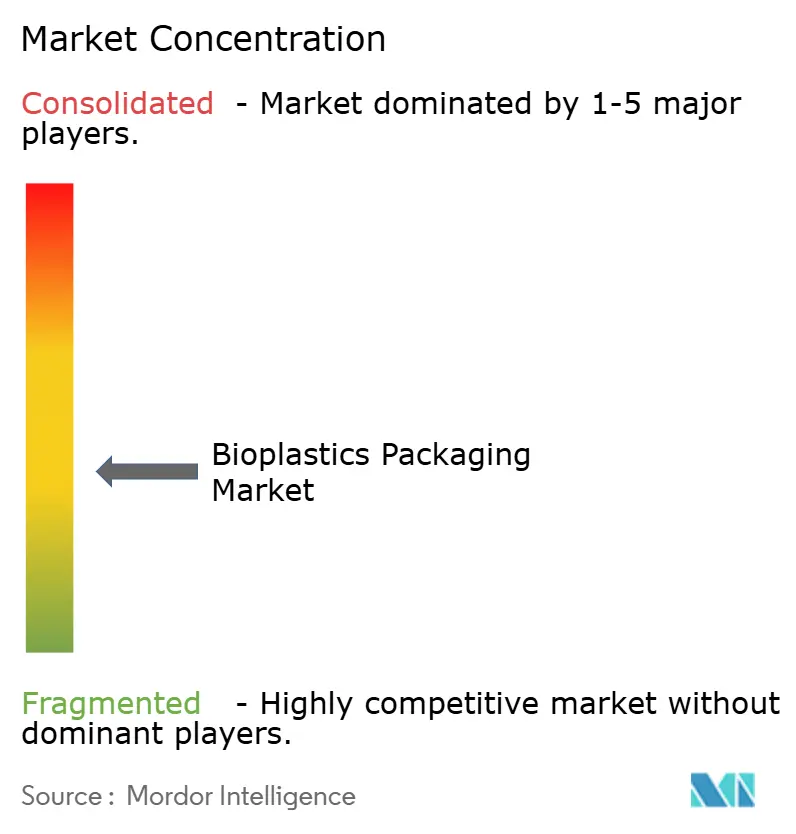
The competitive field remains moderately fragmented. Global packaging majors integrate renewable substrates into existing lines while specialized bioplastic start-ups chase property breakthroughs. Amcor surpassed its interim target by sourcing more than 10% post-consumer resin, demonstrating how incumbents convert scale into sustainability milestones. [3] Amcor, “Sustainability Report 2024,” amcor.com Novolex’s USD 6.7 billion purchase of Pactiv Evergreen extends channel breadth to 39,000 SKUs, giving the combined firm powerful bargaining leverage with retailers.
Technology alliances dominate strategy. Amcor’s partnership with Bloom Biorenewables injects plant-waste chemistry into PET supply, while Toray and Idemitsu collaborate on biomass ABS to diversify away from sugar feedstocks . Patent filings climbed to 847 in 2024, with 34% focused on barrier improvement. Venture funding concentrates on enzymes that accelerate composting and catalysts that cut polymerization energy by 30%, hinting at a future cost step-change across the bioplastic packaging market.
Regulatory compliance deadlines from 2025 onward encourage capacity pre-booking, tightening near-term spot supply despite new plant announcements. Consequently, suppliers that guarantee on-spec resin and deliver life-cycle data win multi-year contracts. Market participants capable of backward-integrating into feedstock or forward-integrating into collection services establish defensible moats as the bioplastic packaging market pivots from niche to mainstream.
Bioplastics Packaging Industry Leaders
BASF SE (Badische Anilin- und Soda-Fabrik)
TAGHLEEF INDUSTRIES GROUP
Mitsubishi Chemical Corporation
Alpagro Packaging
Amcor Plc
- *Disclaimer: Major Players sorted in no particular order

Market Opportunities and Future Outlook
A near-term opportunity is emerging where regulation-driven compliance requirements and new capacity additions coincide. The EU PPWR (Regulation (EU) 2025/40) applies from 12 August 2026 and includes application-specific industrial compostability requirements, including fruit and vegetable labels, tea bags, and coffee pods by 12 February 2028. This expands demand for certified compostable films, laminations, and molded formats that can meet both performance and labeling obligations. At the same time, the European Commission commitment to request EU-wide standardization work on home compostability by 12 February 2026 (Article 9(6)) creates whitespace for material suppliers and converters to design products aligned to upcoming harmonized test methods and certification pathways.
On the supply side, new production assets and feedstock proximity are changing sourcing options for global packaging manufacturers. NatureWorks launched a second fully integrated PLA production facility at the Nakhon Sawan Biocomplex in Thailand in July 2026, bringing 75,000 tonnes per year capacity and using locally sourced sugarcane feedstock, which strengthens Asia-based supply for converters serving both regional demand and export-oriented packaging programs. With packaging representing 41.3% (0.95 million tonnes) of global bioplastics production capacities in 2025, converters and brand owners have room to expand from early pilots into larger-format portfolios where compliance, traceability, and end-of-life proof points are required alongside scale and cost control.
Recent Industry Developments
- May 2026: BASF initiated a collaboration with UPM Specialty Materials to develop recyclable, fiber-based packaging structures using Joncryl HPB barrier technology resins. The effort targets performance upgrades in fiber packaging while maintaining recyclability, widening substitution pathways beyond conventional plastic laminates in food and consumer goods applications.
- April 2026: BASF launched new grades in its ecovio certified compostable portfolio aimed at flexible barrier packaging applications. The update supports converters that need compostable structures with stronger barrier performance, aligning product design with stricter labeling and end-of-life scrutiny in key markets.
- May 2025: BASF announced a partnership with Metpack focused on paper packaging solutions enabled by barrier technologies. The collaboration strengthens the competitive set of bio-based and fiber-led packaging options that brand owners can adopt when redesigning packs around recycling and sustainability requirements.


Research Methodology Framework and Report Scope
Market Definition and Coverage
This market covers packaging formats made using bioplastic materials, counted in revenue terms, where the polymer is bio-based, biodegradable, or both, and is used in rigid or flexible packaging across major end-use industries.
Scope exclusions: Excluded are conventional fossil-based plastics with no bio-content and non-packaging uses of bioplastics (such as durable components outside packaging).
Segmentation Overview
- By Material Type
- Non-Biodegradable Bioplastics
- Bio-PET
- Bio-PE
- Other Non-Biodegradable Bioplastics
- Biodegradable Bioplastics
- Starch Blends
- Polylactic Acid (PLA)
- Poly(Butylene Adipate-co-Terephthalate) (PBAT)
- Polybutylene Succinate (PBS)
- Polyhydroxyalkanoates (PHA)
- Other Biodegradable Bioplastics
- Non-Biodegradable Bioplastics
- By Product Type
- Rigid Packaging
- Bottles and Jars
- Trays and Containers
- Other Rigid Packaging
- Flexible Packaging
- Films and Wraps
- Pouches and Bags
- Other Flexible Packaging
- Rigid Packaging
- By End-Use Industry
- Food
- Beverages
- Pharmaceuticals
- Personal Care and Cosmetics
- Other End - Use Industry
- By Distribution Channel
- Direct Sales
- Indirect Sales
- By Geography
- North America
- United States
- Canada
- Mexico
- Europe
- Germany
- United Kingdom
- France
- Italy
- Spain
- Russia
- Rest of Europe
- Asia-Pacific
- China
- India
- Japan
- South Korea
- Australia and New Zealand
- Rest of Asia-Pacific
- Middle East and Africa
- Middle East
- United Arab Emirates
- Saudi Arabia
- Turkey
- Rest of Middle East
- Africa
- South Africa
- Nigeria
- Egypt
- Rest of Africa
- Middle East
- South America
- Brazil
- Argentina
- Rest of South America
- North America
Data Sources, Market Sizing, and Validation
Desk Research
Desk work starts by building a practical view of supply, demand, and policy signals that influence bioplastics packaging adoption. We refer to public sources such as government environment and packaging-waste statistics, customs and trade data for resin and packaging-related flows, and trade association publications that track compostability and recycling infrastructure progress.
It is also supported using peer-reviewed journals for polymer performance and end-of-life pathways, patent databases to understand where new material formulations are going, and company filings and investor presentations to confirm capacity additions and product focus. In parallel, a paid subscription for company financials and news helps us time-check plant startups, expansions, and pricing commentary. These desk sources are illustrative only, and many other public references were also reviewed for data collection, validation, and clarification.
Primary Interviews and Surveys
Primary inputs come from interviews and structured surveys with resin producers, packaging converters, distributors, and large packaging buyers, which helps us validate what is actually being used and paid for in different formats. For a global market, discussions are balanced across APAC, EMEA, and the Americas so regional policy, composting access, and brand adoption plans are reflected, and then final assumptions are rechecked when desk signals and field feedback do not match.
Distribution of primary research fieldwork respondents
| Company type | Respondent position | Region |
|---|---|---|
| Top tier: 25% | CXOs: 13% | APAC: 42% |
| Mid tier: 60% | Functional/Unit leaders: 28% | EMEA: 34% |
| Smaller Players: 15% | Managers: 59% | Americas: 24% |
Market-Sizing & Forecasting
For sizing, we use a top-down approach where packaging demand pools are reconstructed from packaging output and polymer usage signals, and then filtered to the share that is met by bioplastic materials in each key end-use. Once the demand pool is formed, it is translated into value using price ranges that are consistent with the material mix and the observed premium versus conventional plastics.
To keep the totals realistic, results are cross-checked with selective bottom-up approximations, such as sampling converter volumes by packaging format and applying a reasonable average selling price by polymer family, followed by channel checks on availability and lead times. Variables used as model inputs include the split of rigid versus flexible packaging, adoption levels in food, beverages, pharmaceuticals, and personal care, regional policy pressure around single-use plastics, composting and recycling infrastructure readiness, and feedstock and biopolymer price movement that influences substitution decisions. Forecasting relies on scenario analysis supported by expert consensus, since regulation timing and brand commitments can shift demand quickly, and any gaps in country-level details are handled through regional ratios that are revalidated in interviews before being rolled up.
Data Validation & Update Cycle
Outputs are validated by comparing implied volumes and prices against independent signals, such as capacity changes, trade flows, and end-use packaging activity, and then revisiting assumptions where variances look unusual. Checks are performed at multiple levels, including regional totals, material mix consistency, and year-over-year growth logic, before internal review sign-off.
The model is refreshed on an annual cycle, and interim updates are triggered when major policy changes, large capacity announcements, or sharp feedstock price swings are observed. Before a deliverable is finalized, analysts run a fresh pass on the inputs and reconnect with select respondents if a new event could materially affect the near-term view, so clients receive a current and defensible estimate.
Mordor Intelligence's Bioplastics Packaging Market Estimate Compared With Other Published Estimates
Published market sizes for bioplastics packaging can differ a lot, even when they look like they are describing the same space. The gaps usually come from what is counted as bioplastic packaging, which year is treated as the base, and how price and adoption are projected as regulations and brand commitments evolve.
The main gap comes from whether drop-in bio-based plastics and compostable biopolymers are both counted across rigid and flexible packaging, where Mordor Intelligence includes defined bioplastic material types for packaging and then ties the value build-up to end-use adoption levels and polymer-linked pricing by region. Differences also show up when a study uses an earlier base year (like 2024) with a broader packaging scope, or when long-range forecasts smooth out short-term policy and capacity step changes through a single growth rate.
Benchmark comparison
| Source | Market Size | Gaps in Research Methodology |
|---|---|---|
| Mordor Intelligence | USD 7.54 B (2026) | |
| Global Consultancy A | USD 19.55 B (2024) | Uses an earlier base year with a broader revenue frame for bioplastic packaging, which can inflate totals when product and material boundaries are looser and pricing is not anchored to a 2026 material mix. |
| Industry Publisher B | USD 14.10 B (2025) | Counts a wider set of bio-based and biodegradable packaging materials in 2025 and applies a longer forecast window, where adoption and price premiums may be smoothed without the same stepwise checks for capacity ramps and regional policy timing. |
The spread in the table is mostly explained by base-year choice, the exact definition of what qualifies as bioplastics packaging, and how price premiums are carried forward. By keeping the sizing tied to clear end-use adoption signals and a practical price build that is rechecked in interviews, we can present a number that is easier to trace and repeat over time as inputs change.


Key Questions Answered in the Report
What is the current size of the bioplastic packaging market?
The bioplastic packaging market reached USD 7.54 billion in 2026 and is set to climb to USD 18.89 billion by 2031.
Which region leads the bioplastic packaging market?
Europe leads with a 37.95% share in 2025, driven by stringent EU recycling and content mandates.
Which material type dominates the market today?
Bio-PET dominates with a 39.10% share thanks to compatibility with existing PET recycling infrastructure.
Why are flexible formats growing fastest?
Flexible packaging aligns well with PLA and Bio-PE material properties and supports quick-service and e-commerce applications, driving a 21.05% CAGR through 2031.
What is the biggest restraint to wider adoption?
Feedstock competition from biofuels limits bio-based polymer supply, subtracting 2.8 percentage points from the forecast CAGR.
Page last updated on:


 Your data is secure and never sold or shared.


