
Bionic Eyes Market Size and Share
Market Overview
| Study Period | 2020 - 2031 |
|---|---|
| Market Size (2026) | USD 406.12 Million |
| Market Size (2031) | USD 766.1 Million |
| Growth Rate (2026 - 2031) | 13.52 % |
| Fastest Growing Market | Asia Pacific |
| Largest Market | North America |
| Market Concentration | Medium |
Major Players *Disclaimer: Major Players sorted in no particular order Image © Mordor Intelligence. Reuse requires attribution under CC BY 4.0. | |
Bionic Eyes Market Analysis by Mordor Intelligence
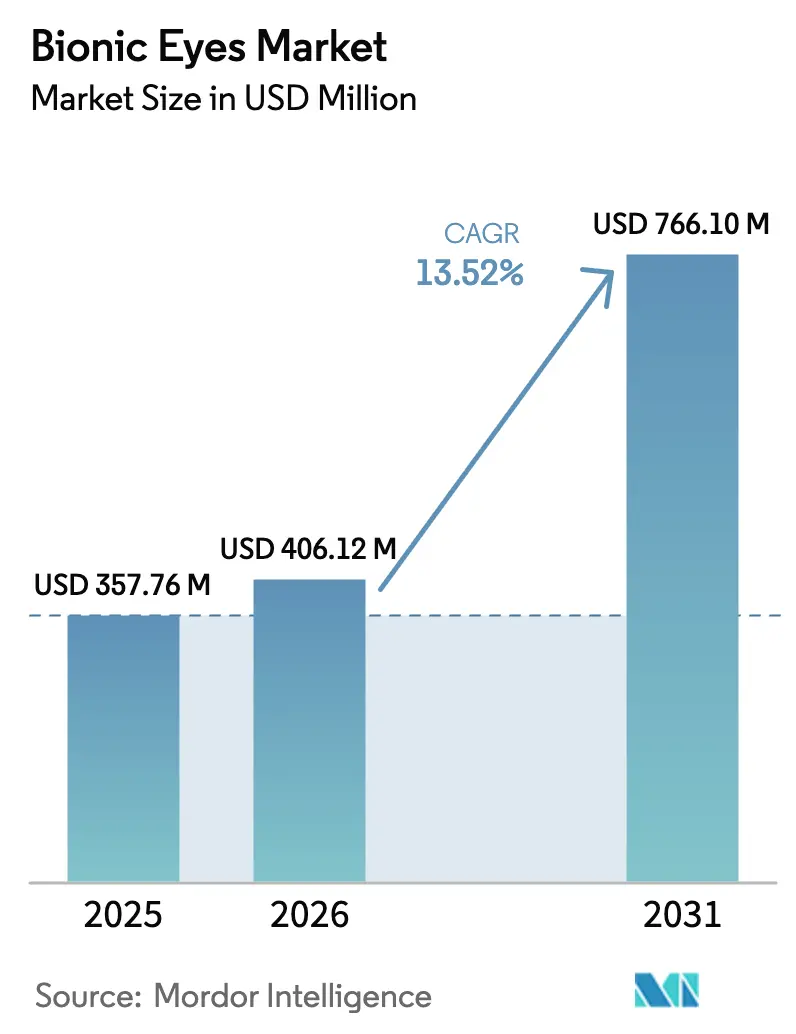
The bionic eyes market size in 2026 is estimated at USD 406.12 million, growing from 2025 value of USD 357.76 million with 2031 projections showing USD 766.1 million, growing at 13.52% CAGR over 2026-2031. Robust growth comes from converging demographic pressure, fast-track regulatory pathways, and micro-electronics miniaturization that together are shifting visual prosthetics from experimental devices to practical clinical therapies. Retinal prostheses still dominate installed bases, yet cortical systems are advancing quickly as research confirms superior resolution potential. Fully implantable devices are displacing legacy external cameras as wireless power transmission approaches technical maturity, and component innovation is concentrating on energy management and closed-loop firmware. Competitive rivalry remains moderate because precision manufacturing, regulatory scrutiny, and surgical learning curves deter rapid entry, although breakthrough designations and public funding are shortening commercialization timelines. Cost, reimbursement gaps, and post-surgical risk temper growth, but expanding patient eligibility and stronger reimbursement codes offset these headwinds in developed health systems.
Key Report Takeaways
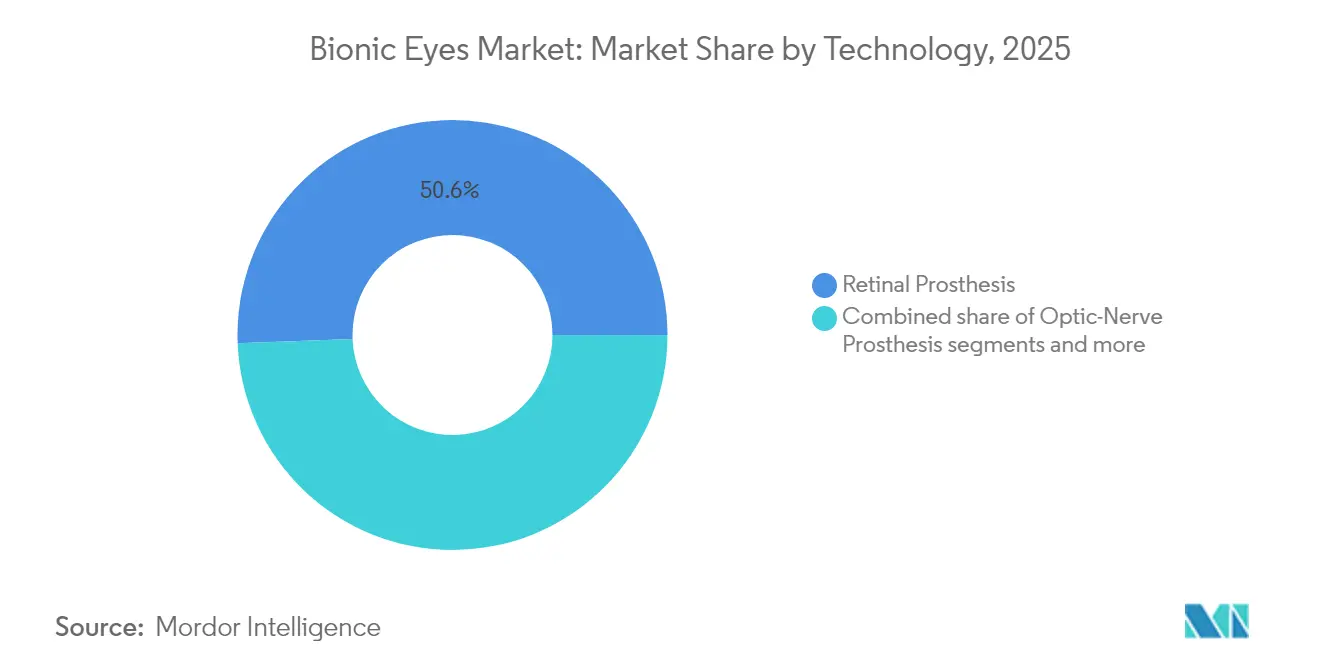
- By technology, retinal prosthesis commanded 50.62% of the bionic eyes market share in 2025; cortical visual prosthesis is advancing at a 14.33% CAGR through 2031.
- By device placement, external wearable systems led with 64.60% of the bionic eyes market share in 2025, while fully implantable systems are expanding at a 14.28% CAGR to 2031.
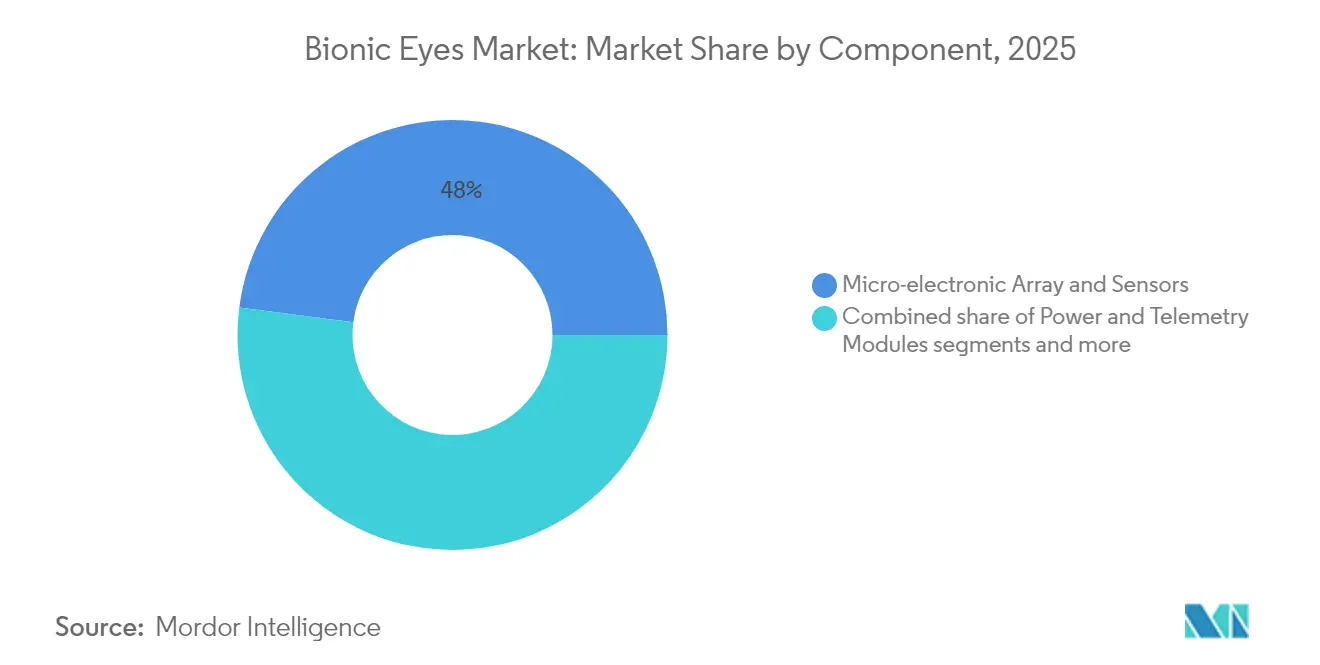
- By component, micro-electronic array & sensors accounted for 47.95% share of the bionic eyes market size in 2025 and power & telemetry modules are growing at a 14.45% CAGR through 2031.
- By end-user, hospitals & eye-care chains captured 53.10% revenue share in 2025; academic & research institutes record the highest projected CAGR at 14.58% to 2031.
- By region, North America retained 41.72% share of the bionic eyes market size in 2025, whereas Asia-Pacific is set to expand at 14.67% CAGR during 2026-2031.
Note: Market size and forecast figures in this report are generated using Mordor Intelligence’s proprietary estimation framework, updated with the latest available data and insights as of 2026.
Global Bionic Eyes Market Trends and Insights
Drivers Impact Analysis*
| Driver | (~) % Impact on CAGR Forecast | Geographic Relevance | Impact Timeline |
|---|---|---|---|
| Aging population & retinal-degeneration prevalence | +3.2% | Global, concentrated in North America & Europe | Long term (≥ 4 years) |
| Advances in micro-electronics & bio-materials | +2.8% | North America & EU; spill-over to Asia-Pacific | Medium term (2-4 years) |
| Increasing neuro-prosthetic R&D funding | +2.1% | North America core, expanding to Asia-Pacific | Medium term (2-4 years) |
| Favorable regulatory fast-track designations | +1.9% | North America & EU regulatory zones | Short term (≤ 2 years) |
| Closed-loop adaptive-stimulation algorithms | +1.5% | Global, led by North American research hubs | Long term (≥ 4 years) |
| AR/VR optic know-how leveraged in implants | +1.2% | Global, early adoption in developed markets | Medium term (2-4 years) |
| Source: Mordor Intelligence | |||
Aging Population & Retinal-Degeneration Prevalence
Global life expectancy gains mean more individuals enter age cohorts where retinal pathologies peak. Age-related macular degeneration already affects over 200 million people, and prevalence doubles each decade after 50 years. Retinitis pigmentosa adds further demand at roughly 1 in 4,000 incidence worldwide. Long-term follow-up from Australia’s second-generation bionic eye showed 97% electrode functionality over 2.5 years, confirming durability for older recipients. Developed health systems possess surgical infrastructure and chronic-care pathways, so they absorb early adoption, yet aging is universal, ensuring sustained demand even in emerging markets as capacity builds. Demographic momentum thus anchors double-digit expansion well beyond 2030.
Advances in Micro-Electronics & Bio-Materials
Miniaturized semiconductors and flexible, corrosion-resistant substrates now allow neuron-scale implants that minimize tissue trauma while boosting channel count. Tellurium nanowire retinal arrays convert visible and near-infrared light directly into current without external packs, moving the field closer to self-powered vision chips[1]Source: Science Journal, “Tellurium Nanowire Retinal Nanoprosthesis Improves Vision in Models of Blindness,” science.org . Swedish researchers fabricated 40-µm electrodes on elastic polymers that withstand bending inside ocular tissue, cutting chronic inflammation risk. Parallel work on PDMS hermetic coating projects decade-long implant survival in physiological fluid. Combined, these advances raise achievable resolution, boost reliability, and lower revision surgeries, accelerating payer acceptance.
Increasing Neuro-Prosthetic R&D Funding
The United States ARPA-H committed USD 56 million to NYU Langone and USD 46 million to University of Colorado for whole-eye transplantation and optic-nerve regeneration, the largest single federal outlays in vision restoration to date. NIH-backed cortical trials such as the Intracortical Visual Prosthesis have reached two-year safety milestones, drawing additional venture rounds. Neuralink’s fundraising success following its breakthrough designation further illustrates how regulatory clarity catalyzes private capital. Cyclic reinforcement between positive trial data and funding inflows increases study scale and hastens commercial roll-outs in the bionic eyes market.
Favorable Regulatory Fast-Track Designations
The FDA Breakthrough Device program now supports several vision implants, trimming review steps and facilitating real-time agency feedback. Neuralink’s Blindsight entry in September 2024 exemplifies the path, shaving an estimated two years off the typical approval cycle. EMA’s Advanced-Therapy modules mirror this flexibility, and CE-marked devices like PRIMA proceed through pivotal trials under customized guidance. Medicare’s dedicated procedure codes for retinal prostheses address payer uncertainty and spur physician uptake. Streamlined pathways de-risk investment and shorten time-to-patient for the bionic eyes market.
Restraints Impact Analysis*
| Restraint | (~) % Impact on CAGR Forecast | Geographic Relevance | Impact Timeline |
|---|---|---|---|
| High surgical & device cost; limited reimbursement | -2.5% | Global, most acute in emerging markets | Medium term (2-4 years) |
| Post-surgical risks & explantation rates | -1.8% | Global, with higher impact in markets with limited surgical expertise | Short term (≤ 2 years) |
| Algorithmic latency-induced cyber-sickness | -1.2% | Global, particularly in cortical prosthesis applications | Medium term (2-4 years) |
| Scarcity of ultra-miniature hermetic-package supply | -0.9% | Global, with concentration in advanced manufacturing regions | Long term (≥ 4 years) |
| Source: Mordor Intelligence | |||
High Surgical & Device Cost; Limited Reimbursement
Total outlays run from USD 115,000 to USD 500,000 per patient, covering hardware, neurosurgery, and rehabilitation, challenging affordability outside premium insurance pools. European cost-utility reviews show ratios beyond EUR 53,165 per QALY, exceeding many payer thresholds. Low production volumes limit scale efficiencies, while hermetic packaging and high-grade biomaterials raise bill-of-materials versus conventional implants. Reimbursement remains patchy; Medicare covers a limited set, and many private plans tag devices experimental, forcing patients to self-fund or enroll in trials. These financial frictions slow uptake in emerging economies and delay break-even for manufacturers.
Post-Surgical Risks & Explantation Rates
Device memory recalls, infections, or electrode failures can necessitate removal, eroding physician confidence. Second Sight’s Argus II discontinuation left implanted users unsupported, spotlighting vendor viability risk. Cortical implants demand cranial surgery, adding complexity relative to retinal approaches and elevating perioperative risk. Surgical learning curves confine procedures to few centers, restricting geographic reach. Although modern materials cut corrosion and immune response, long-term data remain scarce, and visual prostheses address quality-of-life rather than life-threatening conditions, so safety thresholds are stringent. These clinical uncertainties moderate near-term penetration for the bionic eyes market.
*Our forecasts treat driver/restraint impacts as directional, not additive. The impact forecasts reflect baseline growth, mix effects, and variable interactions.
Segment Analysis
By Technology: Cortical Systems Disrupt Retinal Leadership
The bionic eyes market size linked to retinal prostheses totaled USD 181.15 million in 2025, equal to 50.62% share, reflecting decades of iterative refinement and clearer reimbursement pathways. Cortical visual prostheses, while nascent, post a 14.33% CAGR through 2031 as neural chips bypass damaged retinal and optic-nerve structures, widening eligibility to profound blindness including optic-nerve trauma. Early cortical trials report navigation improvements and letter recognition accuracy that approach low-resolution vision, validating the technology for broader deployment. Investment is shifting accordingly, with Neuralink and academic consortia capturing multi-million-dollar grants and private placements.
The competitive profile diverges: retinal incumbents pursue pixel-density upgrades and slimmer sub-retinal films, whereas cortical pioneers focus on safe trans-dural electrode mats and machine-learning decoders. Cortical systems carry higher surgical complexity but promise higher ceiling resolution and larger addressable populations, enticing investors despite longer timelines. Success in scaling channel counts and securing chronic safety will determine if cortical platforms overtake retinal solutions before 2035 in the bionic eyes market.


By Device Placement: Fully Implantable Designs Gain Priority
External wearable systems contributed 64.60% of the bionic eyes market share in 2025 thanks to camera-mounted glasses paired with implanted stimulators, but growth plateaus under social-acceptance constraints and maintenance demands. Fully implantable configurations are registering 14.28% CAGR as wireless telemetry, photonic power scavenging, and miniature batteries mature. Laser-driven diamond implants now achieve 55% photovoltaic conversion, demonstrating self-powered operation inside the eye and removing external packs.
User feedback underscores autonomy and cosmetic neutrality as key adoption criteria. Surgical teams likewise prefer sealed units that reduce infection risk by eliminating percutaneous leads. Commercial roadmaps prioritize inductive charging coils, ultrathin zinc-air batteries, and biocompatible encapsulants, indicating that fully implantable models will command rising revenue share by the end of the decade in the bionic eyes market.
By Component: Power & Telemetry Dominate Innovation Focus
Micro-electronic arrays and sensors delivered 47.95% revenue in 2025, reflecting their foundational role in signal transduction. Yet power & telemetry modules represent the fastest-growing component at 14.45% CAGR as autonomy becomes the market’s differentiator. Hybrid solar–metal-air harvesters inside contact-lens form factors highlight how continuous micro-watt delivery can obviate external chargers. Firmware-defined controllers capable of 256-pixel stimulation with minimal crosstalk show software’s growing value.
Systems integration now hinges on harmonizing battery life, thermal limits, and AI-based closed-loop algorithms. Firms that couple proprietary power IP with high-density stimulators can command premium pricing and licensing income in the bionic eyes market.
By End-User: Academia Accelerates Translation
Hospitals and eye-care chains retained 53.10% market share in 2025 as they house surgical theaters and rehabilitation units essential for implantation and training. Academic and research institutes, however, register 14.58% CAGR, fueled by ARPA-H mega-grants and university–industry alliances. Multi-institutional projects at NYU, UC San Diego, and University of Colorado are integrating immunology, micro-fabrication, and brain–computer-interface science, rapidly advancing device readiness. Hospitals increasingly partner with these programs for first-in-human trials, creating a feedback loop that strengthens both segments.
Academic institutes thus function as R&D incubators, while clinical networks provide validation environments and early adopter patient pools, ensuring balanced demand channels across the bionic eyes market.
Geography Analysis
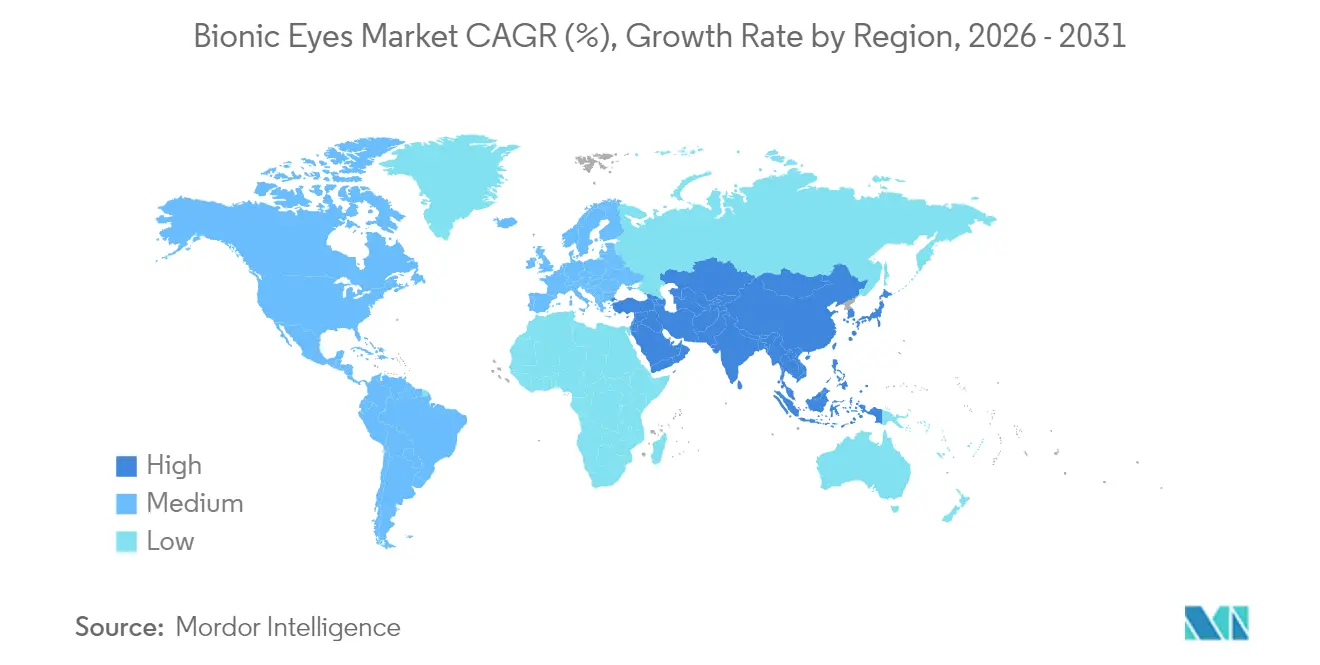
North America held 41.72% of 2025 revenue, supported by FDA breakthrough pathways, Medicare coding, and dense clusters of ophthalmic centers. ARPA-H funding exceeding USD 100 million underwrites whole-eye transplant consortia, reinforcing regional leadership. Public insurers cover select retinal devices, lowering out-of-pocket burdens. The ecosystem of suppliers, surgical fellows, and venture investors forms a self-reinforcing innovation hub that accelerates trial enrollment and product launch within the bionic eyes market.
Asia-Pacific is the fastest-growing area at 14.67% CAGR through 2031, driven by accelerating demographic aging and government-backed medical-device reforms. Japan and South Korea contribute advanced clinical programs, whereas China and India supply vast patient pools and expanding reimbursement pilots. Australia’s second-generation implant trial, maintaining 97% electrode activity over 2.5 years, signals regional research depth. Unequal ophthalmologist distribution remains a barrier, yet tele-training and surgical-tourism initiatives are widening access.
Europe captures a mature but selective share as HTA agencies demand strict cost efficacy. CE-marked platforms such as Pixium’s PRIMAvera target dry AMD and leverage centralized data registries to track longitudinal outcomes. While high safety standards prolong approval cycles, successful devices gain strong reimbursement backing once thresholds are met. Latin America, Middle East, and Africa remain nascent; however, regional technology parks and cross-border cataract surgery networks may transition into bionic eye centers later in the decade.

Regulatory Landscape
Bionic eye systems, spanning retinal prostheses and cortical visual prostheses, are regulated as high-scrutiny medical devices, so commercialization typically advances through staged clinical evidence generation and premarket authorization. In the United States, sponsors generally run under an Investigational Device Exemption (IDE) during clinical trials, and FDA interactions are increasingly shaped by the Breakthrough Devices Program. Within this framework, the FDA granted Breakthrough Device designation to Cortigent's Orion system and to Neuralink's Blindsight (September 2024), which supports more frequent regulator engagement and iterative review feedback while sponsors assemble pivotal-grade data.
Across Asia, regulatory pathways continue to evolve alongside neurotechnology. China implemented new regulations effective 1 May 2026 governing biomedical new technologies, with the National Health Commission administering an early-stage clinical research track that sits apart from the National Medical Products Administration (NMPA) device regime. For systems that incorporate adaptive algorithms, oversight emphasis is moving toward expectations that address ongoing software behavior, including longitudinal monitoring and auditing, rather than one-time static approval. This increases the importance of post-implant surveillance and real-world data collection for manufacturers and clinical centers.
Value Chain Analysis
The bionic eyes value chain begins with R&D and clinical translation (neuroscience, ophthalmology, microelectronics, biocompatible materials, and stimulation software), and then moves into precision component sourcing and manufacturing (micro-electrode arrays, hermetic packaging, power and telemetry modules), system integration, and verification and validation under medical-device quality systems. Clinical deployment depends on a limited number of specialized hospitals and eye-care centers that can support implantation, programming, and long rehabilitation timelines. As a result, commercialization relies on strong clinical-site partnerships and the ability to fit procedures into established surgical workflows.
Recent corporate actions point to value-chain consolidation around durable IP owners and regulatory execution capabilities. Pixium Vision S.A.'s judicial liquidation (February 2024), followed by Science Corporation's acquisition of PRIMA-related assets, reallocated a key subretinal implant program into a larger organization with broader resources for development and regulatory execution. On the cortical and BCI-adjacent side, integration with existing neurosurgical infrastructure is emerging as a practical scaling lever. Precision Neuroscience's partnership with Medtronic (12 January 2026) to integrate BCI technology into the StealthStation surgical navigation ecosystem can reduce adoption friction by aligning implant workflows with tools already used in operating rooms.
Competitive Landscape
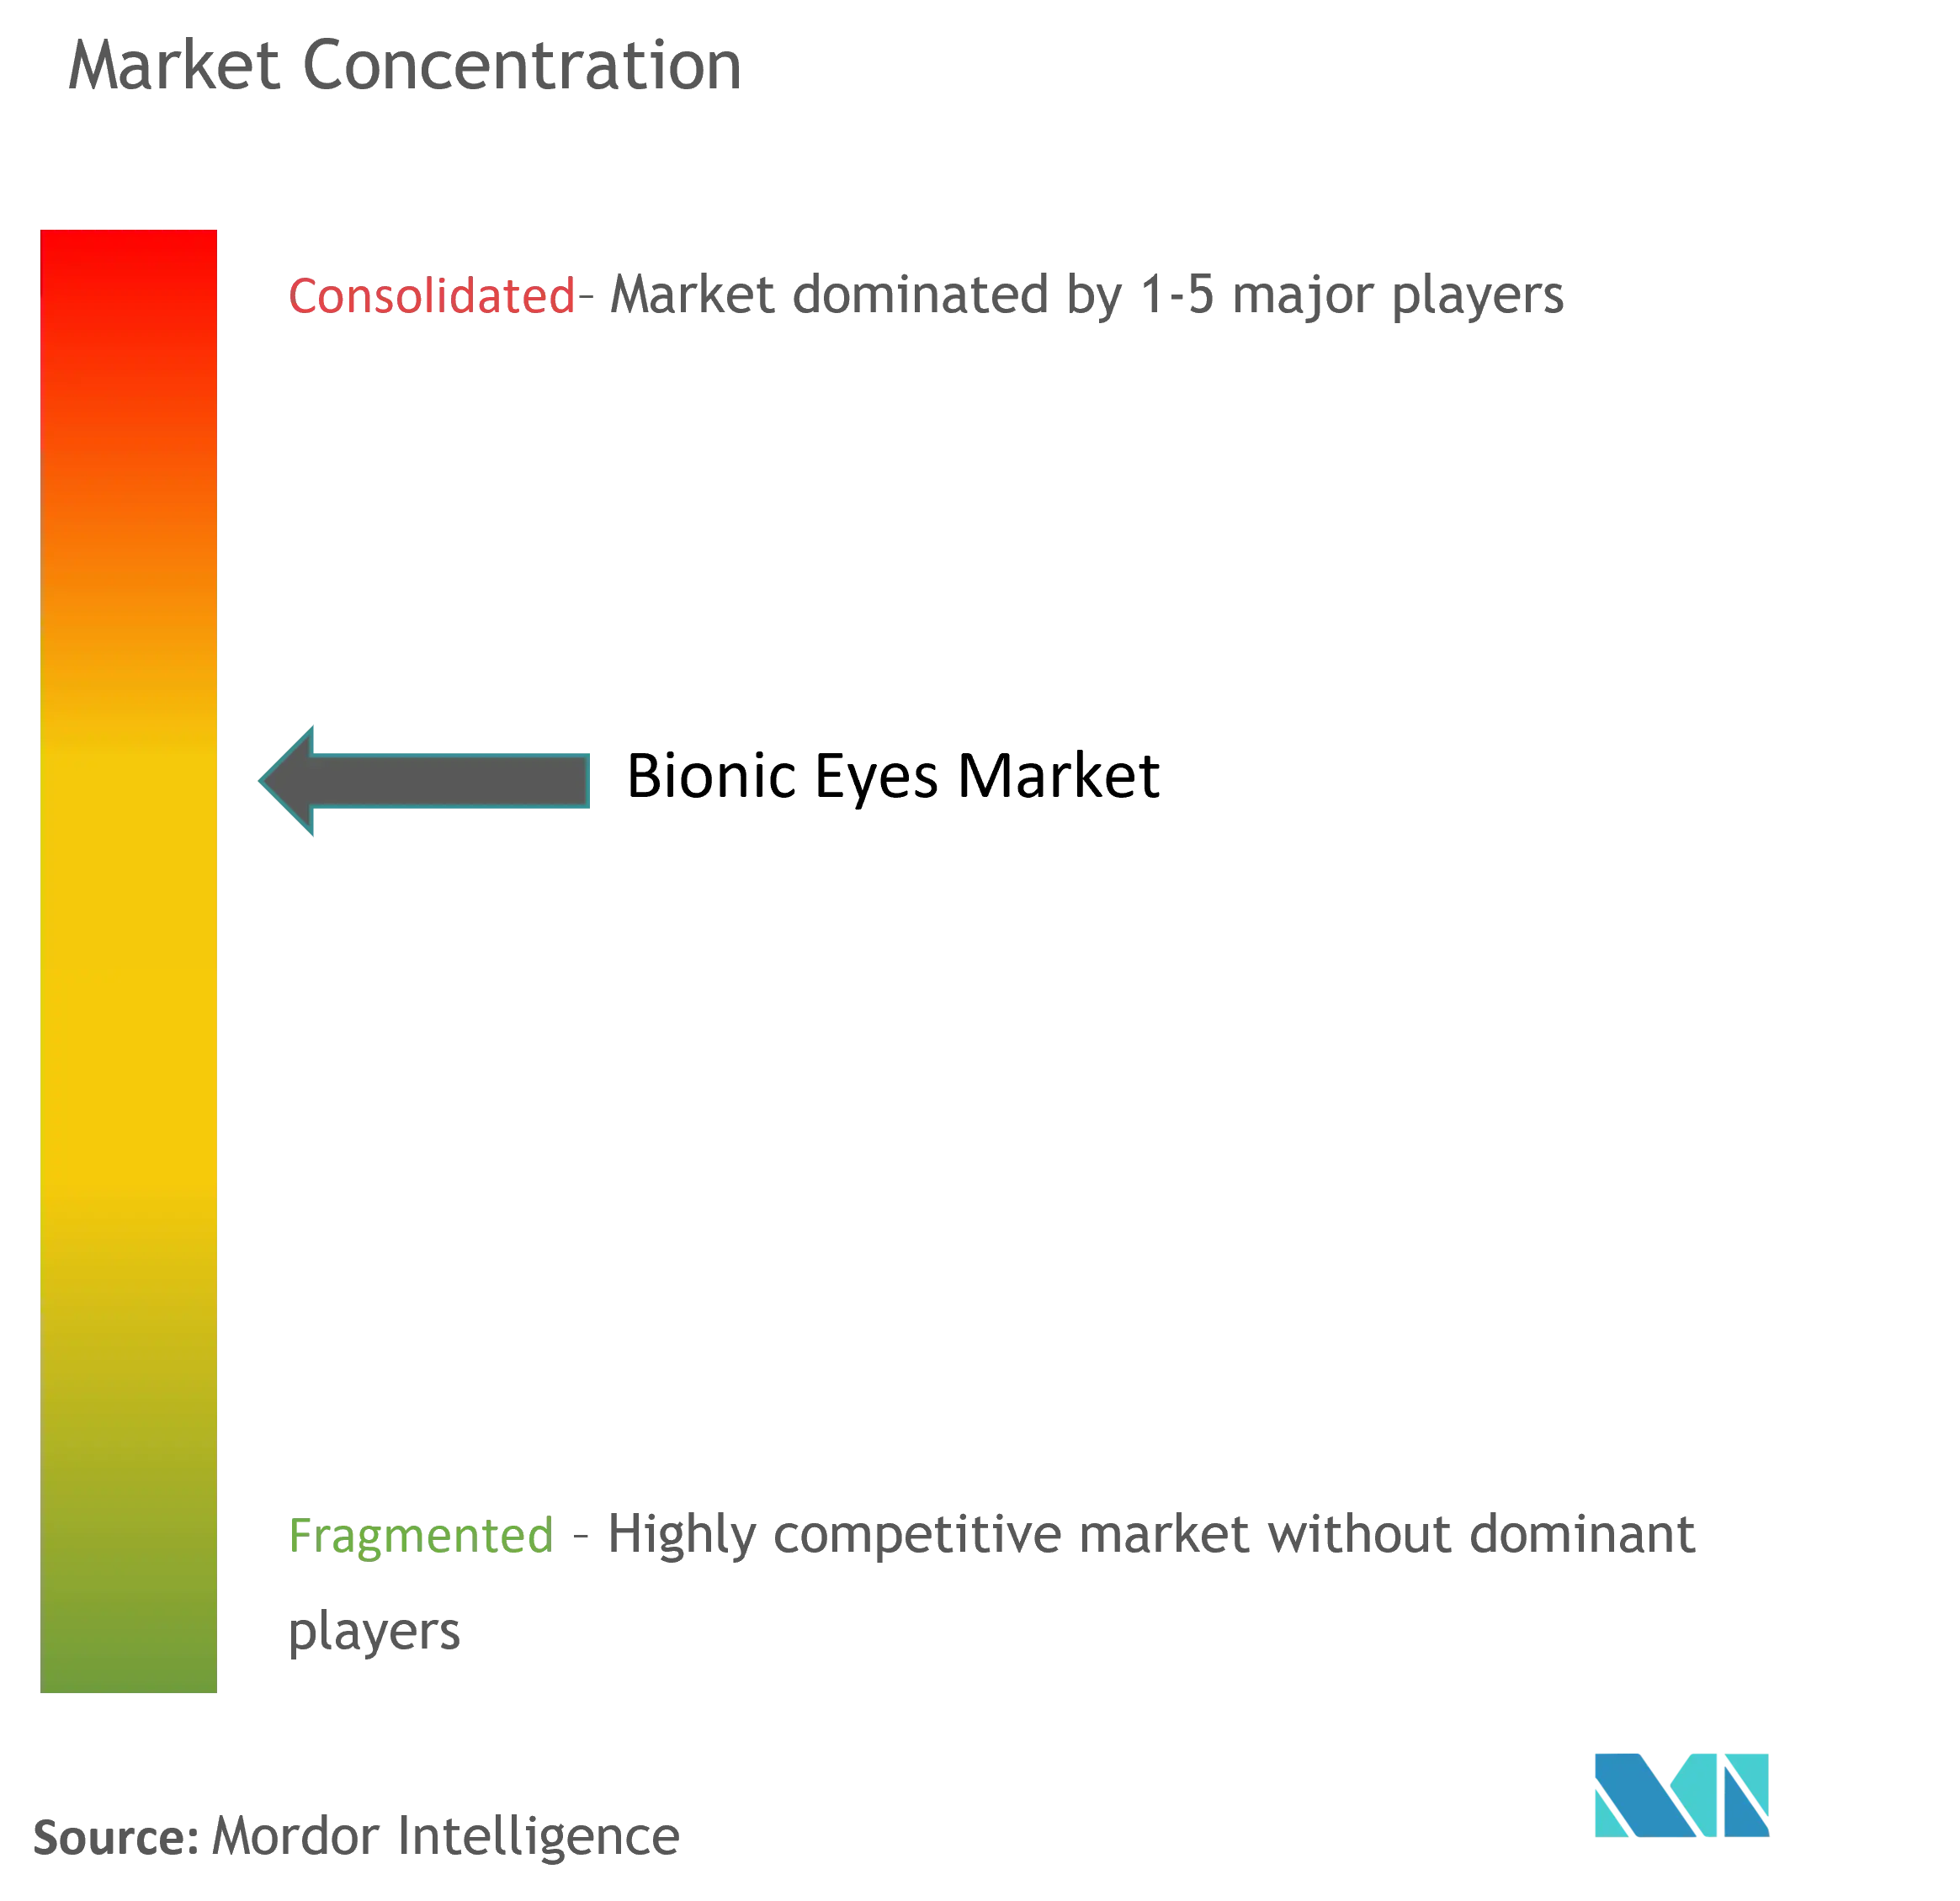
The bionic eyes market exhibits moderate concentration because high entry barriers limit competitors, but paradigm-shift technologies can quickly reorder positions. Retinal specialists like Pixium Vision and Bionic Vision Technologies build on iterative pixel-count gains and established surgical workflows. Cortical challengers such as Neuralink and Cortigent pursue brain-computer interfaces and attract diversified investors, shifting valuations toward AI-driven neurotech rather than conventional med-device multiples.
IP portfolios around stimulation algorithms, biomaterials, and wireless telemetry function as competitive moats, often licensed across segments. Strategic moves include Vivani’s Cortigent spin-off to unlock shareholder value and focus R&D, and Neuralink’s UCSB trial partnership to accelerate first-in-human cortical vision chips. White-space opportunities exist in pediatric blindness, low-cost implants for emerging markets, and combined gene-therapy–device packages. As software content rises, tech firms with AI capabilities may enter via partnerships rather than greenfield manufacturing, intensifying cross-industry convergence in the bionic eyes market.
Bionic Eyes Industry Leaders
Pixium Vision S.A.
Optobionics Corporation
Bionic Vision Technologies
iBionics
Vivani Medical, Inc.
- *Disclaimer: Major Players sorted in no particular order

Market Opportunities and Future Outlook
A clear opportunity is expanding the addressable population beyond classic retinitis pigmentosa toward broader causes of severe vision loss, where device modality selection (retinal vs cortical) can influence eligibility. Cortigent's Orion cortical stimulation program focuses on blindness linked to conditions such as glaucoma and diabetic retinopathy, which supports continued investment in cortical platforms that bypass damaged retinal and optic-nerve pathways. At the same time, subretinal approaches for degenerative retinal disease continue to attract strategic capital and program continuity, including Science Corporation acquiring Pixium's PRIMA retinal implant assets in 2024 and continuing development under a new owner.
Another opportunity is in product architectures and care pathways that reduce total episode-of-care burden for patients and providers, especially fully implantable designs that minimize external wearables and simplify long-term maintenance. Developers such as iBionics (Diamond Eye, diamond-electrode stimulation) illustrate continued experimentation in electrode materials and durability. The 2026 research focus on neuroplastic training and long-term biocompatibility also supports whitespace in software-assisted rehabilitation and post-implant performance optimization. Commercial upside depends on translating clinical evidence into more standardized reimbursement and billing pathways, since gaps in consistent reimbursement models and long-duration outcomes data leave room for manufacturers to differentiate via registries, structured follow-up, and payer-ready endpoints.
Recent Industry Developments
- July 2026: Cortigent, Inc., the Vivani Medical subsidiary, announced a definitive agreement to merge with Nasdaq-listed ClearOne, Inc. in an all-stock reverse merger. The consolidation pools retinal prosthesis and cortical vision assets under a broader investor base and could accelerate scale and commercialization efforts.
- June 2024: Bionic Vision Technologies published clinical data showing long-term stability and functional vision improvements for a second-generation suprachoroidal retinal prosthesis in RP patients. The results support near-term regulatory and clinical validation trajectories for suprachoroidal implants and reinforce the device technology pathway against retinal prostheses.
- May 2024: Science Corporation integrated former Pixium Engineering and Regulatory staff to accelerate development and pursue regulatory pathways for the PRIMA technology. The move consolidates talent and accelerates regulatory readiness for Pixium-derived assets within a broader brain computer interface portfolio.


Research Methodology Framework and Report Scope
Market Definition and Coverage
For this study, the bionic eyes market covers devices and systems designed to provide partial vision restoration by converting visual information into electrical signals that stimulate the visual pathway, along with the related components used in these solutions.
Scope exclusions: Non-bionic ophthalmic implants and routine vision aids (such as standard intraocular lenses, spectacles, and contact lenses) are excluded from this sizing.
Segmentation Overview
- By Technology
- Retinal Prosthesis
- Optic-Nerve Prosthesis
- Cortical Visual Prosthesis
- Others (Photovoltaic, Magnetoelectric)
- By Device Placement
- External Wearable Systems
- Fully Implantable Systems
- By End-User
- Hospitals & Eye-Care Chains
- Ophthalmology Clinics
- Academic & Research Institutes
- By Component
- Micro-electronic Array & Sensors
- Power & Telemetry Modules
- Software & Firmware
- By Geography
- North America
- United States
- Canada
- Mexico
- Europe
- Germany
- United Kingdom
- France
- Italy
- Spain
- Rest of Europe
- Asia-Pacific
- China
- India
- Japan
- South Korea
- Australia
- Rest of Asia-Pacific
- South America
- Brazil
- Argentina
- Rest of South America
- Middle East and Africa
- GCC
- South Africa
- Rest of Middle East and Africa
- North America
Data Sources, Market Sizing, and Validation
Desk Research
Desk research was used to set the base structure of the market and anchor the model to measurable healthcare and device signals. We reviewed public sources such as the World Health Organization for vision impairment context, US FDA device and approval communications, US National Institutes of Health and PubMed-indexed clinical publications, and OECD health statistics for spend and care capacity context. Where relevant, trade data themes and device classification notes were checked using official government portals.
On the industry side, we reviewed company filings, investor presentations, press releases, and medical device and ophthalmology association websites to understand product positioning, trial timelines, and likely pricing ranges. A few paid subscriptions were used selectively for company financial intelligence, patent landscapes, and cross-checking shipment level trade signals when public detail was limited. These desk sources are illustrative, and many other public references were used during the work to collect, validate, and clarify data points.
Primary Interviews and Surveys
Primary interviews and surveys were used to pressure test assumptions that cannot be cleanly read from public data, especially adoption pace, likely patient selection, and how pricing differs by region and care setting. We spoke with clinical stakeholders, device ecosystem participants, and informed observers across major regions so that key uncertainties like procedure volumes, replacement cycles, and reimbursement realities could be corrected before finalizing the model.
Distribution of primary research fieldwork respondents
| Company type | Respondent position | Region |
|---|---|---|
| Top tier: 26% | CXOs: 12% | APAC: 41% |
| Mid tier: 57% | Functional/Unit leaders: 28% | EMEA: 32% |
| Smaller Players: 17% | Managers: 60% | Americas: 27% |
Market-Sizing & Forecasting
Sizing starts from a top-down build where the eligible demand pool is reconstructed using visual-impairment prevalence signals, treated-patient funnels, and realistic procedure capacity, then converted into value using typical system pricing and replacement patterns. To keep the output grounded, we corroborate totals using selective bottom-up checks, including sampled ASPs tied to likely unit volumes by setting, and reasonableness checks against publicly visible product rollouts and channel activity.
The model uses a small set of practical inputs that move the market each year, such as the addressable patient cohort for degenerative retinal conditions, procedure and fitting throughput by hospitals and specialty clinics, average selling price progression for external versus fully implantable systems, component content per system (for example, sensor and micro-electronic array intensity), and the expected lag between trial progress and commercial uptake. When data is missing for smaller markets, gaps are handled through proxy indicators like ophthalmology center density and healthcare spend trends, followed by expert review to avoid overfitting.
Forecasting is run using scenario analysis supported by expert consensus on key drivers, then smoothed year to year so growth reflects real adoption constraints instead of straight-line jumps. Assumptions are stress-tested for sensitivity to pricing, reimbursement timing, and adoption readiness before the final numbers are locked.
Data Validation & Update Cycle
Validation is done through cross-checks across independent signals, followed by variance review so outliers are explained rather than averaged away. We compare outputs against demand-side metrics such as procedure capacity and patient funnel logic, and also against supply-side signals like product readiness, announced scale-up activity, and component availability patterns.
Before sign-off, the model and key assumptions go through multi-step internal review, and re-contacts are triggered when a major variance appears by geography, device placement, or end-user setting. Reports are refreshed annually, with interim updates when material events occur, and a final pre-delivery scan is completed so clients receive the latest view.
Mordor Intelligence's Bionic Eyes Market Sizing Compared With Other Published Estimates
Published market sizes for bionic eyes can look far apart because authors do not always count the same device types, and adoption curve assumptions are sometimes framed more as a technology story than a healthcare delivery story. Differences also come from how pricing is treated, which year is used as the base, and how often the model is refreshed.
The main gap comes from whether external wearable vision systems and adjacent brain-interface concepts are included in the same spend pool. Mordor Intelligence counts them only when they are positioned as bionic-eye solutions with a defined clinical use and an identifiable end-user purchasing pathway.
Benchmark comparison
| Source | Market Size | Gaps in Research Methodology |
|---|---|---|
| Mordor Intelligence | USD 406.12 M (2026) | |
| Global Consultancy A | USD 322.15 M (2024) | Uses an earlier base year and a broader technology description that can blend implantable systems with wider wearable and interface concepts, which can change what is counted and how fast adoption is assumed. |
| Trade Journal B | USD 199.97 M (2032) | Focuses on a longer-range point estimate and appears to apply a narrower revenue base with limited clarity on included components and pricing progression, which can compress the value pool versus a system-plus-components view. |
The spread across sources is mainly explained by scope choices, base-year timing, and how pricing and uptake are translated into annual revenue. By keeping assumptions tied to an identifiable treated cohort, realistic care delivery constraints, and repeatable price logic, the estimate is easier to trace and update when new clinical or commercialization signals emerge.


Key Questions Answered in the Report
How large is the bionic eyes market in 2026?
It is valued at USD 406.12 million, and forecasts indicate a rise to USD 766.1 million by 2031.
What CAGR is projected for bionic eye revenues through 2031?
Revenues are expected to grow at a 13.52% CAGR during 2026-2031.
Which technology is growing fastest within visual prosthetics?
Cortical visual prosthesis is projected to expand at a 14.33% CAGR because it can bypass retinal damage.
Which region will see the highest growth in adoption?
Asia-Pacific is set to record a 14.67% CAGR as aging populations converge with rising healthcare investment.
What remains the primary cost barrier to broader use?
Total treatment costs of USD 115,000500,000 per patient and inconsistent reimbursement slow adoption.
Who are emerging disruptors challenging retinal implant incumbents?
Neuralink, Cortigent, and academic consortia leveraging brain-computer interface advances are leading the next wave of innovation.
Page last updated on:


 Your data is secure and never sold or shared.


