
Biometric Card Market Size and Share
Market Overview
| Study Period | 2020 - 2031 |
|---|---|
| Market Size (2026) | USD 1.62 Billion |
| Market Size (2031) | USD 17.09 Billion |
| Growth Rate (2026 - 2031) | 60.20 % |
| Fastest Growing Market | Middle East |
| Largest Market | Asia Pacific |
| Market Concentration | Medium |
Major Players *Disclaimer: Major Players sorted in no particular order Image © Mordor Intelligence. Reuse requires attribution under CC BY 4.0. | |
Biometric Card Market Analysis by Mordor Intelligence
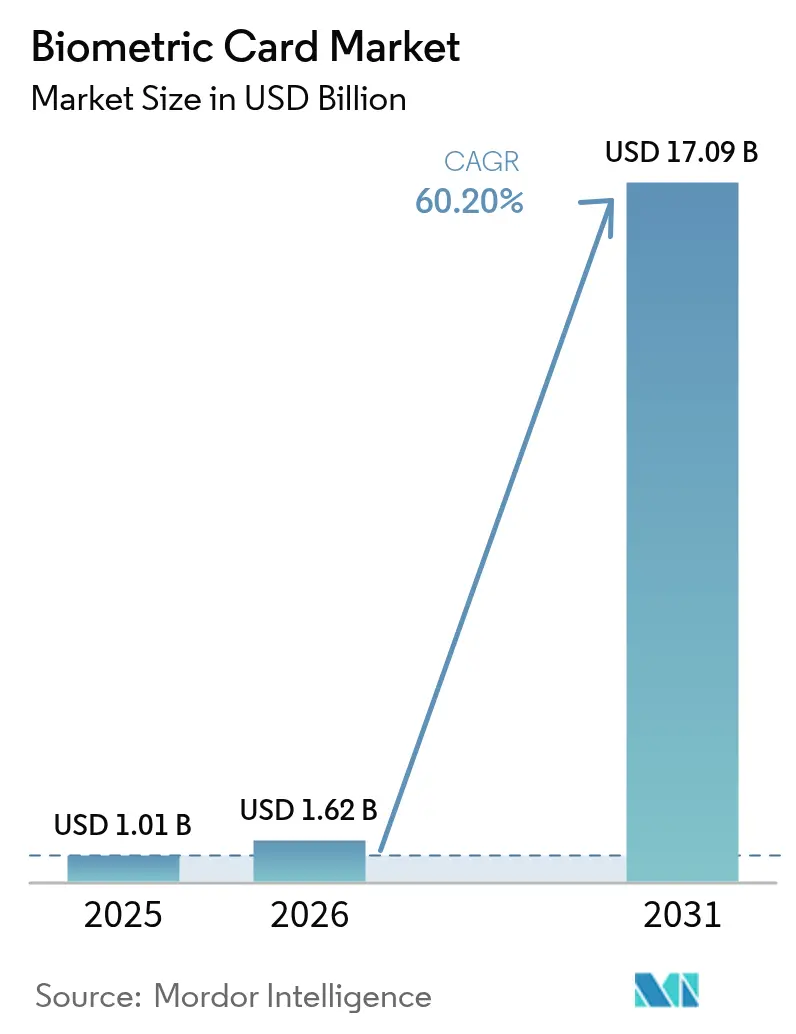
The biometric card market size was valued at USD 1.01 billion in 2025 and estimated to grow from USD 1.62 billion in 2026 to reach USD 17.09 billion by 2031, at a CAGR of 60.2% during the forecast period (2026-2031). This exceptional trajectory is underpinned by falling fingerprint-sensor prices below USD 5 per unit, sweeping strong-customer-authentication mandates, and issuer strategies to claw back interchange revenue that migrated to smartphone payment platforms. Manufacturing yields have risen steadily, making large-scale rollouts economically sound and cutting time-to-market for new card programs. Early commercial deployments in Japan, China, and Saudi Arabia validated consumer appetite, while global payment networks completed core certifications that dispelled lingering technical doubts. Issuers now view the biometric card market as an essential counterweight to mobile-wallet dominance rather than a niche add-on.
Key Report Takeaways
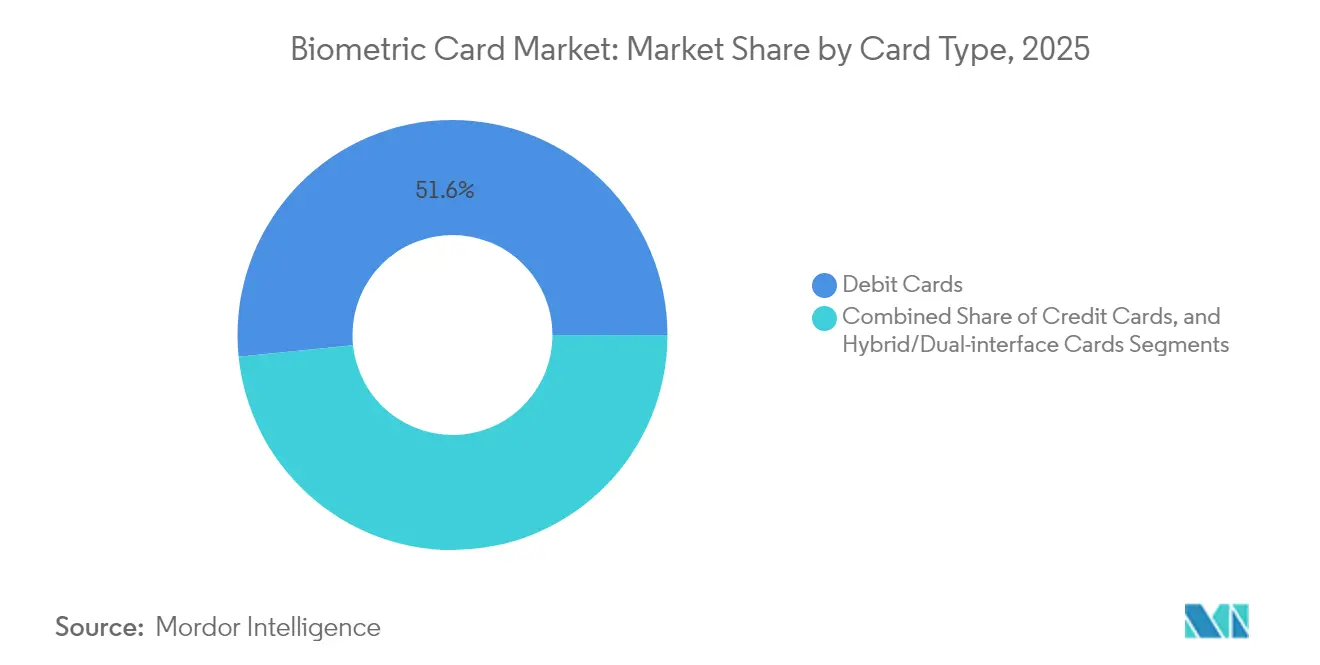
- By card type, debit cards held 51.62% of the biometric card market share in 2025; hybrid dual-interface cards are expanding at a 62.1% CAGR through 2031.
- By application, payments commanded 70.35% of the biometric card market size in 2025; crypto cold-wallet storage cards are accelerating at a 63.4% CAGR to 2031.
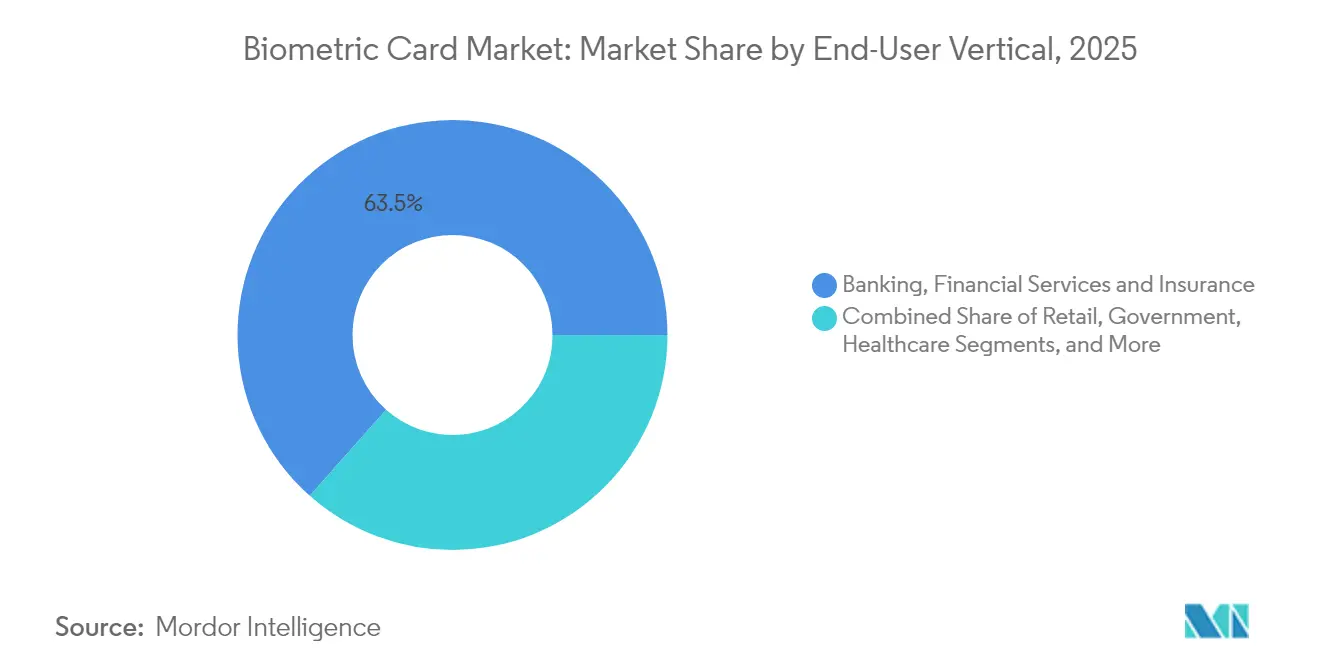
- By end-user vertical, banking, financial services and insurance captured 63.45% revenue in 2025; hospitality is on track for a 61.8% CAGR through 2031.
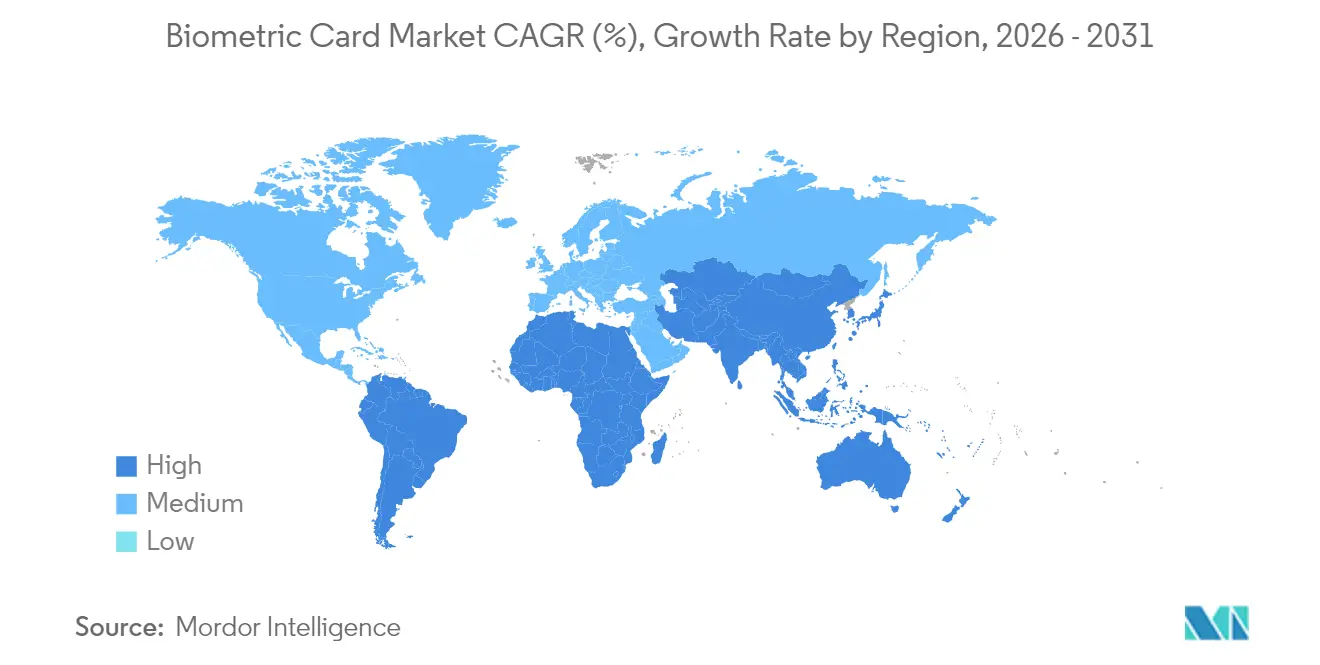
- By geography, Asia Pacific generated 38.10% of 2025 global revenue; the Middle East is forecasting a 66.4% CAGR through 2031.
Note: Market size and forecast figures in this report are generated using Mordor Intelligence’s proprietary estimation framework, updated with the latest available data and insights as of 2026.
Market Trends and Insights
Drivers Impact Analysis of Biometric Card Market*
| Driver | (~) % Impact on CAGR Forecast | Geographic Relevance | Impact Timeline |
|---|---|---|---|
| Rising adoption of contactless payments | +12.5% | Global, APAC and Europe | Short term (≤ 2 years) |
| Declining biometric sensor and secure-element costs | +15.2% | Global, manufacturing concentrated in Asia | Medium term (2-4 years) |
| Regulatory push for strong customer authentication | +8.7% | Europe, expanding to North America | Medium term (2-4 years) |
| Financial-inclusion programmes in emerging economies | +6.3% | Africa, South America, Southeast Asia | Long term (≥ 4 years) |
| Banks aiming to reclaim interchange lost to OEM wallets | +11.4% | North America and Europe | Short term (≤ 2 years) |
| Demand for biometric cold-wallet crypto storage cards | +4.8% | Global, crypto-active regions | Long term (≥ 4 years) |
| Source: Mordor Intelligence | |||
Rising Adoption of Contactless Payments
Contactless usage shifted from convenience feature to preferred default during the pandemic and remains entrenched. Biometric cards remove the contactless value limit that otherwise triggers PIN entry, preserving tap-and-go speed while restoring lost fraud controls. Japan’s Life Card program showed consumers quickly accept fingerprint verification for higher-ticket meals and transit fares. Payment networks now promote biometric authentication to keep the physical card relevant amid wallet-based ecosystems. Retailers benefit from shorter queues and lower chargeback risk, reinforcing merchant support for the biometric card market.[1]
Declining Biometric Sensor and Secure-Element Costs
Volume production pushed fingerprint-sensor prices under USD 5, trimming bill-of-materials costs to the point where issuers can mass-issue biometric cards without annual fees. Infineon’s Secora Pay Bio and Fingerprint Cards’ single-chip architecture eliminated duplicate microcontrollers, shaving power budgets and simplifying lamination steps. Yield improvements in multi-layer construction reduced scrap rates that once exceeded 20%, unlocking new profit pools for contract manufacturers. As each capacity doubling historically cuts silicon cost 15-20%, the biometric card market now enjoys semiconductor-style cost curves formerly limited to mobile handsets.
Regulatory Push for Strong Customer Authentication
Europe’s PSD2 framework demands two-factor verification, prompting issuers to look beyond SMS one-time passwords that inflate fraud losses from SIM-swap attacks. A fingerprint embedded on the card satisfies “something you have” and “something you are” in one motion, letting merchants meet compliance without forcing shoppers to juggle phones. Visa’s Payment Passkey showcases how card-present and card-not-present flows converge when biometric credentials remain under user control. Similar mandates now surface in Canada and Singapore, ensuring persistent regulatory lift for the biometric card market.[2]
Banks Aiming to Reclaim Interchange Lost to OEM Wallets
Apple Pay and Google Pay stripped issuers of the top-of-wallet position, eroding brand visibility and fee revenue. Biometric cards enable banks to re-establish direct customer relationships while promising a smartphone-class user experience. Regional and community banks, in particular, leverage fingerprint cards to avoid costly wallet-provider contracts. Mastercard’s plan to drop embossed numbers by 2030 positions card-side biometrics as the primary security anchor, further cementing issuer enthusiasm for the biometric card market.[3]
Restraints Impact Analysis of Biometric Card Market*
| Restraint | (~) % Impact on CAGR Forecast | Geographic Relevance | Impact Timeline |
|---|---|---|---|
| High production cost and low manufacturing yield | -8.9% | Global, concentrated in manufacturing hubs | Short term (≤ 2 years) |
| Competition from smartphone biometrics | -12.3% | Developed markets with high smartphone penetration | Medium term (2-4 years) |
| Lack of standardised remote-enrolment processes | -5.4% | Global, enterprise deployments | Medium term (2-4 years) |
| Sustainability concerns over multi-layer card materials | -3.2% | Europe and North America | Long term (≥ 4 years) |
| Source: Mordor Intelligence | |||
High Production Cost and Low Manufacturing Yield
Complex card stacks pair fingerprint sensors, secure elements, antennas, and batteries into a 0.8 mm form factor. Misalignment or lamination voids render entire batches unusable, keeping yields below conventional contactless cards. Fingerprint Cards posted SEK 403.2 million (USD 38.5 million) revenue in 2024, down sharply as rising scrap curtailed volumes. Zwipe’s March 2025 bankruptcy underscores the capital strain when production ramp-ups collide with persistent defects. Until automation and inline optical inspection mature, manufacturing economics will cap supply growth and temper the biometric card market.
Competition from Smartphone Biometrics
Consumers already unlock phones with fingerprints or faces, raising the hurdle for a separate biometric object. Device-centric wallets bundle payments, transit, and boarding passes, making cards appear redundant for digital-native users. Although regulators probe big-tech dominance, user inertia remains strong: tapping a phone substitutes for both plastic and cash in most urban settings. To prevail, biometric cards must highlight offline capability, interoperability, and cross-network acceptance that phones cannot always match, especially in legacy terminals. The contest will narrow addressable share in highly penetrated smartphone regions, challenging growth targets for the biometric card market.
*Our forecasts treat driver/restraint impacts as directional, not additive. The impact forecasts reflect baseline growth, mix effects, and variable interactions.
Biometric Card Market Segment Analysis
By Card Type - Debit Dominance, Hybrid Upswing
Debit cards generated 51.62% of revenue in 2025, reflecting everyday payment frequency and fraud-liability shifts toward issuers that favor biometric authentication. Users accept fingerprint verification because it removes PIN-entry friction while guarding checking-account balances. Credit cards trail but benefit from high-ticket international travel where offline biometric verification offers peace of mind. The hybrid dual-interface format now enjoys a 62.1% CAGR, outpacing the overall biometric card market size as issuers choose a single SKU that works in contact and contactless reader modes. Kona’s PVC and metal approvals highlight extension into premium tiers carrying higher interchange.
Hybrid cards also streamline inventory and simplify consumer education because the fingerprint ritual stays identical at supermarket terminals, transit gates, or restaurant EMV readers. Metal substrates further appeal to affluent segments seeking tangible differentiation yet demand reliable sensor calibration to handle thicker housings. As volume scales, hybrid yields improve, reducing unit premiums and expanding availability beyond platinum-tier offerings. This feedback loop places hybrid formats at the competitive core of the biometric card market.

By Application - Payments Rule, Crypto Storage Accelerates
Payments captured 70.35% of 2025 revenue, leveraging existing POS infrastructure and EMV contactless rollouts. Fingerprint verification raises floor-limit thresholds, pushing more transactions into fee-generating tap journeys. Access-control use cases follow, where one badge now opens doors and settles cafeteria bills, easing credential sprawl in large enterprises. Government ID projects adopt biometric cards to merge welfare disbursement with identity verification under anti-fraud mandates.
Crypto cold-wallet storage, however, demonstrates the fastest 63.4% CAGR through 2031. Institutional holders require hardware segregated from internet-connected devices to comply with custody regulations. Fingerprint-protected smartcards appeal because private keys remain sealed inside tamper-evident secure elements. The segment’s surge injects new independent software vendors and custody startups into the biometric card market, spurring diversification beyond traditional payment rails and creating opportunity for specialized secure-element chipsets.
By End-User Vertical - BFSI Leads, Hospitality Surges
Banking, financial services and insurance controlled 63.45% share in 2025 because issuing banks orchestrate card programs and own the interchange revenue at stake. Fraud-loss reduction, PSD2 compliance, and brand-differentiation pressures assure sustained investment. Retailers rank second, embedding employee access features and customer loyalty into one fingerprint-enabled form factor. Government agencies pilot disbursement cards with biometric identity to curb leakage in social programs.
Hospitality records a 61.8% CAGR as hotels roll out dual-purpose room keys that also authorize poolside purchases. Guest check-in happens at kiosks where the same card unlocks elevators, rooms, and spa lockers, creating seamless journeys and slashing front-desk queues. Operators appreciate reduced magnetic-stripe demagnetization complaints, while guests embrace single-gesture access. This use case foregrounds experiential gains over fraud reduction, broadening the narrative driving the biometric card market.
Geography Analysis
APAC Biometric Card Market
Asia Pacific accounted for 38.10% of 2025 global revenue as Japan’s Life Card and China’s digital-payments backbone set early adoption precedents. Local manufacturing kept costs low, and regulators framed biometrics as an inclusion tool for seniors or rural citizens less comfortable with smartphones. Rising domestic chip capabilities mean regional suppliers now compete head-to-head with European incumbents for international tenders.
North America Biometric Card Market
North America follows, propelled by issuers facing interchange erosion and stray-chargeback exposure. Financial brands trial fingerprint cards with metal substrates to court affluent travelers, while regional banks view the technology as a retention perk amid fintech competition. Regulatory clarity around strong-customer authentication remains less prescriptive than Europe, but consumer expectation for seamless security provides market momentum.
EMEA Biometric Card Market
The Middle East heads growth tables with a 66.4% CAGR as Saudi Vision 2030 and UAE smart-city blueprints funnel funds into digital-ID and cashless-society programs. Government procurement accelerates certification cycles, evidenced by IDEX Biometrics’ 10,000-unit Visa order. Africa shows nascent traction through Pan-African financial-inclusion drives that blend payment capability with national-ID features, though unreliable power and POS coverage restrain near-term volume. Europe continues to benefit from PSD2 mandates, but market maturation tempers its relative pace compared with emerging regions, even as contactless ubiquity keeps baseline demand strong in the biometric card market.
Regulatory Landscape
Biometric cards operate under a layered compliance stack where payment acceptance and identity use cases are shaped by EMVCo evaluation processes and national identity standards. EMVCo has formalized security and performance requirements for biometric payment cards, including a fingerprint sensor assessment process aligned to chip security evaluation frameworks that suppliers must clear to reach Visa and Mastercard programs. Standardization has also progressed with ISO/IEC 17839-1:2025, which defines core requirements for Biometric System-on-Card (BSoC) architectures in ID-1 and ID-T form factors, supporting more consistent integration across issuers, card manufacturers, and component vendors.
In government and access-control environments, procurement and technical rules influence component selection and certification timelines. NIST’s FIPS 201-3 Personal Identity Verification (PIV) standard anchors U.S. federal identity credentials, and the FY2026 NDAA (Section 857A) mandates FIPS 201-3 certification for biometric readers in federal facilities and contractor systems, raising the emphasis on validated cryptographic and reader compliance for biometric access ecosystems. These schemes sit alongside digital identity programs such as Australia’s Digital ID data standards, so biometric-card deployments need to align with both payment-network approvals and jurisdiction-specific identity and privacy expectations.
Value Chain Analysis
The biometric card value chain starts with biometric sensor and module suppliers (notably IDEX Biometrics and Fingerprint Cards), secure element and payment chipset providers (including Infineon and STMicroelectronics), and then moves into card manufacturing and personalization through specialist bureaus and card makers (including Biosmart, Kona, and SPS, an IN Groupe subsidiary). Payment networks (Visa and Mastercard) sit at the orchestration layer through certification, approvals, and program rules that gate volume rollouts. Recent Visa certification activity around solutions such as Infineon SECORA Pay Bio and multiple Mastercard Letters of Approval (LoA) for IDEX Pay-based cards show how network validation remains a critical throughput constraint.
Industrialization and scaling concentrate on embedding, milling, lamination, and quality-control steps used to integrate sensors, secure elements, antennas, and power components into ID-1 thickness, with yield management continuing to be a key bottleneck for mass issuance. The go-to-market approach also leans toward premium and targeted programs that absorb higher unit costs, including commercial launches such as LIFE CARD and IDEX Biometrics in Japan (January 2025), and a biometric metal credit card launched by Mastercard, Eastern Bank PLC, and IDEX Biometrics in Bangladesh (July 2025). Distribution typically runs through issuers and their personalization partners, while enrollment devices and processes increasingly shape end-to-end delivery time, fraud performance, and customer activation rates.
Competitive Landscape
Competition spans component makers, operating-system vendors, and card-personalization bureaus, producing a moderately fragmented field where few players dominate entire stacks. Fingerprint sensor intellectual property remains concentrated, yet secure-element chips see more entrants as legacy smart-card providers adapt firmware for biometric match-on-card. Card manufacturers leverage existing embossing lines and regional personalization centers to win issuer contracts, partnering with sensor houses for reference designs.
EMVCo’s registry lists multiple Visa- and Mastercard-certified biometric configurations, signaling that technical entry barriers are falling, even as scale manufacturing hurdles persist. Strategic alliances emerge: Infineon pairs with Fingerprint Cards, Thales integrates its bio-sourced PLA substrates, and Idemia collaborates on recycled PVC, aligning technology with sustainability narratives. Niche players target crypto custody, healthcare, or logical access, sidestepping pure payment battles.
Recent bankruptcies underscore capital-intensive dynamics: Zwipe’s 2025 collapse followed failed funding rounds despite strong pilot funnel, illustrating liquidity risk when certification delays meet high fixed costs. By contrast, large payment-network initiatives to remove printed card numbers by 2030 validate biometric paradigms and reassure investors, reinforcing long-term attractiveness of the biometric card market.
Biometric Card Industry Leaders
-
Zwipe AS
-
Thales Group
-
IDEX Biometrics ASA
-
STMicroelectronics NV
-
Visa Inc
- *Disclaimer: Major Players sorted in no particular order

Biometric Card Market Companies Covered in this Report
- Thales SA
- IDEMIA Group SARL
- IDEX Biometrics ASA
- Zwipe AS
- Fingerprint Cards AB
- STMicroelectronics N.V.
- Infineon Technologies AG
- NXP Semiconductors N.V.
- Giesecke+Devrient GmbH
- Visa Inc.
- Mastercard Incorporated
- Samsung Electronics Co., Ltd. (System LSI Business)
- Goldpac FinTech Holding Limited
- Watchdata Technologies Pte Ltd
- CPI Card Group Inc.
- Seshaasai Business Forms (P) Ltd
- Smartmatic International Holding B.V.
- NEC Corporation
- HID Global Corporation
- Linxens Holding SAS
Market Opportunities and Future Outlook
A near-term whitespace for the biometric card market is the expanding addressable base of certified testing and interoperable enrollment that reduces time-to-rollout across issuers and geographies. EMVCo continues to develop and embed biometric-on-card requirements into its evaluation processes, and in March 2026 the Fime laboratory gained EMVCo recognition to test fingerprint biometric sensors against the EMV Biometric Card Specification, adding capacity for vendors to complete qualification cycles. In parallel, ISO/IEC 17839-1:2025 provides a standardized Biometric System-on-Card architecture baseline that supports multi-vendor designs and can lower integration friction for card manufacturers and personalization bureaus.
Regulatory authentication mandates in large domestic payments markets create concrete adoption pathways for hardware-based biometric factors alongside app-based authentication. India’s RBI Authentication Mechanisms for Digital Payment Transactions Directions, 2025 became effective April 1, 2026 and explicitly recognizes biometrics (including fingerprint and facial recognition) as valid authentication factors for domestic digital transactions, while Vietnam’s State Bank moved to require biometric verification for opening bank accounts and issuing payment cards effective January 5, 2026 (Circular 45/2025/TT-NHNN). These changes create opportunities for issuers and program managers to package biometric cards into compliance-led customer journeys (account opening, card issuance, and higher-assurance payments). Industry efforts such as the Smart Payment Association’s work on a biometric payment card enrollment interoperability specification, positioned for formal introduction in 2026, target a recurring barrier cited by deployers: consistent, scalable enrollment across devices, branches, and partners.
Recent Industry Developments in Biometric Card Market
- May 2026: IDEX Biometrics formalized a definitive commercial agreement with ID Centric, including an initial binding purchase order of USD 1.75 million for sensor deliveries. The deal moves beyond pilots into committed volume procurement and ties biometric card and ID deployments to a regional implementation partner. It also reinforces a demand signal for sensor supply planning and personalization capacity alignment.
- October 2025: IDEX Biometrics, Hitachi Payment Services, and Airtel Payments Bank launched India’s first RuPay biometric payment card. The program extends biometric cards into a large domestic scheme ecosystem, broadening acceptance pathways beyond Visa and Mastercard-only pilots. It also links biometric authentication to local issuance and switching infrastructure, which can speed up replication by other issuers on the same rails.
- November 2024: Biosmart received a Mastercard Letter of Approval for biometric payment cards based on the IDEX Pay platform. Network approval strengthens the manufacturing and personalization layer of the ecosystem by enabling additional certified production sources. It also supports multi-supplier scaling by giving issuers more options to source compliant cards for rollout programs.
Biometric Card Market Report Scope and Research Methodology
Market Definition and Coverage
This market covers biometric cards that store biometric data and use on-card fingerprint matching to confirm the user. Revenue is counted from the sale of biometric cards used for payments, access, and identity use cases across regions.
Scope exclusions: We exclude standalone biometric readers, mobile biometric authentication apps, and pure software identity platforms that are not tied to a biometric card shipment.
Segments Covered in This Report
- By Card Type
- Credit Cards
- Debit Cards
- Hybrid / Dual-interface Cards
- By Application
- Payments
- Access Control
- Government ID and Financial Inclusion
- Other Applications
- By End-User Vertical
- Banking, Financial Services and Insurance
- Retail
- Government
- Healthcare
- Commercial Entities
- By Geography
- North America
- United States
- Canada
- Mexico
- South America
- Brazil
- Argentina
- Rest of South America
- Europe
- Germany
- United Kingdom
- France
- Italy
- Rest of Europe
- Asia Pacific
- China
- Japan
- India
- South Korea
- Australia and New Zealand
- Rest of Asia Pacific
- Middle East
- Saudi Arabia
- United Arab Emirates
- Turkey
- Rest of Middle East
- Africa
- South Africa
- Nigeria
- Kenya
- Rest of Africa
- North America
Data Sources, Market Sizing, and Validation
Desk Research
For desk research, we start with official and technical signals that explain where biometric cards are getting deployed and which requirements drive adoption. Sources we typically refer to include standards and certification material from EMVCo, guidance from the FIDO Alliance, and public publications from the ISO/IEC smart card and biometrics standards family.
To anchor the demand side, we also review central bank and payments regulator releases (for contactless limits and authentication rules), trade and customs statistics where card and module shipments can be tracked at a high level, and peer-reviewed journals that cover on-card matching performance and sensor integration. These are complemented with company filings, investor decks, and trusted press coverage that discuss pilot rollouts, conversion plans, and manufacturing capacity, plus selective use of paid subscriptions for company financials and patent databases when details are not available in public pages. The sources listed here are illustrative, and many other public references were reviewed for data collection, cross-checking, and clarification.
Primary Interviews and Surveys
Primary interviews are used to verify what is actually shipping versus what is being piloted, and to align assumptions around pricing and adoption timing. We speak with card ecosystem stakeholders such as card manufacturers, component suppliers, payment ecosystem participants, and enterprise or public sector users, and we cover APAC, EMEA, and the Americas so regional rollout patterns are not generalized beyond what respondents report.
Distribution of primary research fieldwork respondents
| Company type | Respondent position | Region |
|---|---|---|
| Top tier: 28% | CXOs: 13% | APAC: 45% |
| Mid tier: 52% | Functional/Unit leaders: 32% | EMEA: 33% |
| Smaller Players: 20% | Managers: 55% | Americas: 22% |
Market-Sizing & Forecasting
Market sizing starts with a top-down build where payment card issuance, contactless penetration, and the share of programs adopting biometric authentication are used to reconstruct the addressable demand pool by region. That demand pool is converted into value using an average selling price, adjusted for expected learning-curve effects in sensors and secure element integration, and then checked against known capacity additions and commercialization timelines.
To keep totals realistic, we corroborate the model with selective bottom-up approximations such as sampled program volumes, shipment indications from the card supply chain, and channel checks on pilot to rollout conversion. Where a direct read is missing, gaps are handled through conservative adoption ramps tied to measurable triggers like certification progress, issuer rollout waves, and enrollment workflow readiness.
For forecasting, scenario analysis is used so the model can reflect uncertainty in mass issuance timing and price erosion. The main scenario inputs include biometric enrollment friction, issuance cycle timing, contactless transaction growth, regulatory acceptance of biometric authentication in payments, and the pace at which ASPs move from pilot pricing toward scaled pricing, then aligned with expert feedback from interviews.
Data Validation & Update Cycle
Validation is done through several passes of variance checks. Outputs are compared with independent signals such as announced pilots, certification milestones, and visible capacity trends in the card supply chain. When the model shows step changes that do not match these signals, assumptions are revisited and, if needed, a subset of respondents are re-contacted to confirm what changed.
Before sign-off, estimates are reviewed by another analyst to ensure calculation logic, currency treatment, and input ranges are consistent across regions. Reports are refreshed annually, and interim updates are made when material events occur, such as major issuer rollouts, changes in certification rules, or meaningful pricing shifts. Right before delivery, a final refresh pass is run so the numbers reflect the latest public signals and validated assumptions.
Mordor Intelligence's Biometric Card Market Size Compared With Other Published Estimates
Published figures for biometric cards can look far apart because the market is still moving from pilots to scaled issuance, which makes timing and price assumptions more influential than in more mature segments. Differences also come from how broadly the card definition is set, and whether the value is counted at a component level or at a full card shipment level.
In practice, the largest gaps usually come from how average selling prices are carried forward, which exchange rate timing is applied for multi-region rollups, and whether near-term pilot shipments are treated as recurring demand. By refreshing price curves and currency conversions close to the publication window, then re-checking them against interview feedback and visible rollout milestones, Mordor Intelligence reduces overstatement risk during fast price declines and avoids understating demand when conversion programs accelerate.
Benchmark comparison
| Source | Market Size | Gaps in Research Methodology |
|---|---|---|
| Mordor Intelligence | USD 1.01 B (2025) | |
| Trade Journal A | USD 12.60 B (2022) | The figure is presented as a broad biometric cards market and appears to include a wider set of card types and use cases, while also reflecting an earlier-year pricing environment that can inflate value when applied to later-year volumes. |
| Industry Publication B | USD 12.23 B (2024) | This estimate is framed as biometric smart cards and can capture adjacent smart card applications and biometric modalities beyond payment-focused fingerprint cards, which increases scope and can blend in legacy smart card revenue. |
The table shows that scope choices and timing choices explain most of the spread, not just math differences. When card boundaries are kept tight and ASPs are updated to reflect scale effects, the market value lands closer to what near-term issuance and rollout readiness can support, and the steps can be repeated as new programs move from pilots to volume deployments.
Key Questions Answered in the Report
What is the forecast value of the biometric card market by 2031?
The market is projected to reach USD 17.09 billion by 2031, reflecting a 60.2% CAGR from 2026.
Which card type leads adoption of fingerprint authentication?
Debit cards remain the primary vehicle, accounting for 51.62% of 2025 revenue due to their ubiquity in everyday spending.
Why are hybrid dual-interface cards growing so quickly?
They unify contact and contactless modes, simplify issuer inventory, and appeal to consumers seeking the same biometric routine across payment environments, driving a 62.1% CAGR.
Which region is expanding the fastest for biometric cards?
The Middle East is growing at a 66.4% CAGR, fueled by Saudi and UAE digital-identity programs.
How do biometric cards address PSD2 compliance?
Fingerprint verification on the card satisfies the “something you have” and “something you are” factors in one step, eliminating the need for separate devices or OTPs.
What is the main manufacturing challenge for biometric cards today?
Multi-layer construction still suffers from yield losses that raise production costs and limit ready supply, particularly for newer hybrid and metal formats.