| Study Period | 2017 - 2030 |
| Base Year For Estimation | 2024 |
| Forecast Data Period | 2025 - 2030 |
| Market Size (2025) | USD 4.01 Billion |
| Market Size (2030) | USD 5.63 Billion |
| CAGR (2025 - 2030) | 7.03 % |
| Market Concentration | Low |
Major Players*Disclaimer: Major Players sorted in no particular order |

Biocontrol Agents Market Analysis
The Biocontrol Agents Market size is estimated at 4.01 billion USD in 2025, and is expected to reach 5.63 billion USD by 2030, growing at a CAGR of 7.03% during the forecast period (2025-2030).
The biocontrol market industry is experiencing a significant transformation driven by the increasing adoption of sustainable agricultural practices and integrated pest management (IPM) approaches. Macrobial biocontrol agents have emerged as the dominant force in the industry, with predators accounting for an impressive 91% of the macrobial segment's market value in 2022, primarily due to their ability to target multiple pest species across different life stages. This shift towards biological pest control solutions reflects a broader industry-wide movement towards environmentally conscious farming practices, supported by government initiatives promoting IPM tools to assist farmers and agricultural advisors.
The technological landscape of biological market agents continues to evolve, particularly in the microbial segment, which reached a valuation of USD 72.9 million in 2022. Fungal biocontrol agents have gained significant traction, representing 53.8% of the microbial segment in 2022, with products like Trichoderma becoming widely adopted for controlling various crop diseases, including root rot, fusarium wilt, and seedling diseases. The advancement in production technologies and formulation methods has enhanced the efficacy and shelf-life of these products, making them increasingly attractive to farmers seeking sustainable pest management solutions.
Major industry players are making strategic investments to expand their production capabilities and meet the growing demand for biological control market agents. For instance, in October 2022, Koppert announced significant investments in three new production units in Brazil, including an 8,000-square-meter formulation facility dedicated to producing their complete microbiological line of products. This expansion trend reflects the industry's response to increasing market demand and the need for localized production capabilities to serve regional agricultural markets more effectively.
The regulatory landscape is evolving to support the adoption of biocontrol market agents, particularly in Europe, where ambitious targets have been set to increase organic farmland to 25% by 2030. This regulatory support, coupled with the standardization of registration processes and safety assessments, is creating a more favorable environment for pest control market manufacturers and users. The industry is witnessing increased collaboration between research institutions, regulatory bodies, and private companies to develop more effective and environmentally sustainable pest control solutions, driving innovation in both product development and application methodologies.
Global Biocontrol Agents Market Trends
Organic production is at an all-time high in North America and Europe, due to the increasing awareness and Government initiatives.
- Organic agriculture has emerged as a significant contributor to sustainable food systems, with 187 countries practicing it globally. As of 2021, there was 72.3 million ha of organic agricultural land worldwide, with an average increase of 2.9% across all regions from 2018 to 2021. Organic arable land accounted for 14.4 million ha, representing 19.9% of the total organic agricultural land.
- The strongest markets for organic farming are North America and Europe, accounting for 41.0% of the global organic arable land. In 2022, Europe had 6.5 million ha of organic arable land, equivalent to 44.1% of the overall organic arable agricultural area. The most significant crops grown organically in North America and Europe are apples, strawberries, cereals, and olives.
- Developing countries in Asia-Pacific are also joining the organic agriculture movement and becoming self-sufficient in producing and providing fresh organic produce to meet their domestic demand. The trend of organic farming is gaining momentum in Asia-Pacific, with the region recording an 18.8% increase in organic arable land from 2017 to 2022. The major initiatives by governments in the region also play a vital role in the growing trend of organic farming. For example, Japan's Basic Plan for Food, Agriculture, and Rural Areas aims to triple the number of organic farmers and lands by 2030.
- The growth of organic agriculture is driven by the rising awareness of the benefits of organic farming, such as promoting soil health, reducing environmental impacts, and producing healthier food.

Understand The Key Trends Shaping This Market
Download PDF
Per capita spending of organic food majorly observed in United States and Germany, attributed to the consumer demand for healthier and sustainable food
- The organic food market experienced significant growth in the past few years, with global sales reaching USD 120.6 billion in 2020, up from USD 70.8 billion in 2012. The trend toward organic food is being driven by several factors, such as increasing consumer demand for healthier, more sustainable food options and a growing awareness of the environmental impact of conventional agriculture. The global organic food market is expected to continue its growth trend over the coming years.
- According to a survey conducted by the Organic Trade Association in 2021, sales of organic fruits and vegetables increased by around 4.5% in the same year, accounting for 15% of the overall organic sales. North America dominates the market in terms of average spending on organic products, with per capita spending in the United States reaching USD 186.7 in 2021, the highest among all North American countries. Europe is also expected to experience significant growth in the organic food market, with Germany accounting for the highest per capita spending of USD 75.6 in 2021.
- While the organic food market is still dominated by developed countries with high consumer disposable incomes, it is also expected to grow in developing nations. For example, the increasing number of working-class people in the Asia-Pacific region may contribute to the market's expansion due to the growing availability and affordability of organic food products.

Segment Analysis: Form
Macrobials Segment in Biocontrol Agents Market
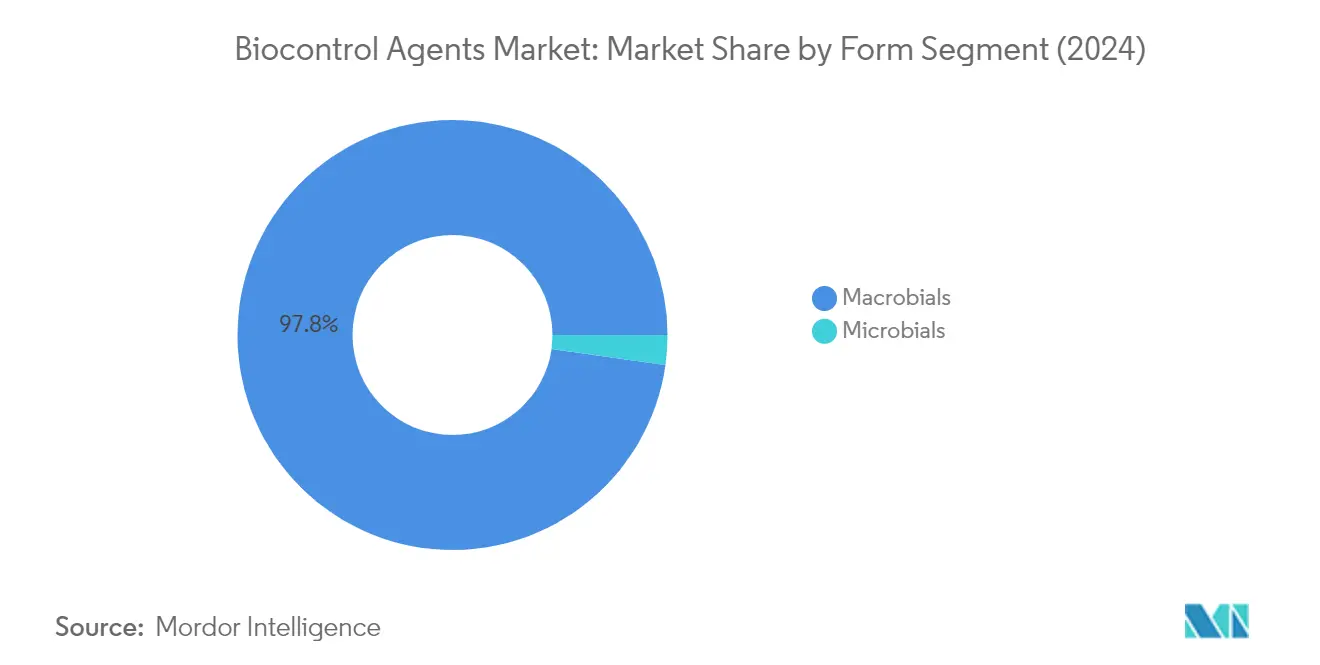
The macrobials segment dominates the global biocontrol agents market, accounting for approximately 98% of the total market value in 2024. This dominance is primarily attributed to the widespread use of predators, which are the most commonly utilized macrobial biocontrol agents due to their easy availability and faster reproductive capacity. Predators have proven particularly effective in controlling various crop pests, especially in cereal crops where they effectively manage aphids, thrips, and mites. The segment's strong performance is further supported by the increasing adoption of integrated pest management practices across different regions worldwide. In the Asia-Pacific region, which represents the largest market for macrobial biocontrol agents, these solutions have demonstrated significant success in controlling pests in both greenhouse and field crop applications.
Microbials Segment in Biocontrol Agents Market
The microbials segment is emerging as the fastest-growing segment in the biocontrol agents market, projected to expand at a rate of approximately 9% between 2024 and 2029. This growth is driven by the increasing adoption of bacterial and fungal biocontrol agents, particularly in row crops and horticultural applications. Microbial agents are gaining popularity due to their ability to be easily multiplied for commercial purposes in laboratories and their higher ease of application compared to macrobial agents. The segment's growth is further supported by ongoing research and development activities focused on enhancing the efficiency of microbial formulations. The rising demand for sustainable agricultural practices and the increasing awareness about the environmental benefits of microbial biocontrol agents are also contributing to the segment's rapid expansion.
Segment Analysis: Crop Type
Row Crops Segment in Biocontrol Agents Market
Row crops dominate the global biocontrol agents market, accounting for approximately 77% of the market value in 2024. This significant market share is primarily attributed to the vast cultivation area of row crops across different regions worldwide. The segment's dominance is particularly evident in the Asia-Pacific region, which accounts for about 73% of the market value. Predators make up the majority of the macrobial biocontrol agents used in row crops, effectively controlling pests like aphids, thrips, and mites that can cause significant damage to cereal crops. The application of biocontrol agents in row crops has tremendous scope as the need for sustainable crop production continues to grow, and farmers increasingly understand their effectiveness in pest management.
Horticultural Crops Segment in Biocontrol Agents Market
The horticultural crops segment is experiencing the fastest growth in the biocontrol agents market, projected to grow at approximately 8% CAGR between 2024 and 2029. This growth is driven by the increasing demand for organic fruits and vegetables, particularly in developed markets. Macrobial biocontrol agents dominate this segment, making up about 94% of the market value. The effectiveness of biocontrol agents in controlling pests and diseases in high-value horticultural crops, combined with the growing consumer preference for chemical-free produce, is driving the segment's growth. The Asia-Pacific region leads in this segment, with significant growth potential in countries focusing on organic horticulture production.
Remaining Segments in Crop Type
The cash crops segment represents a significant portion of the biocontrol agents market, focusing on crops such as cotton, tea, coffee, sugarcane, and rubber. This segment has shown notable adoption of biocontrol agents, particularly in regions like Asia-Pacific where cash crop cultivation is prevalent. The effectiveness of specific biocontrol agents like Bacillus thuringiensis in controlling cotton bollworm and Trichogramma chilonis in mitigating smut disease in sugarcane has contributed to the segment's growth. The segment's importance is further enhanced by the increasing global demand for organically produced commercial crops and the need to reduce chemical pesticide usage in these high-value crops.
Biocontrol Agents Market Geography Segment Analysis
Biocontrol Agents Market in Asia-Pacific
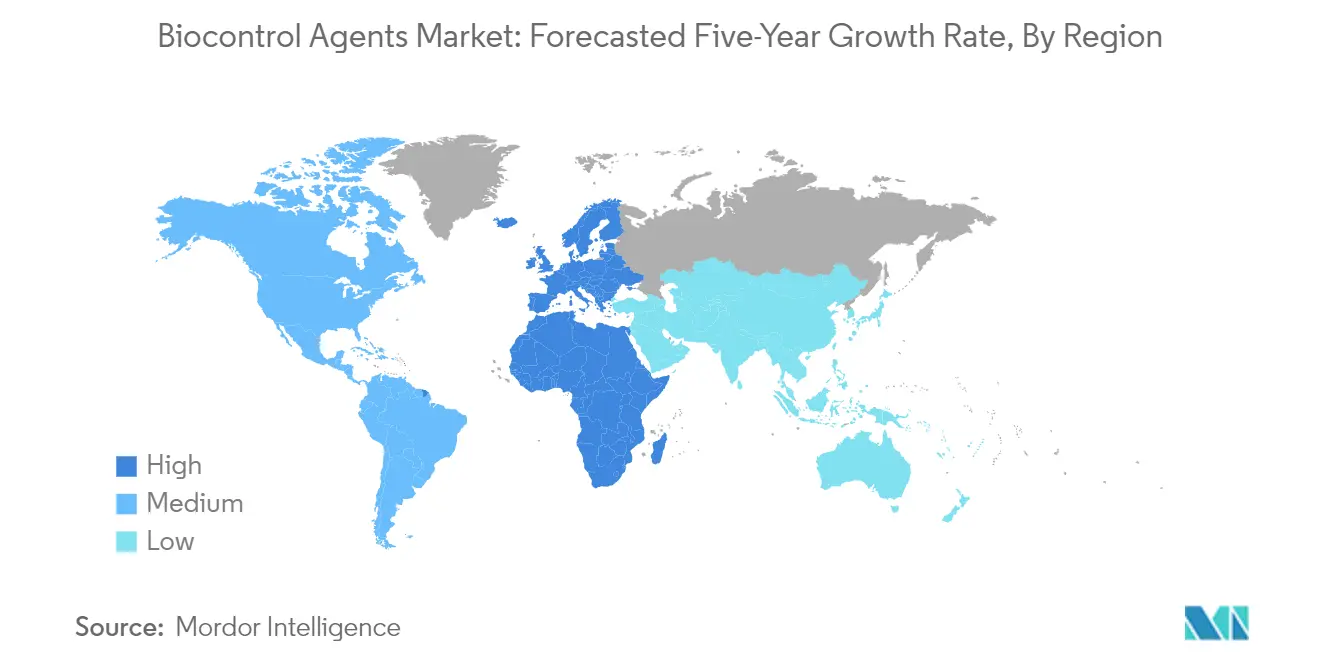
The Asia-Pacific region stands as the dominant force in the global biocontrol agents market, with a diverse range of countries contributing to its growth. The region's leadership is driven by significant agricultural activities across countries like India, China, Japan, and emerging markets such as Indonesia, Thailand, and Vietnam. The increasing adoption of sustainable farming practices, coupled with government initiatives promoting organic agriculture, has created a favorable environment for biocontrol agents. Countries in this region are increasingly focusing on reducing chemical pesticide usage while promoting environmentally friendly alternatives for pest control.
Biocontrol Agents Market in India
India emerges as the powerhouse of the Asia-Pacific biocontrol agents market, commanding approximately 51% of the regional market share in 2024. The country's dominance is attributed to its vast agricultural landscape and the growing adoption of organic farming practices. The Indian government's initiatives to promote sustainable agriculture, including the implementation of various schemes and programs to support organic farming, have significantly contributed to market growth. The country's agricultural sector has shown particular interest in predator-based biocontrol agents, which have proven effective in controlling various crop pests while maintaining ecological balance.
Biocontrol Agents Market in Indonesia
Indonesia represents the most dynamic market in the Asia-Pacific region, with a projected growth rate of approximately 7% between 2024 and 2029. The country's rapid market expansion is driven by increasing awareness about sustainable agriculture and the government's commitment to developing organic farming practices. The Indonesian Ministry of Agriculture has incorporated biocontrol agents as a fundamental component of its pest control system, aligning with the implementation of integrated pest management in agriculture. The country's focus on developing organic villages and promoting sustainable farming practices has created a strong foundation for the continued growth of the biocontrol agents market.
Biocontrol Agents Market in Europe
The European biocontrol agents market demonstrates a strong commitment to sustainable agriculture, supported by robust regulatory frameworks and environmental policies. The region's market is characterized by advanced research and development activities in the biological pest control market, with countries like Russia, Germany, France, and Italy leading the way. The European Union's Farm-to-Fork Strategy, which aims to increase organic farming and reduce chemical pesticide usage, has created a favorable environment for biocontrol agents across the region.
Biocontrol Agents Market in Russia
Russia dominates the European biocontrol agents market, holding approximately 56% of the regional market share in 2024. The country's leadership position is supported by its vast agricultural land and strong focus on sustainable farming practices. Field crops dominate the Russian biocontrol agents market, with protected soil and forestry enterprises being the primary consumers. The country's emphasis on reducing chemical pesticide usage and promoting natural pest control methods has contributed significantly to market growth.
Biocontrol Agents Market in Germany
Germany stands out as the fastest-growing market in Europe, with a projected growth rate of approximately 9% between 2024 and 2029. The country's market expansion is driven by increasing awareness of sustainable agriculture and strong government support for organic farming practices. Germany's robust research and development infrastructure in agricultural biotechnology has facilitated the development and adoption of innovative biocontrol solutions. The country's focus on reducing chemical pesticide usage and promoting integrated pest management has created a strong foundation for market growth.
Biocontrol Agents Market in North America
The North American biocontrol agents market represents a mature and well-established segment of the global industry, characterized by advanced technological adoption and strong regulatory frameworks. The region benefits from extensive research and development activities, with the United States, Canada, and Mexico each contributing uniquely to market growth. The increasing demand for organic products and stringent regulations on chemical pesticide usage have created favorable conditions for biocontrol agent adoption across the region.
Biocontrol Agents Market in United States
The United States leads the North American biocontrol agents market, commanding approximately 29% of the regional market share in 2024. The country's dominant position is supported by its extensive agricultural infrastructure and strong focus on sustainable farming practices. The U.S. market is particularly notable for its high adoption of microbial biocontrol agents, which have proven effective in various agricultural applications. The country's robust research and development ecosystem has facilitated the development of innovative biocontrol solutions.
Biocontrol Agents Market in Mexico
Mexico emerges as the fastest-growing market in North America, with a projected growth rate of approximately 8% between 2024 and 2029. The country's market growth is driven by increasing awareness of sustainable agriculture and strong government support for biological pest control market methods. Mexico has formalized the role of biological control market at both federal and state government levels, with the National Reference Center for Biological Control serving as an international reference center. The country's focus on reducing chemical pesticide usage and promoting integrated pest management has created significant opportunities for market expansion.
Biocontrol Agents Market in Africa
The African biocontrol agents market demonstrates significant potential for growth, with various countries adopting sustainable agricultural practices. The region's market is characterized by increasing awareness of environmental concerns and the need for sustainable pest control solutions. Nigeria leads the market in terms of size, while Egypt shows the fastest growth potential. The implementation of various government initiatives and partnerships with organizations to promote organic farming and connect small-scale farmers to markets is driving the adoption of biocontrol agents across the continent.
Biocontrol Agents Market in Middle East
The Middle Eastern biocontrol agents market, while relatively small in the global context, shows promising growth potential driven by increasing awareness of sustainable agriculture. Saudi Arabia leads the regional market, while Iran demonstrates the fastest growth trajectory. The region's market is characterized by government initiatives to promote organic farming and reduce reliance on chemical pesticides, particularly in countries focusing on developing their agricultural sectors through sustainable practices.
Biocontrol Agents Market in South America
The South American biocontrol agents market is experiencing rapid growth, driven by increasing adoption of sustainable farming practices and growing awareness about the adverse effects of chemical pesticides. Brazil emerges as the largest market in the region, while Argentina shows the fastest growth potential. The region's market is characterized by strong government support for organic farming practices and increasing investments in research and development of biological pest control solutions.
Get Analysis on Important Geographic Markets
Download PDF
Biocontrol Agents Industry Overview
Top Companies in Biocontrol Agents Market
The biocontrol agents market is characterized by companies actively pursuing product innovations and geographical expansions to strengthen their market positions. Companies are investing significantly in research and development to introduce new biocontrol solutions, particularly focusing on enhanced effectiveness and broader pest control spectrums. Strategic partnerships and collaborations with research institutions and agricultural organizations have become increasingly common to develop innovative solutions and expand product portfolios. Market leaders are also prioritizing the establishment of regional production facilities and distribution networks to ensure better market penetration and product availability. Additionally, companies are focusing on educational initiatives to increase farmer awareness about biocontrol benefits and proper application methods, while simultaneously working on improving product shelf life and storage conditions.
Fragmented Market with Regional Specialization Focus
The global biocontrol agents market exhibits a highly fragmented structure, with the top five players accounting for a relatively small portion of the market share. The landscape is characterized by a mix of large multinational corporations and specialized regional players, each bringing unique strengths to the market. While global players leverage their extensive research capabilities and international distribution networks, regional specialists excel in developing solutions tailored to local agricultural conditions and pest challenges. The market has witnessed increasing participation from start-ups and medium-sized companies focusing on niche segments and specific crop protection solutions.
The industry has seen moderate merger and acquisition activity, with larger companies strategically acquiring smaller, innovative firms to expand their product portfolios and geographical presence. Companies are increasingly focusing on vertical integration strategies to maintain better control over product quality and distribution channels. The market structure encourages healthy competition while fostering innovation and specialization, particularly in developing region-specific solutions. This competitive environment has led to increased investment in research and development, with companies striving to differentiate themselves through technological advancement and product effectiveness.
Innovation and Localization Drive Future Success
Success in the biocontrol market increasingly depends on companies' ability to develop effective, user-friendly products while maintaining competitive pricing. Market leaders are focusing on building strong relationships with agricultural communities and establishing demonstration farms to showcase product effectiveness. Companies are also investing in digital platforms and technical support services to provide comprehensive solutions to farmers. The development of integrated pest management solutions, combining different types of biocontrol agents with complementary modes of action, has become a key differentiator for market success. Additionally, companies are working on improving product formulations to enhance stability and shelf life, addressing one of the major challenges in biocontrol agent adoption.
For new entrants and smaller players, success lies in identifying and serving niche markets or specific crop segments where they can build expertise and reputation. Companies need to focus on developing strong distribution networks and establishing partnerships with local agricultural institutions and farmer cooperatives. The regulatory environment is becoming increasingly favorable for biocontrol agents, particularly in regions pushing for reduced chemical pesticide use, creating opportunities for market expansion. However, companies must maintain rigorous quality control and safety standards to build trust with end-users and comply with evolving regulations. The ability to provide comprehensive technical support and education to farmers while maintaining competitive pricing will be crucial for long-term success in this market.
Biocontrol Agents Market Leaders
-
Biobee Ltd
-
Biobest Group NV
-
Bioline AgroSciences Ltd
-
Koppert Biological Systems Inc.
-
VIRIDAXIS SA
- *Disclaimer: Major Players sorted in no particular order

Need More Details on Market Players and Competiters?
Download PDF
Biocontrol Agents Market News
- October 2022: Koppert intends to invest in three new production units in Brazil, ensuring its leadership in the Brazilian and global markets for biological agricultural inputs. ′The new formulation unit will be located on an area of more than 8,000 m2 and will produce the entire microbiological line, including products based on viruses, fungi, and bacteria in liquid or solid formulations.
- September 2022: Andermatt Group AG opened its subsidiary in Mexico under the same segment with an aim to deliver Mexican farms with different biological solutions. This move helped the company strengthen its presence in Mexico.
- August 2022: Biobest announced the acquisition of Agronologica. The acquisition will allow enhanced access to Biobest’s technical expertise, product portfolio, and optimized logistics in Portugal.
Free With This Report
Along with the report, We also offer a comprehensive and exhaustive data pack on Areas under organic cultivation, one of the key trends that affect the market size of agricultural biologicals. This data pack also includes areas under cultivation by crop types, such as Row Crops (Cereals, Pulses, and Oilseeds), Horticultural Crops (Fruits and Vegetables), and Cash Crops in North America, Europe, Asia-Pacific, South America and Africa.


Biocontrol Agents Market Report - Table of Contents
1. EXECUTIVE SUMMARY & KEY FINDINGS
2. REPORT OFFERS
3. INTRODUCTION
- 3.1 Study Assumptions & Market Definition
- 3.2 Scope of the Study
- 3.3 Research Methodology
4. KEY INDUSTRY TRENDS
- 4.1 Area Under Organic Cultivation
- 4.2 Per Capita Spending On Organic Products
-
4.3 Regulatory Framework
- 4.3.1 Australia
- 4.3.2 Brazil
- 4.3.3 Canada
- 4.3.4 China
- 4.3.5 France
- 4.3.6 Germany
- 4.3.7 India
- 4.3.8 Indonesia
- 4.3.9 Italy
- 4.3.10 Japan
- 4.3.11 Mexico
- 4.3.12 Netherlands
- 4.3.13 Philippines
- 4.3.14 Russia
- 4.3.15 Spain
- 4.3.16 Thailand
- 4.3.17 Turkey
- 4.3.18 United Kingdom
- 4.3.19 United States
- 4.3.20 Vietnam
- 4.4 Value Chain & Distribution Channel Analysis
5. MARKET SEGMENTATION (includes market size in Value in USD and Volume, Forecasts up to 2030 and analysis of growth prospects)
-
5.1 Form
- 5.1.1 Macrobials
- 5.1.1.1 By Organism
- 5.1.1.1.1 Entamopathogenic Nematodes
- 5.1.1.1.2 Parasitoids
- 5.1.1.1.3 Predators
- 5.1.2 Microbials
- 5.1.2.1 By Organism
- 5.1.2.1.1 Bacterial Biocontrol Agents
- 5.1.2.1.2 Fungal Biocontrol Agents
- 5.1.2.1.3 Other Microbials
-
5.2 Crop Type
- 5.2.1 Cash Crops
- 5.2.2 Horticultural Crops
- 5.2.3 Row Crops
-
5.3 Region
- 5.3.1 Africa
- 5.3.1.1 By Country
- 5.3.1.1.1 Egypt
- 5.3.1.1.2 Nigeria
- 5.3.1.1.3 South Africa
- 5.3.1.1.4 Rest of Africa
- 5.3.2 Asia-Pacific
- 5.3.2.1 By Country
- 5.3.2.1.1 Australia
- 5.3.2.1.2 China
- 5.3.2.1.3 India
- 5.3.2.1.4 Indonesia
- 5.3.2.1.5 Japan
- 5.3.2.1.6 Philippines
- 5.3.2.1.7 Thailand
- 5.3.2.1.8 Vietnam
- 5.3.2.1.9 Rest of Asia-Pacific
- 5.3.3 Europe
- 5.3.3.1 By Country
- 5.3.3.1.1 France
- 5.3.3.1.2 Germany
- 5.3.3.1.3 Italy
- 5.3.3.1.4 Netherlands
- 5.3.3.1.5 Russia
- 5.3.3.1.6 Spain
- 5.3.3.1.7 Turkey
- 5.3.3.1.8 United Kingdom
- 5.3.3.1.9 Rest of Europe
- 5.3.4 Middle East
- 5.3.4.1 By Country
- 5.3.4.1.1 Iran
- 5.3.4.1.2 Saudi Arabia
- 5.3.4.1.3 Rest of Middle East
- 5.3.5 North America
- 5.3.5.1 By Country
- 5.3.5.1.1 Canada
- 5.3.5.1.2 Mexico
- 5.3.5.1.3 United States
- 5.3.5.1.4 Rest of North America
- 5.3.6 South America
- 5.3.6.1 By Country
- 5.3.6.1.1 Argentina
- 5.3.6.1.2 Brazil
- 5.3.6.1.3 Rest of South America
6. COMPETITIVE LANDSCAPE
- 6.1 Key Strategic Moves
- 6.2 Market Share Analysis
- 6.3 Company Landscape
-
6.4 Company Profiles (includes Global Level Overview, Market Level Overview, Core Business Segments, Financials, Headcount, Key Information, Market Rank, Market Share, Products and Services, and Analysis of Recent Developments).
- 6.4.1 Andermatt Group AG
- 6.4.2 Beneficial Insectary Inc.
- 6.4.3 Biobee Ltd
- 6.4.4 Biobest Group NV
- 6.4.5 Bioline AgroSciences Ltd
- 6.4.6 Bioworks Inc.
- 6.4.7 Henan Jiyuan Baiyun Industry Co. Ltd
- 6.4.8 Koppert Biological Systems Inc.
- 6.4.9 T Stanes and Company Limited
- 6.4.10 VIRIDAXIS SA
7. KEY STRATEGIC QUESTIONS FOR AGRICULTURAL BIOLOGICALS CEOS
8. APPENDIX
-
8.1 Global Overview
- 8.1.1 Overview
- 8.1.2 Porter’s Five Forces Framework
- 8.1.3 Global Value Chain Analysis
- 8.1.4 Market Dynamics (DROs)
- 8.2 Sources & References
- 8.3 List of Tables & Figures
- 8.4 Primary Insights
- 8.5 Data Pack
- 8.6 Glossary of Terms
You Can Purchase Parts Of This Report. Check Out Prices For Specific Sections
Get Price Break-up Now
List of Tables & Figures
- Figure 1:
- AREA UNDER ORGANIC CULTIVATION IN HECTARES, GLOBAL, 2017 - 2022
- Figure 2:
- PER CAPITA SPENDING ON ORGANIC PRODUCTS IN USD, GLOBAL, 2017 - 2022
- Figure 3:
- GLOBAL BIOCONTROL AGENTS MARKET, VOLUME, GRAM, 2017 - 2029
- Figure 4:
- GLOBAL BIOCONTROL AGENTS MARKET, VALUE, USD, 2017 - 2029
- Figure 5:
- BIOCONTROL AGENTS CONSUMPTION IN GRAM, GLOBAL, 2017 - 2029
- Figure 6:
- BIOCONTROL AGENTS CONSUMPTION IN USD, GLOBAL, 2017 - 2029
- Figure 7:
- BIOCONTROL AGENTS CONSUMPTION VOLUME BY FORM IN %, GLOBAL, 2017 VS 2023 VS 2029
- Figure 8:
- BIOCONTROL AGENTS CONSUMPTION VALUE BY FORM IN %, GLOBAL, 2017 VS 2023 VS 2029
- Figure 9:
- MACROBIALS CONSUMPTION IN GRAM, GLOBAL, 2017 - 2029
- Figure 10:
- MACROBIALS CONSUMPTION IN USD, GLOBAL, 2017 - 2029
- Figure 11:
- MACROBIALS CONSUMPTION VOLUME BY ORGANISM IN %, GLOBAL, 2017 VS 2023 VS 2029
- Figure 12:
- MACROBIALS CONSUMPTION VALUE BY ORGANISM IN %, GLOBAL, 2017 VS 2023 VS 2029
- Figure 13:
- ENTAMOPATHOGENIC NEMATODES CONSUMPTION IN GRAM, GLOBAL, 2017 - 2029
- Figure 14:
- ENTAMOPATHOGENIC NEMATODES CONSUMPTION IN USD, GLOBAL, 2017 - 2029
- Figure 15:
- ENTAMOPATHOGENIC NEMATODES CONSUMPTION VALUE BY CROP TYPE IN %, GLOBAL, 2022 VS 2029
- Figure 16:
- PARASITOIDS CONSUMPTION IN GRAM, GLOBAL, 2017 - 2029
- Figure 17:
- PARASITOIDS CONSUMPTION IN USD, GLOBAL, 2017 - 2029
- Figure 18:
- PARASITOIDS CONSUMPTION VALUE BY CROP TYPE IN %, GLOBAL, 2022 VS 2029
- Figure 19:
- PREDATORS CONSUMPTION IN GRAM, GLOBAL, 2017 - 2029
- Figure 20:
- PREDATORS CONSUMPTION IN USD, GLOBAL, 2017 - 2029
- Figure 21:
- PREDATORS CONSUMPTION VALUE BY CROP TYPE IN %, GLOBAL, 2022 VS 2029
- Figure 22:
- MICROBIALS CONSUMPTION IN GRAM, GLOBAL, 2017 - 2029
- Figure 23:
- MICROBIALS CONSUMPTION IN USD, GLOBAL, 2017 - 2029
- Figure 24:
- MICROBIALS CONSUMPTION VOLUME BY ORGANISM IN %, GLOBAL, 2017 VS 2023 VS 2029
- Figure 25:
- MICROBIALS CONSUMPTION VALUE BY ORGANISM IN %, GLOBAL, 2017 VS 2023 VS 2029
- Figure 26:
- BACTERIAL BIOCONTROL AGENTS CONSUMPTION IN GRAM, GLOBAL, 2017 - 2029
- Figure 27:
- BACTERIAL BIOCONTROL AGENTS CONSUMPTION IN USD, GLOBAL, 2017 - 2029
- Figure 28:
- BACTERIAL BIOCONTROL AGENTS CONSUMPTION VALUE BY CROP TYPE IN %, GLOBAL, 2022 VS 2029
- Figure 29:
- FUNGAL BIOCONTROL AGENTS CONSUMPTION IN GRAM, GLOBAL, 2017 - 2029
- Figure 30:
- FUNGAL BIOCONTROL AGENTS CONSUMPTION IN USD, GLOBAL, 2017 - 2029
- Figure 31:
- FUNGAL BIOCONTROL AGENTS CONSUMPTION VALUE BY CROP TYPE IN %, GLOBAL, 2022 VS 2029
- Figure 32:
- OTHER MICROBIALS CONSUMPTION IN GRAM, GLOBAL, 2017 - 2029
- Figure 33:
- OTHER MICROBIALS CONSUMPTION IN USD, GLOBAL, 2017 - 2029
- Figure 34:
- OTHER MICROBIALS CONSUMPTION VALUE BY CROP TYPE IN %, GLOBAL, 2022 VS 2029
- Figure 35:
- BIOCONTROL AGENTS CONSUMPTION IN GRAM, GLOBAL, 2017 - 2029
- Figure 36:
- BIOCONTROL AGENTS CONSUMPTION IN USD, GLOBAL, 2017 - 2029
- Figure 37:
- BIOCONTROL AGENTS CONSUMPTION VOLUME BY CROP TYPE IN %, GLOBAL, 2017 VS 2023 VS 2029
- Figure 38:
- BIOCONTROL AGENTS CONSUMPTION VALUE BY CROP TYPE IN %, GLOBAL, 2017 VS 2023 VS 2029
- Figure 39:
- BIOCONTROL AGENTS CONSUMPTION BY CASH CROPS IN GRAM, GLOBAL, 2017 - 2029
- Figure 40:
- BIOCONTROL AGENTS CONSUMPTION BY CASH CROPS IN USD, GLOBAL, 2017 - 2029
- Figure 41:
- BIOCONTROL AGENTS CONSUMPTION VALUE BY FORM IN %, GLOBAL, 2022 VS 2029
- Figure 42:
- BIOCONTROL AGENTS CONSUMPTION BY HORTICULTURAL CROPS IN GRAM, GLOBAL, 2017 - 2029
- Figure 43:
- BIOCONTROL AGENTS CONSUMPTION BY HORTICULTURAL CROPS IN USD, GLOBAL, 2017 - 2029
- Figure 44:
- BIOCONTROL AGENTS CONSUMPTION VALUE BY FORM IN %, GLOBAL, 2022 VS 2029
- Figure 45:
- BIOCONTROL AGENTS CONSUMPTION BY ROW CROPS IN GRAM, GLOBAL, 2017 - 2029
- Figure 46:
- BIOCONTROL AGENTS CONSUMPTION BY ROW CROPS IN USD, GLOBAL, 2017 - 2029
- Figure 47:
- BIOCONTROL AGENTS CONSUMPTION VALUE BY FORM IN %, GLOBAL, 2022 VS 2029
- Figure 48:
- BIOCONTROL AGENTS CONSUMPTION IN GRAM, GLOBAL, 2017 - 2029
- Figure 49:
- BIOCONTROL AGENTS CONSUMPTION IN USD, GLOBAL, 2017 - 2029
- Figure 50:
- BIOCONTROL AGENTS CONSUMPTION VOLUME BY REGION IN %, GLOBAL, 2017 VS 2023 VS 2029
- Figure 51:
- BIOCONTROL AGENTS CONSUMPTION VALUE BY REGION IN %, GLOBAL, 2017 VS 2023 VS 2029
- Figure 52:
- BIOCONTROL AGENTS CONSUMPTION IN GRAM, AFRICA, 2017 - 2029
- Figure 53:
- BIOCONTROL AGENTS CONSUMPTION IN USD, AFRICA, 2017 - 2029
- Figure 54:
- BIOCONTROL AGENTS CONSUMPTION VOLUME BY COUNTRY IN %, AFRICA, 2017 VS 2023 VS 2029
- Figure 55:
- BIOCONTROL AGENTS CONSUMPTION VALUE BY COUNTRY IN %, AFRICA, 2017 VS 2023 VS 2029
- Figure 56:
- BIOCONTROL AGENTS CONSUMPTION IN GRAM, EGYPT, 2017 - 2029
- Figure 57:
- BIOCONTROL AGENTS CONSUMPTION IN USD, EGYPT, 2017 - 2029
- Figure 58:
- BIOCONTROL AGENTS CONSUMPTION VALUE BY FORM IN %, EGYPT, 2022 VS 2029
- Figure 59:
- BIOCONTROL AGENTS CONSUMPTION IN GRAM, NIGERIA, 2017 - 2029
- Figure 60:
- BIOCONTROL AGENTS CONSUMPTION IN USD, NIGERIA, 2017 - 2029
- Figure 61:
- BIOCONTROL AGENTS CONSUMPTION VALUE BY FORM IN %, NIGERIA, 2022 VS 2029
- Figure 62:
- BIOCONTROL AGENTS CONSUMPTION IN GRAM, SOUTH AFRICA, 2017 - 2029
- Figure 63:
- BIOCONTROL AGENTS CONSUMPTION IN USD, SOUTH AFRICA, 2017 - 2029
- Figure 64:
- BIOCONTROL AGENTS CONSUMPTION VALUE BY FORM IN %, SOUTH AFRICA, 2022 VS 2029
- Figure 65:
- BIOCONTROL AGENTS CONSUMPTION IN GRAM, REST OF AFRICA, 2017 - 2029
- Figure 66:
- BIOCONTROL AGENTS CONSUMPTION IN USD, REST OF AFRICA, 2017 - 2029
- Figure 67:
- BIOCONTROL AGENTS CONSUMPTION VALUE BY FORM IN %, REST OF AFRICA, 2022 VS 2029
- Figure 68:
- BIOCONTROL AGENTS CONSUMPTION IN GRAM, ASIA-PACIFIC, 2017 - 2029
- Figure 69:
- BIOCONTROL AGENTS CONSUMPTION IN USD, ASIA-PACIFIC, 2017 - 2029
- Figure 70:
- BIOCONTROL AGENTS CONSUMPTION VOLUME BY COUNTRY IN %, ASIA-PACIFIC, 2017 VS 2023 VS 2029
- Figure 71:
- BIOCONTROL AGENTS CONSUMPTION VALUE BY COUNTRY IN %, ASIA-PACIFIC, 2017 VS 2023 VS 2029
- Figure 72:
- BIOCONTROL AGENTS CONSUMPTION IN GRAM, AUSTRALIA, 2017 - 2029
- Figure 73:
- BIOCONTROL AGENTS CONSUMPTION IN USD, AUSTRALIA, 2017 - 2029
- Figure 74:
- BIOCONTROL AGENTS CONSUMPTION VALUE BY FORM IN %, AUSTRALIA, 2022 VS 2029
- Figure 75:
- BIOCONTROL AGENTS CONSUMPTION IN GRAM, CHINA, 2017 - 2029
- Figure 76:
- BIOCONTROL AGENTS CONSUMPTION IN USD, CHINA, 2017 - 2029
- Figure 77:
- BIOCONTROL AGENTS CONSUMPTION VALUE BY FORM IN %, CHINA, 2022 VS 2029
- Figure 78:
- BIOCONTROL AGENTS CONSUMPTION IN GRAM, INDIA, 2017 - 2029
- Figure 79:
- BIOCONTROL AGENTS CONSUMPTION IN USD, INDIA, 2017 - 2029
- Figure 80:
- BIOCONTROL AGENTS CONSUMPTION VALUE BY FORM IN %, INDIA, 2022 VS 2029
- Figure 81:
- BIOCONTROL AGENTS CONSUMPTION IN GRAM, INDONESIA, 2017 - 2029
- Figure 82:
- BIOCONTROL AGENTS CONSUMPTION IN USD, INDONESIA, 2017 - 2029
- Figure 83:
- BIOCONTROL AGENTS CONSUMPTION VALUE BY FORM IN %, INDONESIA, 2022 VS 2029
- Figure 84:
- BIOCONTROL AGENTS CONSUMPTION IN GRAM, JAPAN, 2017 - 2029
- Figure 85:
- BIOCONTROL AGENTS CONSUMPTION IN USD, JAPAN, 2017 - 2029
- Figure 86:
- BIOCONTROL AGENTS CONSUMPTION VALUE BY FORM IN %, JAPAN, 2022 VS 2029
- Figure 87:
- BIOCONTROL AGENTS CONSUMPTION IN GRAM, PHILIPPINES, 2017 - 2029
- Figure 88:
- BIOCONTROL AGENTS CONSUMPTION IN USD, PHILIPPINES, 2017 - 2029
- Figure 89:
- BIOCONTROL AGENTS CONSUMPTION VALUE BY FORM IN %, PHILIPPINES, 2022 VS 2029
- Figure 90:
- BIOCONTROL AGENTS CONSUMPTION IN GRAM, THAILAND, 2017 - 2029
- Figure 91:
- BIOCONTROL AGENTS CONSUMPTION IN USD, THAILAND, 2017 - 2029
- Figure 92:
- BIOCONTROL AGENTS CONSUMPTION VALUE BY FORM IN %, THAILAND, 2022 VS 2029
- Figure 93:
- BIOCONTROL AGENTS CONSUMPTION IN GRAM, VIETNAM, 2017 - 2029
- Figure 94:
- BIOCONTROL AGENTS CONSUMPTION IN USD, VIETNAM, 2017 - 2029
- Figure 95:
- BIOCONTROL AGENTS CONSUMPTION VALUE BY FORM IN %, VIETNAM, 2022 VS 2029
- Figure 96:
- BIOCONTROL AGENTS CONSUMPTION IN GRAM, REST OF ASIA-PACIFIC, 2017 - 2029
- Figure 97:
- BIOCONTROL AGENTS CONSUMPTION IN USD, REST OF ASIA-PACIFIC, 2017 - 2029
- Figure 98:
- BIOCONTROL AGENTS CONSUMPTION VALUE BY FORM IN %, REST OF ASIA-PACIFIC, 2022 VS 2029
- Figure 99:
- BIOCONTROL AGENTS CONSUMPTION IN GRAM, EUROPE, 2017 - 2029
- Figure 100:
- BIOCONTROL AGENTS CONSUMPTION IN USD, EUROPE, 2017 - 2029
- Figure 101:
- BIOCONTROL AGENTS CONSUMPTION VOLUME BY COUNTRY IN %, EUROPE, 2017 VS 2023 VS 2029
- Figure 102:
- BIOCONTROL AGENTS CONSUMPTION VALUE BY COUNTRY IN %, EUROPE, 2017 VS 2023 VS 2029
- Figure 103:
- BIOCONTROL AGENTS CONSUMPTION IN GRAM, FRANCE, 2017 - 2029
- Figure 104:
- BIOCONTROL AGENTS CONSUMPTION IN USD, FRANCE, 2017 - 2029
- Figure 105:
- BIOCONTROL AGENTS CONSUMPTION VALUE BY FORM IN %, FRANCE, 2022 VS 2029
- Figure 106:
- BIOCONTROL AGENTS CONSUMPTION IN GRAM, GERMANY, 2017 - 2029
- Figure 107:
- BIOCONTROL AGENTS CONSUMPTION IN USD, GERMANY, 2017 - 2029
- Figure 108:
- BIOCONTROL AGENTS CONSUMPTION VALUE BY FORM IN %, GERMANY, 2022 VS 2029
- Figure 109:
- BIOCONTROL AGENTS CONSUMPTION IN GRAM, ITALY, 2017 - 2029
- Figure 110:
- BIOCONTROL AGENTS CONSUMPTION IN USD, ITALY, 2017 - 2029
- Figure 111:
- BIOCONTROL AGENTS CONSUMPTION VALUE BY FORM IN %, ITALY, 2022 VS 2029
- Figure 112:
- BIOCONTROL AGENTS CONSUMPTION IN GRAM, NETHERLANDS, 2017 - 2029
- Figure 113:
- BIOCONTROL AGENTS CONSUMPTION IN USD, NETHERLANDS, 2017 - 2029
- Figure 114:
- BIOCONTROL AGENTS CONSUMPTION VALUE BY FORM IN %, NETHERLANDS, 2022 VS 2029
- Figure 115:
- BIOCONTROL AGENTS CONSUMPTION IN GRAM, RUSSIA, 2017 - 2029
- Figure 116:
- BIOCONTROL AGENTS CONSUMPTION IN USD, RUSSIA, 2017 - 2029
- Figure 117:
- BIOCONTROL AGENTS CONSUMPTION VALUE BY FORM IN %, RUSSIA, 2022 VS 2029
- Figure 118:
- BIOCONTROL AGENTS CONSUMPTION IN GRAM, SPAIN, 2017 - 2029
- Figure 119:
- BIOCONTROL AGENTS CONSUMPTION IN USD, SPAIN, 2017 - 2029
- Figure 120:
- BIOCONTROL AGENTS CONSUMPTION VALUE BY FORM IN %, SPAIN, 2022 VS 2029
- Figure 121:
- BIOCONTROL AGENTS CONSUMPTION IN GRAM, TURKEY, 2017 - 2029
- Figure 122:
- BIOCONTROL AGENTS CONSUMPTION IN USD, TURKEY, 2017 - 2029
- Figure 123:
- BIOCONTROL AGENTS CONSUMPTION VALUE BY FORM IN %, TURKEY, 2022 VS 2029
- Figure 124:
- BIOCONTROL AGENTS CONSUMPTION IN GRAM, UNITED KINGDOM, 2017 - 2029
- Figure 125:
- BIOCONTROL AGENTS CONSUMPTION IN USD, UNITED KINGDOM, 2017 - 2029
- Figure 126:
- BIOCONTROL AGENTS CONSUMPTION VALUE BY FORM IN %, UNITED KINGDOM, 2022 VS 2029
- Figure 127:
- BIOCONTROL AGENTS CONSUMPTION IN GRAM, REST OF EUROPE, 2017 - 2029
- Figure 128:
- BIOCONTROL AGENTS CONSUMPTION IN USD, REST OF EUROPE, 2017 - 2029
- Figure 129:
- BIOCONTROL AGENTS CONSUMPTION VALUE BY FORM IN %, REST OF EUROPE, 2022 VS 2029
- Figure 130:
- BIOCONTROL AGENTS CONSUMPTION IN GRAM, MIDDLE EAST, 2017 - 2029
- Figure 131:
- BIOCONTROL AGENTS CONSUMPTION IN USD, MIDDLE EAST, 2017 - 2029
- Figure 132:
- BIOCONTROL AGENTS CONSUMPTION VOLUME BY COUNTRY IN %, MIDDLE EAST, 2017 VS 2023 VS 2029
- Figure 133:
- BIOCONTROL AGENTS CONSUMPTION VALUE BY COUNTRY IN %, MIDDLE EAST, 2017 VS 2023 VS 2029
- Figure 134:
- BIOCONTROL AGENTS CONSUMPTION IN GRAM, IRAN, 2017 - 2029
- Figure 135:
- BIOCONTROL AGENTS CONSUMPTION IN USD, IRAN, 2017 - 2029
- Figure 136:
- BIOCONTROL AGENTS CONSUMPTION VALUE BY FORM IN %, IRAN, 2022 VS 2029
- Figure 137:
- BIOCONTROL AGENTS CONSUMPTION IN GRAM, SAUDI ARABIA, 2017 - 2029
- Figure 138:
- BIOCONTROL AGENTS CONSUMPTION IN USD, SAUDI ARABIA, 2017 - 2029
- Figure 139:
- BIOCONTROL AGENTS CONSUMPTION VALUE BY FORM IN %, SAUDI ARABIA, 2022 VS 2029
- Figure 140:
- BIOCONTROL AGENTS CONSUMPTION IN GRAM, REST OF MIDDLE EAST, 2017 - 2029
- Figure 141:
- BIOCONTROL AGENTS CONSUMPTION IN USD, REST OF MIDDLE EAST, 2017 - 2029
- Figure 142:
- BIOCONTROL AGENTS CONSUMPTION VALUE BY FORM IN %, REST OF MIDDLE EAST, 2022 VS 2029
- Figure 143:
- BIOCONTROL AGENTS CONSUMPTION IN GRAM, NORTH AMERICA, 2017 - 2029
- Figure 144:
- BIOCONTROL AGENTS CONSUMPTION IN USD, NORTH AMERICA, 2017 - 2029
- Figure 145:
- BIOCONTROL AGENTS CONSUMPTION VOLUME BY COUNTRY IN %, NORTH AMERICA, 2017 VS 2023 VS 2029
- Figure 146:
- BIOCONTROL AGENTS CONSUMPTION VALUE BY COUNTRY IN %, NORTH AMERICA, 2017 VS 2023 VS 2029
- Figure 147:
- BIOCONTROL AGENTS CONSUMPTION IN GRAM, CANADA, 2017 - 2029
- Figure 148:
- BIOCONTROL AGENTS CONSUMPTION IN USD, CANADA, 2017 - 2029
- Figure 149:
- BIOCONTROL AGENTS CONSUMPTION VALUE BY FORM IN %, CANADA, 2022 VS 2029
- Figure 150:
- BIOCONTROL AGENTS CONSUMPTION IN GRAM, MEXICO, 2017 - 2029
- Figure 151:
- BIOCONTROL AGENTS CONSUMPTION IN USD, MEXICO, 2017 - 2029
- Figure 152:
- BIOCONTROL AGENTS CONSUMPTION VALUE BY FORM IN %, MEXICO, 2022 VS 2029
- Figure 153:
- BIOCONTROL AGENTS CONSUMPTION IN GRAM, UNITED STATES, 2017 - 2029
- Figure 154:
- BIOCONTROL AGENTS CONSUMPTION IN USD, UNITED STATES, 2017 - 2029
- Figure 155:
- BIOCONTROL AGENTS CONSUMPTION VALUE BY FORM IN %, UNITED STATES, 2022 VS 2029
- Figure 156:
- BIOCONTROL AGENTS CONSUMPTION IN GRAM, REST OF NORTH AMERICA, 2017 - 2029
- Figure 157:
- BIOCONTROL AGENTS CONSUMPTION IN USD, REST OF NORTH AMERICA, 2017 - 2029
- Figure 158:
- BIOCONTROL AGENTS CONSUMPTION VALUE BY FORM IN %, REST OF NORTH AMERICA, 2022 VS 2029
- Figure 159:
- BIOCONTROL AGENTS CONSUMPTION IN GRAM, SOUTH AMERICA, 2017 - 2029
- Figure 160:
- BIOCONTROL AGENTS CONSUMPTION IN USD, SOUTH AMERICA, 2017 - 2029
- Figure 161:
- BIOCONTROL AGENTS CONSUMPTION VOLUME BY COUNTRY IN %, SOUTH AMERICA, 2017 VS 2023 VS 2029
- Figure 162:
- BIOCONTROL AGENTS CONSUMPTION VALUE BY COUNTRY IN %, SOUTH AMERICA, 2017 VS 2023 VS 2029
- Figure 163:
- BIOCONTROL AGENTS CONSUMPTION IN GRAM, ARGENTINA, 2017 - 2029
- Figure 164:
- BIOCONTROL AGENTS CONSUMPTION IN USD, ARGENTINA, 2017 - 2029
- Figure 165:
- BIOCONTROL AGENTS CONSUMPTION VALUE BY FORM IN %, ARGENTINA, 2022 VS 2029
- Figure 166:
- BIOCONTROL AGENTS CONSUMPTION IN GRAM, BRAZIL, 2017 - 2029
- Figure 167:
- BIOCONTROL AGENTS CONSUMPTION IN USD, BRAZIL, 2017 - 2029
- Figure 168:
- BIOCONTROL AGENTS CONSUMPTION VALUE BY FORM IN %, BRAZIL, 2022 VS 2029
- Figure 169:
- BIOCONTROL AGENTS CONSUMPTION IN GRAM, REST OF SOUTH AMERICA, 2017 - 2029
- Figure 170:
- BIOCONTROL AGENTS CONSUMPTION IN USD, REST OF SOUTH AMERICA, 2017 - 2029
- Figure 171:
- BIOCONTROL AGENTS CONSUMPTION VALUE BY FORM IN %, REST OF SOUTH AMERICA, 2022 VS 2029
- Figure 172:
- GLOBAL BIOCONTROL AGENTS MARKET, MOST ACTIVE COMPANIES, BY NUMBER OF STRATEGIC MOVES, 2017-2022
- Figure 173:
- GLOBAL BIOCONTROL AGENTS MARKET, MOST ADOPTED STRATEGIES, 2017-2022
- Figure 174:
- GLOBAL BIOCONTROL AGENTS MARKET SHARE(%), BY MAJOR PLAYERS
Biocontrol Agents Industry Segmentation
Macrobials, Microbials are covered as segments by Form. Cash Crops, Horticultural Crops, Row Crops are covered as segments by Crop Type. Africa, Asia-Pacific, Europe, Middle East, North America, South America are covered as segments by Region.| Form | Macrobials | By Organism | Entamopathogenic Nematodes | |
| Parasitoids | ||||
| Predators | ||||
| Microbials | By Organism | Bacterial Biocontrol Agents | ||
| Fungal Biocontrol Agents | ||||
| Other Microbials | ||||
| Crop Type | Cash Crops | |||
| Horticultural Crops | ||||
| Row Crops | ||||
| Region | Africa | By Country | Egypt | |
| Nigeria | ||||
| South Africa | ||||
| Rest of Africa | ||||
| Asia-Pacific | By Country | Australia | ||
| China | ||||
| India | ||||
| Indonesia | ||||
| Japan | ||||
| Philippines | ||||
| Thailand | ||||
| Vietnam | ||||
| Rest of Asia-Pacific | ||||
| Europe | By Country | France | ||
| Germany | ||||
| Italy | ||||
| Netherlands | ||||
| Russia | ||||
| Spain | ||||
| Turkey | ||||
| United Kingdom | ||||
| Rest of Europe | ||||
| Middle East | By Country | Iran | ||
| Saudi Arabia | ||||
| Rest of Middle East | ||||
| North America | By Country | Canada | ||
| Mexico | ||||
| United States | ||||
| Rest of North America | ||||
| South America | By Country | Argentina | ||
| Brazil | ||||
| Rest of South America | ||||
Need A Different Region or Segment?
Customize Now
Market Definition
- AVERAGE DOSAGE RATE - The average application rate is the average volume of biocontrol agents applied per hectare of farmland in the respective region/country.
- CROP TYPE - Crop type includes Row crops (Cereals, Pulses, Oilseeds), Horticultural Crops (Fruits and vegetables) and Cash Crops (Plantation Crops, Fibre Crops and Other Industrial Crops)
- FUNCTION - The Crop Protection function of agirucultural biological include products that prevent or control various biotic and abiotic stress.
- TYPE - Biocontrol agents are the natural predators and parasitoids used to control various pests. Biocontrol agents include both microbials (Microorganisms) and macrobials (Insects).
| Keyword | Definition |
|---|---|
| Cash Crops | Cash crops are non-consumable crops sold as a whole or part of the crop to manufacture end-products to make a profit. |
| Integrated Pest Management (IPM) | IPM is an environment-friendly and sustainable approach to control pests in various crops. It involves a combination of methods, including biological controls, cultural practices, and selective use of pesticides. |
| Bacterial biocontrol agents | Bacteria used to control pests and diseases in crops. They work by producing toxins harmful to the target pests or competing with them for nutrients and space in the growing environment. Some examples of commonly used bacterial biocontrol agents include Bacillus thuringiensis (Bt), Pseudomonas fluorescens, and Streptomyces spp. |
| Plant Protection Product (PPP) | A plant protection product is a formulation applied to crops to protect from pests, such as weeds, diseases, or insects. They contain one or more active substances with other co-formulants such as solvents, carriers, inert material, wetting agents or adjuvants formulated to give optimum product efficacy. |
| Pathogen | A pathogen is an organism causing disease to its host, with the severity of the disease symptoms. |
| Parasitoids | Parasitoids are insects that lay their eggs on or within the host insect, with their larvae feeding on the host insect. In agriculture, parasitoids can be used as a form of biological pest control, as they help to control pest damage to crops and decrease the need for chemical pesticides. |
| Entomopathogenic Nematodes (EPN) | Entomopathogenic nematodes are parasitic roundworms that infect and kill pests by releasing bacteria from their gut. Entomopathogenic nematodes are a form of biocontrol agents used in agriculture. |
| Vesicular-arbuscular mycorrhiza (VAM) | VAM fungi are mycorrhizal species of fungus. They live in the roots of different higher-order plants. They develop a symbiotic relationship with the plants in the roots of these plants. |
| Fungal biocontrol agents | Fungal biocontrol agents are the beneficial fungi that control plant pests and diseases. They are an alternative to chemical pesticides. They infect and kill the pests or compete with pathogenic fungi for nutrients and space. |
| Biofertilizers | Biofertilizers contain beneficial microorganisms that enhance soil fertility and promote plant growth. |
| Biopesticides | Biopesticides are natural/bio-based compounds used to manage agricultural pests using specific biological effects. |
| Predators | Predators in agriculture are the organisms that feed on pests and help control pest damage to the crops. Some common predator species used in agriculture include ladybugs, lacewings, and predatory mites. |
| Biocontrol agents | Biocontrol agents are living organisms used to control pests and diseases in agriculture. They are alternatives to chemical pesticides and are known for their lesser impact on the environment and human health. |
| Organic Fertilizers | Organic fertilizer is composed of animal or vegetable matter used alone or in combination with one or more non-synthetically derived elements or compounds used for soil fertility and plant growth. |
| Protein hydrolysates (PHs) | Protein hydrolysate-based biostimulants contain free amino acids, oligopeptides, and polypeptides produced by enzymatic or chemical hydrolysis of proteins, primarily from vegetal or animal sources. |
| Biostimulants/Plant Growth Regulators (PGR) | Biostimulants/Plant Growth Regulators (PGR) are substances derived from natural resources to enhance plant growth and health by stimulating plant processes (metabolism). |
| Soil Amendments | Soil Amendments are substances applied to soil that improve soil health, such as soil fertility and soil structure. |
| Seaweed Extract | Seaweed extracts are rich in micro and macronutrients, proteins, polysaccharides, polyphenols, phytohormones, and osmolytes. These substances boost seed germination and crop establishment, total plant growth and productivity. |
| Compounds related to biocontrol and/or promoting growth (CRBPG) | Compounds related to biocontrol or promoting growth (CRBPG) are the ability of a bacteria to produce compounds for phytopathogen biocontrol and plant growth promotion. |
| Symbiotic Nitrogen-Fixing Bacteria | Symbiotic nitrogen-fixing bacteria such as Rhizobium obtain food and shelter from the host, and in return, they help by providing fixed nitrogen to the plants. |
| Nitrogen Fixation | Nitrogen fixation is a chemical process in soil which converts molecular nitrogen into ammonia or related nitrogenous compounds. |
| ARS (Agricultural Research Service) | ARS is the U.S. Department of Agriculture's chief scientific in-house research agency. It aims to find solutions to agricultural problems faced by the farmers in the country. |
| Phytosanitary Regulations | Phytosanitary regulations imposed by the respective government bodies check or prohibit the importation and marketing of certain insects, plant species, or products of these plants to prevent the introduction or spread of new plant pests or pathogens. |
| Ectomycorrhizae (ECM) | Ectomycorrhiza (ECM) is a symbiotic interaction of fungi with the feeder roots of higher plants in which both the plant and the fungi benefit through the association for survival. |
Need More Details on Market Definition?
Ask a Question
Research Methodology
Mordor Intelligence follows a four-step methodology in all our reports.
- Step-1: Identify Key Variables: In order to build a robust forecasting methodology, the variables and factors identified in Step-1 are tested against available historical market numbers. Through an iterative process, the variables required for market forecast are set and the model is built on the basis of these variables.
- Step-2: Build a Market Model: Market-size estimations for the forecast years are in nominal terms. Inflation is not a part of the pricing, and the average selling price (ASP) is kept constant throughout the forecast period.
- Step-3: Validate and Finalize: In this important step, all market numbers, variables and analyst calls are validated through an extensive network of primary research experts from the market studied. The respondents are selected across levels and functions to generate a holistic picture of the market studied.
- Step-4: Research Outputs: Syndicated Reports, Custom Consulting Assignments, Databases & Subscription Platforms.

Get More Details On Research Methodology
Download PDF


