
Market Overview
| Study Period | 2021 - 2031 |
|---|---|
| Market Volume (2026) | 164.78 gigawatt |
| Market Volume (2031) | 206.59 gigawatt |
| Growth Rate (2026 - 2031) | 4.62 % |
| Fastest Growing Market | Asia Pacific |
| Largest Market | Asia Pacific |
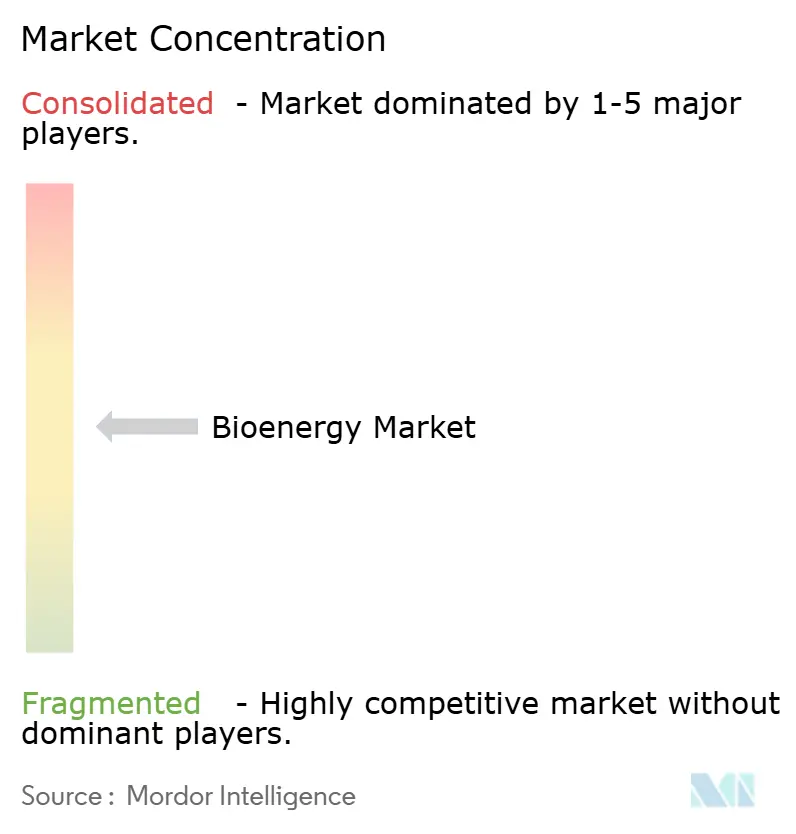
| Market Concentration | Medium |
Major Players *Disclaimer: Major Players sorted in no particular order Image © Mordor Intelligence. Reuse requires attribution under CC BY 4.0. | |
Bioenergy Market Analysis by Mordor Intelligence
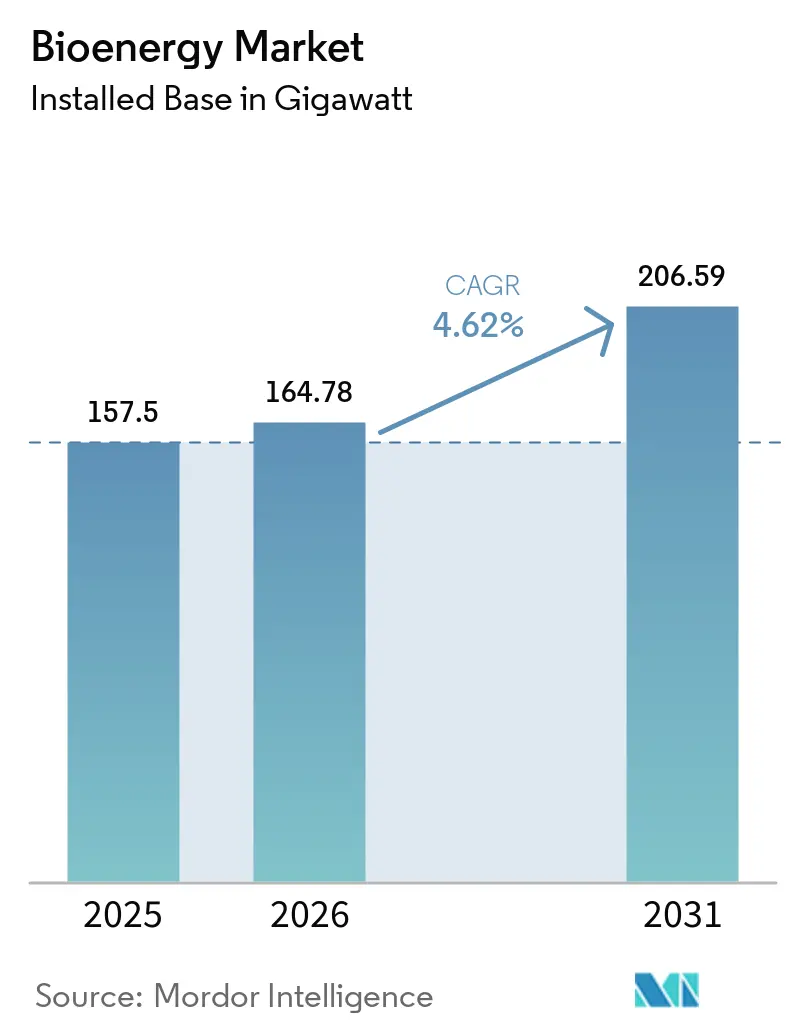
Bioenergy market size in 2026 is estimated at 164.78 gigawatt, growing from 2025 value of 157.5 gigawatt with 2031 projections showing 206.59 gigawatt, growing at 4.62% CAGR over 2026-2031.
Net-zero mandates, ample low-cost residues, and steady technology-driven declines in the levelized cost of electricity underpin expansion. Dispatchable generation capacity and the prospect of negative emissions through bioenergy with carbon capture and storage (BECCS) reinforce sector resilience even as variable renewables widen their footprint across power grids. Aggressive aviation and road-fuel blending rules, rising demand for firm industrial heat, and improved access to carbon markets further tighten the demand outlook. Financing barriers persist, yet project economics continue to improve as advanced gasification, pyrolysis, and anaerobic digestion plants scale faster than predicted only a few years ago. Policy alignment across electricity, fuels, and heavy-industry applications gives the bioenergy market a visibility horizon that still eludes several other renewable segments.
Key Report Takeaways
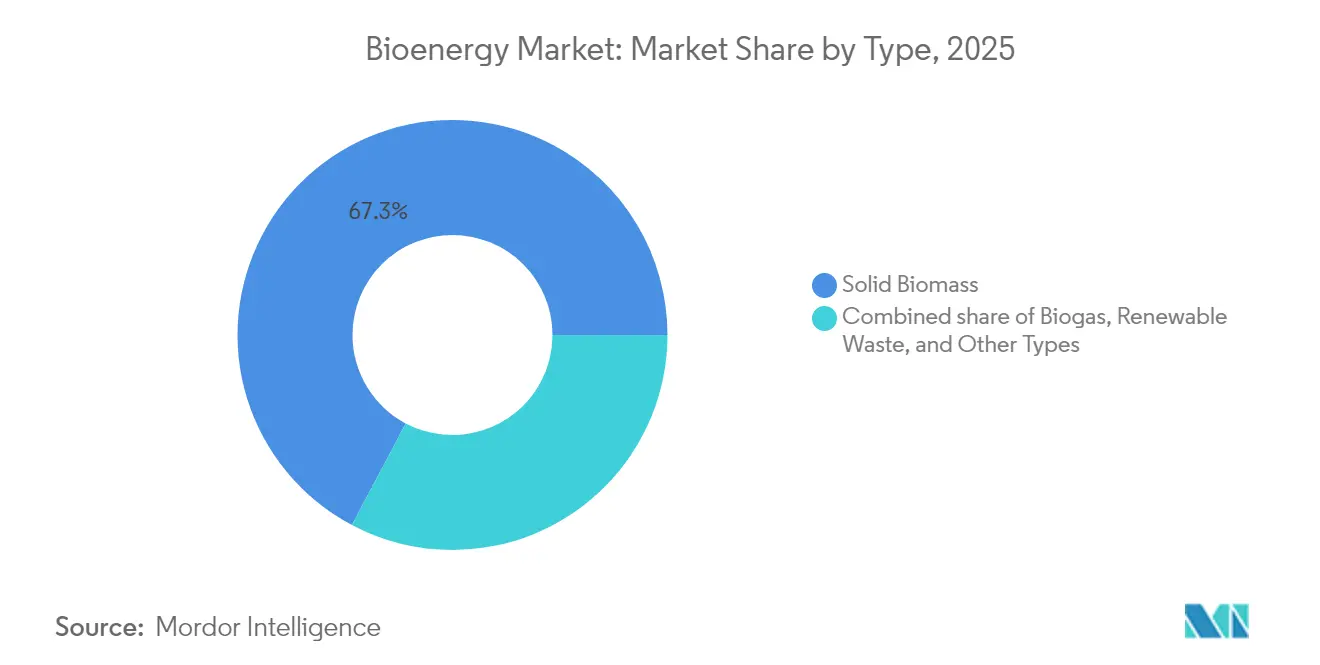
- By type, solid biomass held 67.25% of the bioenergy market share in 2025; biogas is the fastest-growing sub-segment at a 4.84% CAGR through 2031.
- By feedstock, forestry residues accounted for 39.70% of the bioenergy market size in 2025, and agricultural residues advanced at an 8.55% CAGR to 2031.
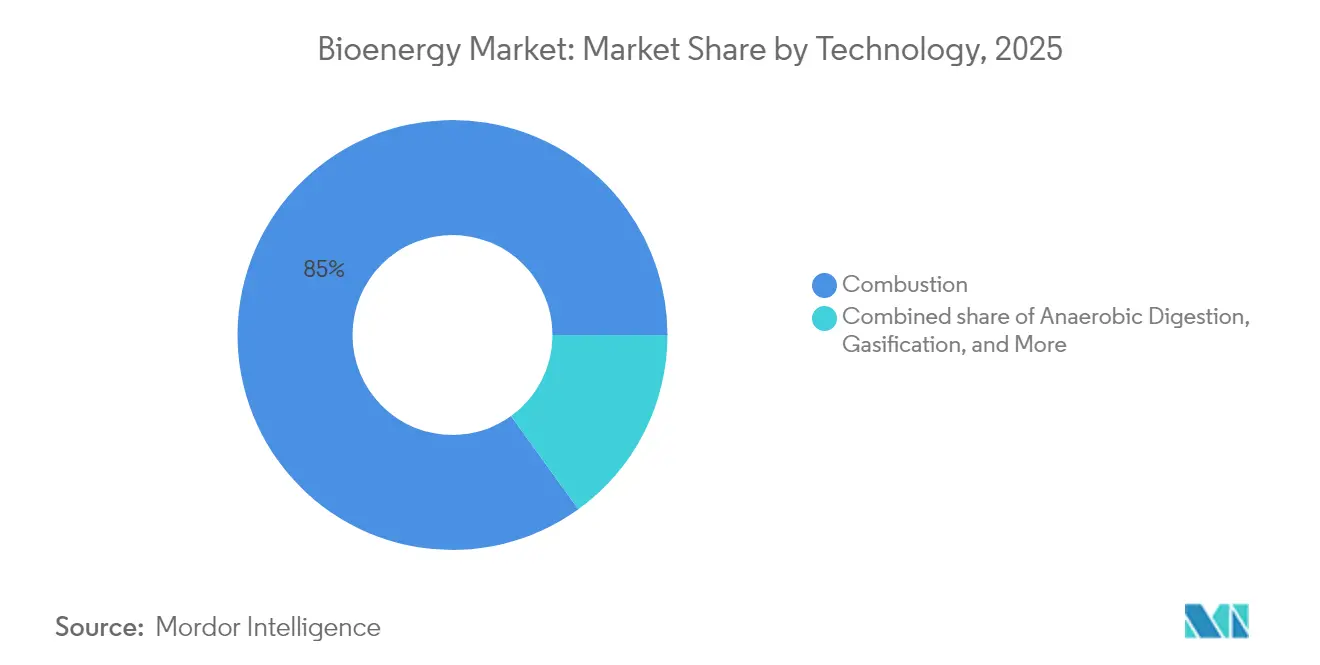
- By technology, combustion commanded 84.95% of 2025 capacity, but anaerobic digestion is projected to grow at a 11.7% CAGR through 2031.
- By application, heat generation retained 57.85% of the bioenergy market size in 2025, whereas transportation fuels exhibit the highest CAGR at 9.35% through 2031.
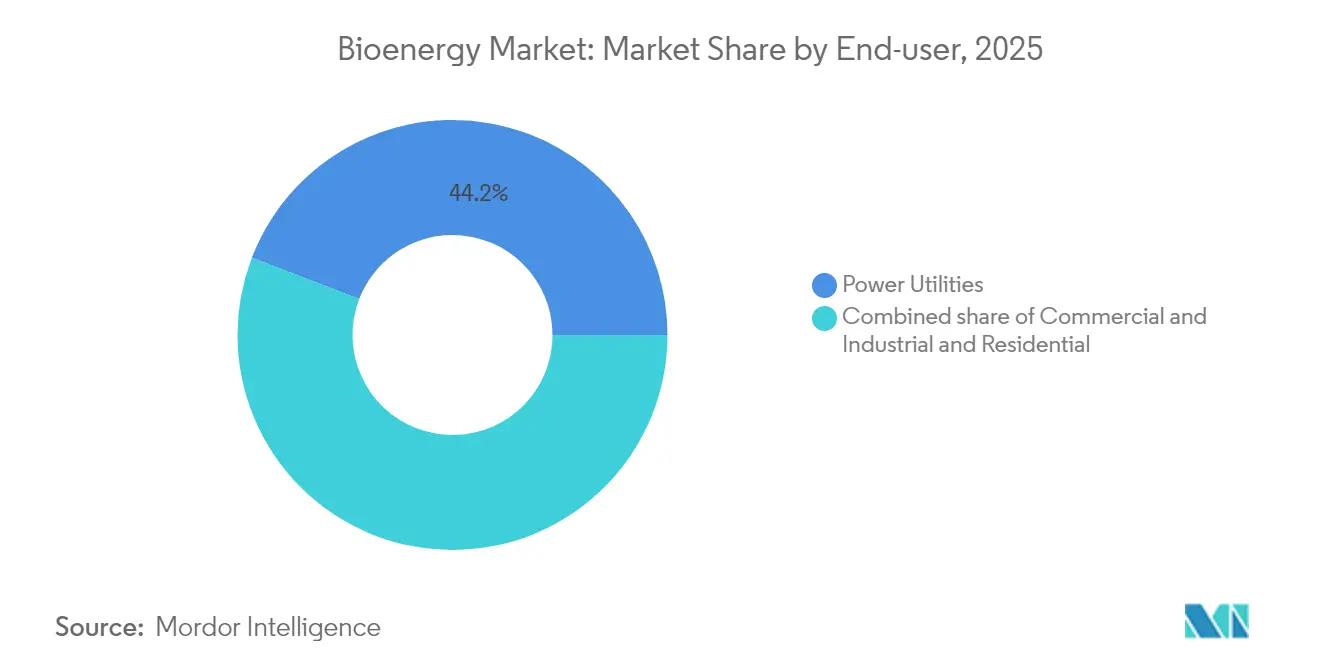
- By end-user, power utilities held a 44.15% share of the bioenergy market size in 2025, while commercial and industrial demand is projected to advance at a 8.75% CAGR between 2026-2031.
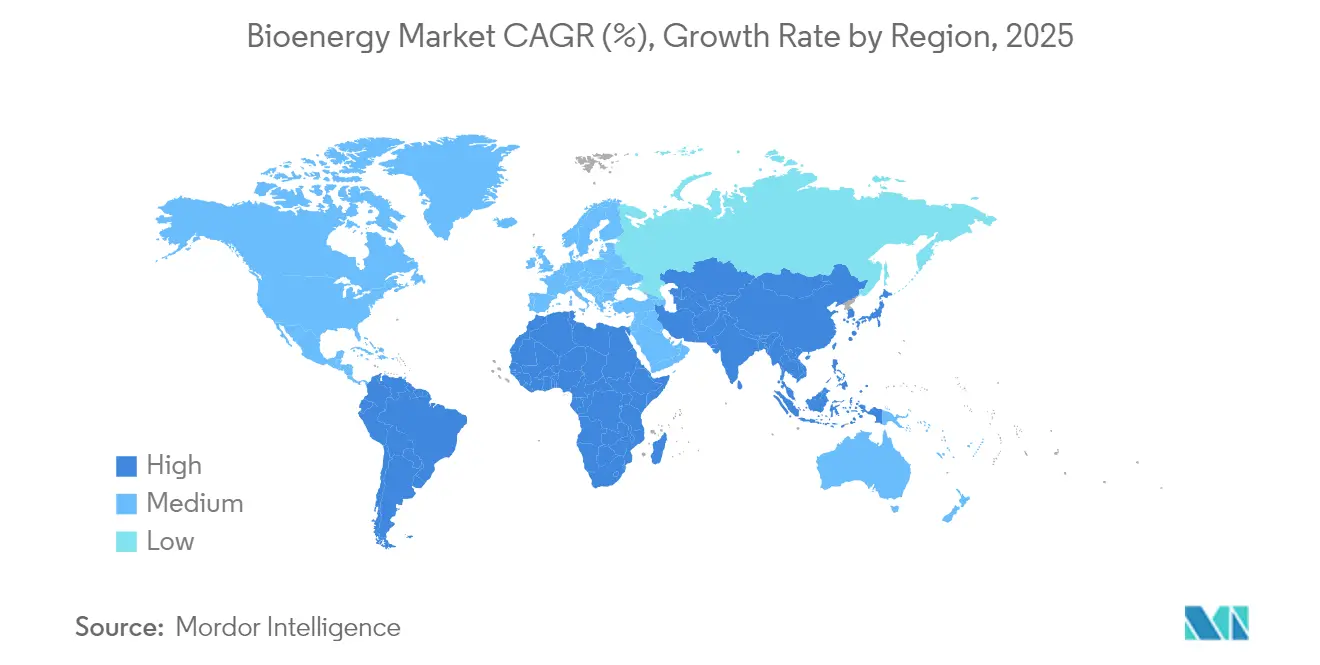
- By geography, Asia-Pacific led with a 43.30% revenue share in 2025 and is also forecast to expand at a 5.95% CAGR to 2031.
Note: Market size and forecast figures in this report are generated using Mordor Intelligence’s proprietary estimation framework, updated with the latest available data and insights as of 2026.
Market Trends and Insights
Drivers Impact Analysis of Bioenergy Market*
| Driver | (~) % Impact on CAGR Forecast | Geographic Relevance | Impact Timeline |
|---|---|---|---|
| Net-zero targets & renewable energy mandates | 1.2% | Global, with EU, US, and APAC leading implementation | Medium term (2-4 years) |
| Abundant low-cost agricultural & forestry residues | 0.9% | Global, concentrated in APAC, North America, and South America | Long term (≥ 4 years) |
| Technology-driven LCOE decline for advanced bioenergy | 0.8% | Global, with early adoption in Europe and North America | Medium term (2-4 years) |
| BECCS incentives & negative-emissions revenue streams | 0.6% | Europe and North America, expanding to APAC | Long term (≥ 4 years) |
| Industrial off-take demand for dispatchable green heat/power | 0.5% | Europe, North America, and industrial APAC regions | Short term (≤ 2 years) |
| Monetisation of biogenic-CO₂ credits | 0.3% | Europe and North America primarily | Medium term (2-4 years) |
| Source: Mordor Intelligence | |||


Net-zero targets & renewable-energy mandates
Mandatory carbon-neutrality trajectories now cover more than 80% of global GDP, with the EU’s 90% net-emissions-reduction goal for 2040, the US Inflation Reduction Act’s funding tranches for advanced fuels, and India’s 20% ethanol blending target converging to lift long-term demand. Broad-based mandates extend to ReFuelEU’s 70% sustainable aviation fuel requirement by 2050 and the UK’s 2% sustainable aviation fuel obligation from 2025. The resulting multi-sector pull allows the bioenergy market to tap into electricity, heating, and transport segments simultaneously. Strong offtake visibility enables developers to structure 15- to 20-year contracts and improve debt tenors. The cross-industry appeal remains a clear competitive edge where intermittent renewable sources struggle to shoulder firm-capacity obligations.[1]European Commission, “Proposal for a 2040 Climate Target,” ec.europa.eu
Abundant low-cost agricultural & forestry residues
The US Department of Energy’s latest Billion-Ton Report shows that sustainable feedstock potential exceeds 1 billion t annually, dwarfing current consumption. India alone produces 180 million t of residues each year, with projected feedstock demand growth of 50% by 2030.[2]International Energy Agency, “World Energy Outlook 2024,” iea.org Evolving geopolitics underline resource-risk asymmetry: Europe’s wood-chip supply tightened after sanctions on Russian and Belarusian products, sending benchmark prices to multi-year highs. Consequently, proximity between feedstock clusters and processing hubs now dictates a meaningful share of total project cost. Companies licensing next-generation preprocessing systems to convert corn stover, rice straw, and palm residues into drop-in fuels illustrate how logistics‐driven value creation often outranks absolute resource abundance.
Technology-driven LCOE decline for advanced bioenergy
Hybrid solar-assisted pyrolysis reduces bio-oil production costs to EUR 18.68 per GJ and increases carbon efficiency to 90.7%, underscoring substantial cost savings compared to conventional thermal treatment. Direct biomass gasification plants reach 62% energy efficiency and outperform indirect bio-oil routes by 9 percentage points. Chemical-looping reforming increases hydrogen yields while reducing CO₂ intensity, and an optimized three-reactor configuration enables negative emissions profiles without compromising throughput. Such performance gains drop the bioenergy market’s mid-scale LCOE below combined-cycle natural-gas peaker tariffs in select regions. Technology convergence also supports modular deployment, enabling smaller developers to close funding rounds that were previously only accessible to utility-scale sponsors.
BECCS incentives & negative-emissions revenue streams
Formal recognition of greenhouse-gas removals reshapes the revenue stack. The UK is integrating BECCS credits into its domestic emissions-trading system, guaranteeing an offtake floor price for captured carbon. Corporate buyers such as Microsoft have signed multi-year removal contracts that now account for the bulk of verified BECCS credit sales in Scandinavia. A single BECCS-enabled plant is poised to remove up to 8 million t CO₂ annually while supplying baseload power. With the International Energy Agency estimating a requirement of 190 million t CO₂ removals by 2030 versus fewer than 2 million t today, early movers can lock in premium pricing and scale advantages.
Restraints Impact Analysis of Bioenergy Market*
| Restraint | (~) % Impact on CAGR Forecast | Geographic Relevance | Impact Timeline |
|---|---|---|---|
| High capital intensity & financing hurdles | -0.8% | Global, particularly affecting emerging markets and smaller developers | Short term (≤ 2 years) |
| Fragmented feed-stock logistics & costs | -0.7% | Global, with acute challenges in developing regions and remote areas | Medium term (2-4 years) |
| Stricter ILUC & sustainability criteria | -0.5% | Global, with EU leading regulatory implementation | Medium term (2-4 years) |
| Competing low-cost battery storage eroding baseload value | -0.4% | Global, with faster impact in markets with high renewable penetration | Long term (≥ 4 years) |
| Source: Mordor Intelligence | |||
High capital intensity & financing hurdles
A single advanced biorefinery can require more than USD 2 billion in equity and debt, making pre-FID capital stacking a multiyear process. Although long-term offtake agreements mitigate merchant-price risks, nascent credit-enhancement frameworks in many developing economies still restrict local-currency debt. Investment costs for combined heat-and-power biomass plants range between EUR 3,410 and EUR 5,970 per kW, significantly higher than those for gas-fired alternatives. Therefore, sponsors increasingly syndicate risk through joint ventures with utilities, EPCs, and feedstock aggregators. Large corporates now anchor equity rounds, but smaller developers continue to face sizable hurdles, especially when carbon-credit revenue is not yet bankable.
Fragmented feedstock logistics & costs
Solid biomass accounts for up to 50% of the delivered energy cost in distributed projects. Seasonality, competing industrial uses, and evolving trade flows alter supply security. Sanctions-driven wood-chip shortages in Northern Europe illustrate how geopolitics can disrupt cost projections within quarters. Transport premiums for low-density residues can add USD 15-25 per t when delivery radii exceed 70 km, eroding margins for mid-scale power plants. Co-location near existing refineries and ports, investment in pelletization hubs, and vertically integrated sourcing models emerge as the favored mitigation pathways. However, the fragmented nature of agricultural residues in Asia and Africa still leaves smaller players exposed to volumetric and price volatility.[3]Cluster Collaboration, “Investment Cost Estimates for Biomass CHP,” clustercollaboration.eu
*Our forecasts treat driver/restraint impacts as directional, not additive. The impact forecasts reflect baseline growth, mix effects, and variable interactions.
Bioenergy Market Segment Analysis
By Type:
Solid Biomass Leads, but Biogas Is Catching UpSolid biomass still does most of the heavy lifting, supplying 67.25% of global bioenergy in 2025 thanks to decades of investments in pellet mills, residue-handling equipment, and dependable combustion plants. A mature supply chain, from forestry by-products to purpose-grown crops, keeps fuel flowing in every major region. Yet the fastest mover right now is biogas. Backed by better anaerobic-digestion technology and tough new waste-recycling rules, biogas output is set to grow 4.84% a year through 2031. Germany’s latest biomass program even singles out flexible biogas units so they can keep supporting the grid once their first subsidies expire. Municipal solid-waste gasification and landfill-gas capture add more momentum, while early-stage options, such as algae fuels, remain in the lab for now. Together, these shifts show the market tilting from simple burn-and-boil systems toward cleaner, higher-value processes that squeeze more out of every ton of organic material.


By Feedstock:
Forestry Waste Still Rules, but Farm Residues Are Rising FastWood chips and sawmill scraps dominate feedstock supply, giving forestry residues a 39.70% share in 2025. Long-standing harvest routines and pellet logistics make this stream reliable and price-competitive. Farm residues, however, are gaining ground the quickest, expanding at an annual rate of 8.55% as policies favor turning crop waste into energy rather than leaving it to rot or burn in the field. The U.S. Billion-Ton Report points to more than 1 billion tons of untapped biomass, much of it corn stalks, wheat straw, and rice husks, waiting to be collected. Dedicated energy crops and sorted municipal waste add diversity, though Europe’s recent wood-chip shortage shows how geopolitics can rattle even well-established supply chains. That reality is pushing producers toward stricter certification and full traceability so buyers can trust both the origin and the sustainability of every load.
By Technology:
Combustion Is Big, Anaerobic Digestion Is BoomingTraditional boilers still account for 84.95% of installed capacity because they are simple, proven, and quick to hook up to existing power or heat networks. But anaerobic digestion, the process behind most biogas plants, is growing at 11.7% a year. It turns household scraps, farm manure, and other organic waste into energy while also producing a fertilizer-rich digestate, giving operators two revenue lines instead of one. Gasification, fast pyrolysis, and fermentation are carving out niches in advanced fuels and chemicals, helped by breakthroughs like solar-assisted pyrolysis that cuts bio-oil costs below EUR 19 per gigajoule. The overall trend is clear: newer technologies aim to deliver more flexible products and stronger environmental performance than straight combustion plants ever could.
By Application:
Heat Still Dominates, but Fuel Demand Is SurgingSupplying industrial and district heat remains bioenergy’s largest job, accounting for 57.85% of use in 2025. Many factories and city heating grids simply swap coal or oil burners for biomass and keep running with minimal fuss, an attractive option in regions with pricey fossil gas or high carbon fees. The headline growth, though, is in transportation fuels. Sustainable aviation fuel (SAF) and renewable diesel are on track to grow nearly 9.35% a year, spurred by airline and trucking mandates plus premium prices for low-carbon fuels. Electricity generation still commands a sizable slice, while combined-heat-and-power plants squeeze up to 90% total efficiency by recycling waste heat, an appealing proposition for energy-hungry industries.
By End User:
Utilities on Top, Commercial Buyers Gaining PaceElectric utilities took 44.15% of bioenergy in 2025, mainly through co-firing and dedicated biomass plants that help them hit renewable-portfolio targets without sacrificing grid stability. Corporate and industrial users are the fastest-growing customer base, expanding 8.75% a year as carbon prices climb and firms chase net-zero pledges. Pellet stoves are spreading in rural homes short on natural-gas access, while transport operators, from airlines to city bus fleets, are locking in long-term biofuel contracts; Southwest Airlines’ 20-year deal with USA BioEnergy is a recent example.
Geography Analysis
APAC Bioenergy Market
The Asia-Pacific region not only holds the largest regional share of 43.30% in 2025, but is also the fastest-growing, at a rate of 5.95% per year. India plans to triple biofuel use by the mid-2020s, backed by a vast pool of crop residues and clear government targets. China is rolling out full-suite biomass projects covering power, gas, and liquid fuels. Japan and South Korea rely more heavily on imports and advanced technologies, whereas Southeast Asia utilizes palm and rice waste for both domestic use and exports. The common thread is energy security: turning local waste into local energy while reducing the oil import bill.
Europe Bioenergy Market
Europe maintained a commanding 29.70% share of the bioenergy market in 2025, thanks to a decades-long alignment between climate ambition, feed-in tariffs, and sustainability criteria. Germany’s new biomass package, France’s capacity auctions, and the Netherlands’ incoming BECCS subsidy exemplify cohesive policy frameworks that maintain investment momentum. Yet growth is moderating as land-use constraints take effect, wood-chip imports become more stringent, and competing ecological priorities challenge further large-scale forest harvesting. Market participants, therefore, pivot toward higher-value niches, including negative-emission power and industrial heat projects that optimize limited feedstock through high-efficiency conversion systems.
North America Bioenergy Market
North America holds third place in terms of capacity, yet leads in advanced biofuel innovation. The United States accounts for the lion’s share of global ethanol and renewable-diesel volumes, leveraging its corn and soy supply chains alongside federal production and blending credits. A growing pipeline of SAF projects positions the country to remain at the forefront of aviation-fuel decarbonization. Canada leverages vast forestry resources and provincial clean-fuel standards to attract large-scale gasification and RNG facilities, often in partnership with First Nations. Mexico’s emerging mandates create opportunities for retrofitting sugarcane mills with bagasse cogeneration, although policy clarity will determine near-term pace.

Regulatory Landscape
Bioenergy regulation is increasingly shaped by sustainability criteria and lifecycle emissions accounting alongside volume mandates. In the European Union, RED III (Directive (EU) 2023/2413) tightens compliance for biofuels and biomass fuels, including an indicative annual increase of 1.6 percentage points in renewable energy share in industry for 2026-2030. The EU framework also constrains pathways classified as high-ILUC risk, with a phase-down trajectory to 0% by 2030 and a 57.1% limit noted for 2026 under the high-ILUC risk provisions.
In North America, the United States EPA finalized Renewable Fuel Standard (RFS) volumes and percentage standards for 2026 (and 2027), reinforcing how conventional and advanced biofuels fit into transport compliance. Regulatory refreshes are also extending into emerging markets, including Mexico, where a new Biofuels Law enacted in March 2025 replaced the 2008 bioenergy promotion framework, signaling changes to permitting and development rules that can alter project pipelines across ethanol, biodiesel, and waste-to-energy pathways.
Competitive Landscape
The bioenergy market remains moderately concentrated, with no single player holding a global share exceeding 10%. Incumbent utilities and oil majors integrate upstream feedstock assets, proprietary conversion technologies, and long-term distribution channels to capture scale synergies. Strategic moves include Copenhagen Infrastructure Partners’ joint venture to build Danish biogas plants and BP’s USD 1.4 billion acquisition to secure full ownership of Brazil’s largest biofuels producer. Developers that lock in dedicated biomass supply gain cost predictability and resilience against price shocks, a decisive differentiator as feedstock markets tighten.
Technology leadership is another axis of competition. Firms advancing modular gasification, chemical looping, and solar-assisted pyrolysis attract venture and strategic capital. Kvasir Technologies’ lignocellulose-to-marine-fuel pathway, for example, secured multi-million-euro backing to scale pilot output. Large equipment vendors, such as Mitsubishi Heavy Industries, embed carbon-capture add-ons in boiler packages, enabling customers to future-proof their assets against stricter emissions rules. Mid-tier players rely on regional specialization—such as wood-pellet exports from the Southeastern United States or rice-husk CHP units in South Asia—to defend their margins.
Partnership models are proliferating. Airlines guarantee minimum bio-jet purchases, heavy-industry offtakers co-invest in on-site plants, and municipalities allocate waste streams under long-term concessions. Such vertically aligned contracts shorten payback periods and mitigate demand risk. On the financing front, green bonds and sustainability-linked loans are now common, provided borrowers commit to verifiable emissions cuts and feedstock traceability. Competition increasingly hinges on proving end-to-end sustainability and securing revenue diversification across power, fuels, heat, and carbon credits.
Bioenergy Industry Leaders
Orsted A/S
Drax Group plc
Fortum Oyj
Enviva Inc.
Mitsubishi Heavy Industries Ltd
- *Disclaimer: Major Players sorted in no particular order
Bioenergy Market Companies Covered in this Report
- Mitsubishi Heavy Industries Ltd
- MVV Energie AG
- A2A SpA
- Hitachi Zosen Corp
- BTG Biomass Technology Group
- Babcock & Wilcox Volund AS
- Biomass Engineering Ltd
- ?rsted AS
- Enerkem
- Fortum Oyj
- Drax Group plc
- Enviva Inc.
- Veolia Environment SA
- Vattenfall AB
- Abengoa SA
- BIOENERGY DevCo
- Valmet Oyj
- Andritz AG
- Green Plains Inc.
- Anaergia Inc.
- Pacific BioEnergy Corp

Market Opportunities and Future Outlook
Near-term whitespace is most visible where policy-backed demand and bankable project structures are aligning around advanced liquid fuels, particularly sustainable aviation fuel (SAF), and around negative-emissions value stacks. Large, financeable projects offer concrete proof points: Acelen Renovaveis closed USD 1.5 billion in June 2026 (for a USD 3 billion biorefinery in Bahia) targeting 1 billion liters per year of SAF and HVO, while Axens launched the ERA project in France in July 2026 positioned as the country's first industrial-scale SAF unit based on advanced bioethanol (50,000 tonnes per year capacity targeted for 2030). Together, these moves point to opportunities for technology licensors, EPCs, and feedstock aggregators supplying certified lignocellulosic inputs that help sponsors meet tightening sustainability and ILUC constraints.
A second opportunity set centers on integrated “bioenergy plus” hubs that monetize multiple outputs, including dispatchable power or heat, renewable gas, and biogenic CO2 for downstream fuels or carbon markets. India’s policy support for residue-to-fuel infrastructure under PM JI-VAN Yojana (including the June 2026 approval of Rs 150 crore for a private hybrid 2G ethanol project in Uttar Pradesh using gasification and gas fermentation) and the Biomass Aggregation Machinery scheme (projects sanctioned with a remaining window to September 30, 2026) highlights the investable gap in feedstock logistics, preprocessing, and aggregation near residue basins. For power and heat applications, the commercial case improves where industrial offtake contracts, higher-efficiency CHP configurations, and BECCS-ready retrofits can be structured into long-tenor agreements, aligning with the report’s observed shift toward higher-value conversion routes beyond conventional combustion.
Recent Industry Developments in Bioenergy Market
- April 2026: Drax Group completed the first transatlantic shipment of biomass pellets powered by B100 biofuel on the vessel Ultra Yorkshire, moving cargo from the Port of Greater Baton Rouge to the Port of Liverpool. In the same month, Drax agreed a new contract with Ultrabulk running through March 2031 that includes a mechanism to reduce sea-freight carbon emissions year on year. The combined logistics actions strengthen the supply chain’s decarbonization credentials, which is increasingly embedded in offtake and policy requirements for biomass-based power and heat.
- November 2025: Drax Group signed an agreement with the UK Government via the Low Carbon Contracts Company for a low-carbon dispatchable contract for difference to operate four biomass units at Drax Power Station from April 2027 to March 2031 (with a strike price of GBP 109.90/MWh, 2012 real). The framework supports dispatchable renewable generation availability and extends revenue visibility for large-scale biomass assets. Longer contract coverage also supports investments linked to sustainability compliance, efficiency upgrades, and BECCS enablement.
- May 2024: Orsted entered into a ten-year carbon removal agreement with Microsoft to deliver one million tonnes of biogenic CO2 removals from the Avedore Power Station, adding to an existing agreement tied to the Asnaes plant. The deal reinforces commercial pull for BECCS-linked bioenergy by establishing long-duration, corporate-backed demand for verified removals. It also shows how bioenergy operators can diversify revenue beyond electricity and heat into carbon markets.


Bioenergy Market Report Scope and Research Methodology
Market Definition and Coverage
This market is defined as bioenergy capacity that is installed and available for use, covering bioenergy produced from biomass and waste-based sources for power, heat, and transport-oriented energy uses.
Scope exclusions: Off-grid biomass consumption without a measurable installed capacity base and purely traditional household fuelwood use are excluded where reliable capacity attribution is not possible.
Segments Covered in This Report
- By Type
- Solid Biomass
- Biogas
- Renewable Waste
- Other Types
- By Feedstock
- Agricultural Residues
- Forestry Residues
- Energy Crops
- Municipal Solid Waste
- By Technology
- Combustion
- Gasification
- Fast Pyrolysis
- Anaerobic Digestion
- Fermentation
- Other Technologies
- By Application
- Electricity Generation
- Heat Generation
- Transportation Fuel
- Combined Heat & Power (CHP)
- By End-user
- Power Utilities
- Commercial and Industrial
- Residential
- By Geography
- North America
- United States
- Canada
- Mexico
- Europe
- Germany
- France
- United Kingdom
- Italy
- Sweden
- Finland
- Rest of Europe
- Asia Pacific
- China
- India
- Japan
- South Korea
- ASEAN Countries
- Australia and New Zealand
- Rest of Asia Pacific
- South America
- Brazil
- Chile
- Colombia
- Uruguay
- Rest of South America
- Middle East and Africa
- South Africa
- Ethiopia
- Sudan
- Rest of Middle East and Africa
- North America
Data Sources, Market Sizing, and Validation
Desk Research
To frame the demand and supply picture, we start with public datasets that can be checked and repeated over time. We used official energy statistics and balances, including those published by the International Energy Agency, the US Energy Information Administration, and Eurostat, then supplemented them with renewable tracking sources from IRENA and the International Renewable Energy Agency statistics portal.
We also review national renewable registries and grid operator publications where these are available, along with customs and trade releases for biofuels and biomass-linked categories, plus peer-reviewed journals covering conversion pathways and plant performance. Company annual reports, sustainability disclosures, and investor presentations are used to confirm capacity additions and closures. For selective triangulation, we used paid subscription sources for company financials and another for patent databases to cross-check corporate activity and technology direction. The list above is not exhaustive, and other public references were used during the work for data collection, validation, and clarification.
Primary Interviews and Surveys
Primary discussions were used to sanity-check the installed capacity base and the real-world utilization of bioenergy assets across power, heat, and transport-linked pathways. We spoke with project developers, plant operators, technology providers, distributors, and end users across major regions, and then used follow-up checks to reconcile differences in policy impact, feedstock availability, and commissioning timelines.
Distribution of primary research fieldwork respondents
| Company type | Respondent position | Region |
|---|---|---|
| Top tier: 31% | CXOs: 15% | APAC: 42% |
| Mid tier: 53% | Functional/Unit leaders: 38% | EMEA: 31% |
| Smaller Players: 16% | Managers: 47% | Americas: 27% |
Market-Sizing & Forecasting
Sizing is built using a top-down approach where energy statistics and renewable capacity series are used to reconstruct the installed bioenergy base by region, then mapped to the study scope and time period. The totals are corroborated through selective bottom-up approximations, including sample roll-ups of announced plant commissioning, retirement lists, and channel checks on typical capacity additions by project type, so outliers can be adjusted.
Key inputs that shape the model include annual bioenergy capacity additions and retirements, policy targets and mandate timelines, feedstock availability signals (such as agricultural residue and waste-to-energy throughput indicators), grid connectivity and dispatch constraints for power plants, and blending and demand indicators for liquid biofuels where capacity is tied to production assets. Where direct capacity disclosure is missing, we fill gaps by using peer benchmarks from similar plants and applying conservative commissioning lags that were supported in interviews.
For the forecast, scenario analysis is used because policy execution and feedstock pricing can change project pipelines quickly. Each scenario is tied to a short list of variables that experts can agree on, and then the final forecast is selected as the most likely pathway after review of near-term project backlogs and permitting activity.
Data Validation & Update Cycle
Outputs are cross-checked against independent signals, including regional renewable capacity totals, public project pipeline counts, and year-over-year capacity change patterns, to spot breaks in trend. When a variance looks material, we re-check the underlying assumption, revisit the source trail, and re-contact relevant respondents to confirm whether it reflects a data lag or a true market shift.
Before sign-off, the model goes through multiple analyst reviews, where input series, conversion steps, and scope filters are tested for consistency across regions and years. The report is refreshed annually, and interim updates are made when large policy moves, major plant commissioning, or notable shutdown events can shift the installed base meaningfully. Prior to delivery, a final pass is completed so clients receive the latest updated view.
Mordor Intelligence's Bioenergy Market Size Compared With Other Published Estimates
Published bioenergy market values often differ because they do not measure the same thing, even when the title looks similar. The main drivers are whether the estimate is based on installed capacity versus revenue, whether traditional biomass use is mixed in with modern bioenergy assets, and how regional policy timing is translated into the forecast.
A second source of spread comes from assumptions that are harder to observe, such as how quickly new projects reach commercial operation, how currency conversion is handled for revenue-based numbers, and whether utilization or production is used as a proxy for capacity. Because the size in this study is in installed capacity and is linked to commissioning and retirement tracking, the gap versus revenue-based totals becomes clear, a modeling choice applied by Mordor Intelligence.
Benchmark comparison
| Source | Market Size | Gaps in Research Methodology |
|---|---|---|
| Mordor Intelligence | USD 164.78 B (2026) | |
| Industry Publisher A | USD 137.38 B (2024) | Uses a revenue-based definition and a different base year, which can blend fuel sales and pricing into the total instead of tracking installed bioenergy capacity additions and retirements. |
| Industry Publisher B | USD 140.20 B (2024) | Reports market value in USD and includes wider bio-energy sources and technologies under a revenue lens, so currency timing, price assumptions, and technology scope can expand the total versus a capacity-led count. |
The table mainly shows that the unit of measurement and the scope boundary explain most of the spread, rather than a small difference in growth rate. When capacity is sized from consistent energy and project signals and then checked with expert feedback, the resulting number is easier to trace back to real assets and repeat in the next update cycle.


Key Questions Answered in the Report
What is the current size of the global bioenergy market?
The bioenergy market reached 164.78 GW in 2026 and is projected to hit 206.59 GW by 2031.
Which region is growing fastest in the bioenergy market?
Asia-Pacific shows the highest growth, with a 5.95% CAGR forecast through 2031 owing to strong biofuel mandates and expanding biomass infrastructure.
Which feedstock category holds the largest bioenergy market share?
Forestry residues account for 39.70% of capacity in 2025, supported by robust collection networks and sustainability policies.
Why is BECCS important for the bioenergy industry?
BECCS enables negative emissions, unlocking carbon-credit revenue and supporting net-zero trajectories while delivering dispatchable renewable energy.
What are the main challenges facing new bioenergy projects?
High capital intensity and fragmented feedstock logistics create financing and supply-chain hurdles, particularly in emerging markets.
Which application segment is expanding fastest?
Transportation fuels, particularly sustainable aviation fuel and renewable diesel, are advancing at a 9.35% CAGR due to strict blending mandates and corporate decarbonization goals.
Page last updated on:


 Your data is secure and never sold or shared.


