
Market Overview
| Study Period | 2021 - 2031 |
|---|---|
| Market Size (2026) | USD 52.17 Billion |
| Market Size (2031) | USD 74.22 Billion |
| Growth Rate (2026 - 2031) | 7.30 % |
| Fastest Growing Market | Asia Pacific |
| Largest Market | Europe |
| Market Concentration | Low |
Major Players *Disclaimer: Major Players sorted in no particular order Image © Mordor Intelligence. Reuse requires attribution under CC BY 4.0. | |
Biodiesel Market Analysis by Mordor Intelligence
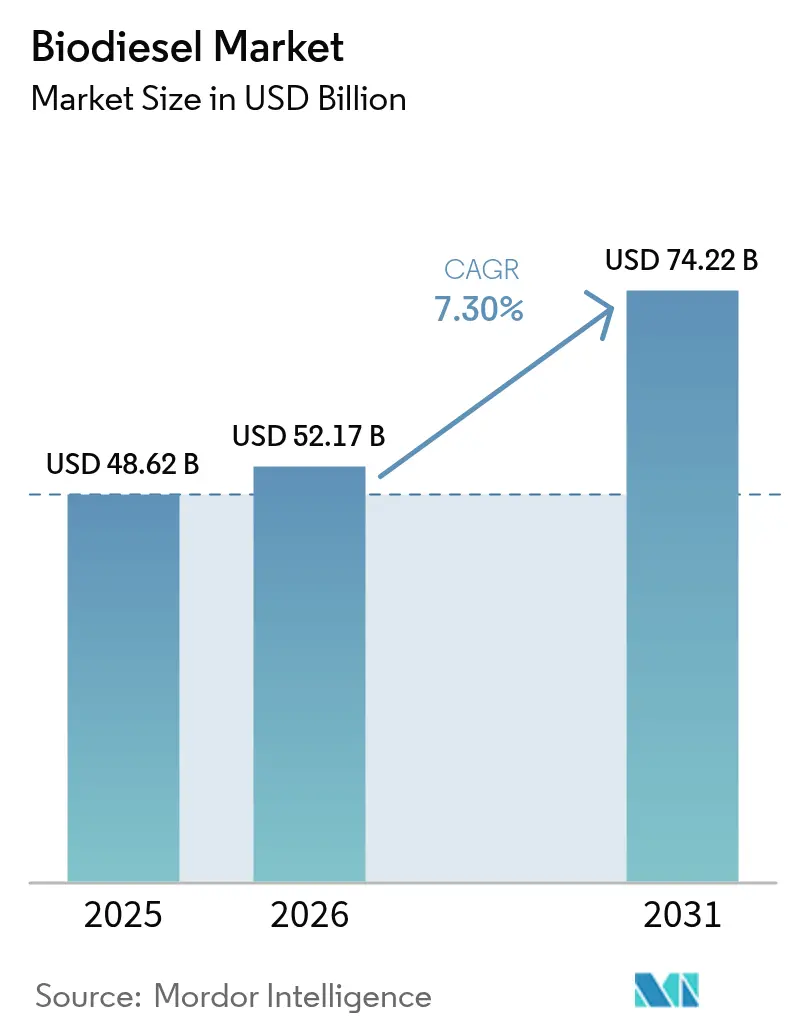
The Biodiesel Market size was valued at USD 48.62 billion in 2025 and estimated to grow from USD 52.17 billion in 2026 to reach USD 74.22 billion by 2031, at a CAGR of 7.30% during the forecast period (2026-2031).
Demand is underpinned by tightening renewable-fuel blend mandates, oil-major investments in advanced hydro-treated vegetable-oil (HVO) capacity, and rising uptake across hard-to-abate industrial sectors. Europe anchors consumption through mature policy frameworks, while Asia-Pacific is expanding fastest as Indonesia, India, and China escalate national blend levels. Corporates are pursuing vertical integration to secure feedstock and optimise logistics, and the shift toward circular-economy waste inputs is reshaping cost structures and carbon-intensity profiles across the biodiesel market.
Key Report Takeaways
- By feedstock, vegetable oils led with 63.45% of the biodiesel market share in 2025; waste cooking oil and tallow are projected to post the fastest 10.15% CAGR through 2031.
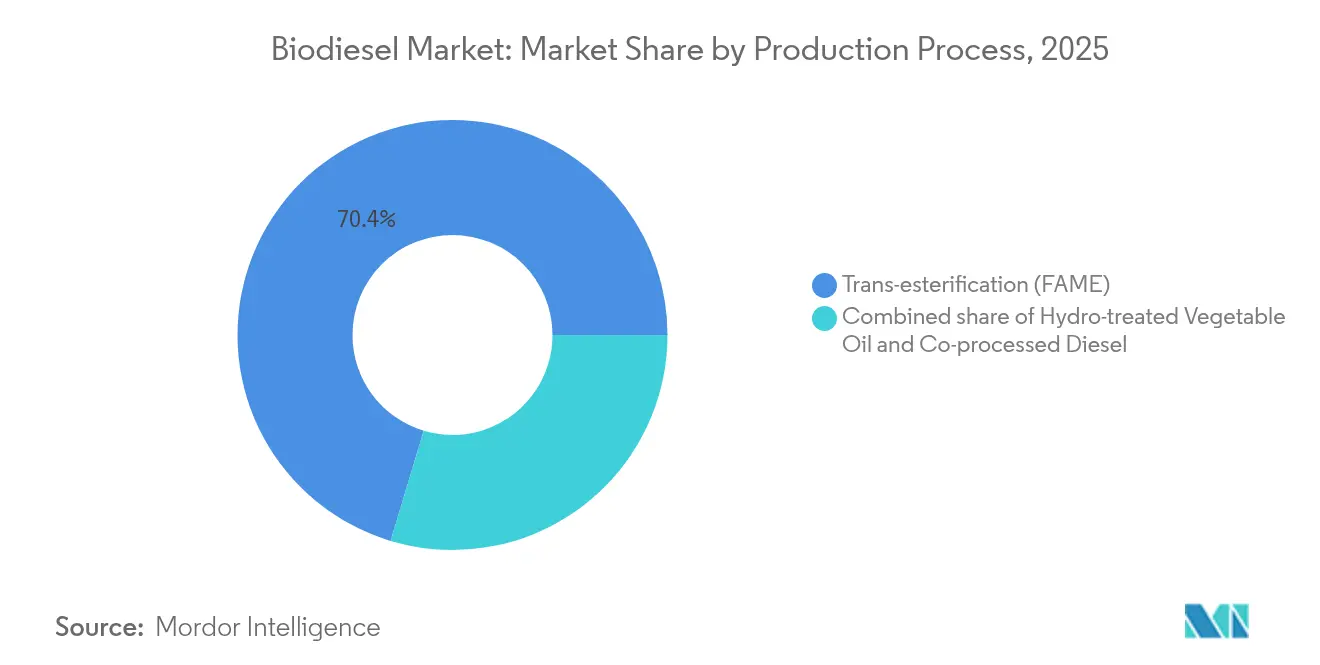
- By production process, trans-esterification accounted for 70.35% share of the biodiesel market size in 2025, while HVO is advancing at a 11.74% CAGR through 2031.
- By blend level, the B5 and below segment led with 47.58% biodiesel market share in 2025; B100 is forecast to expand at a 10.82% CAGR through 2031.
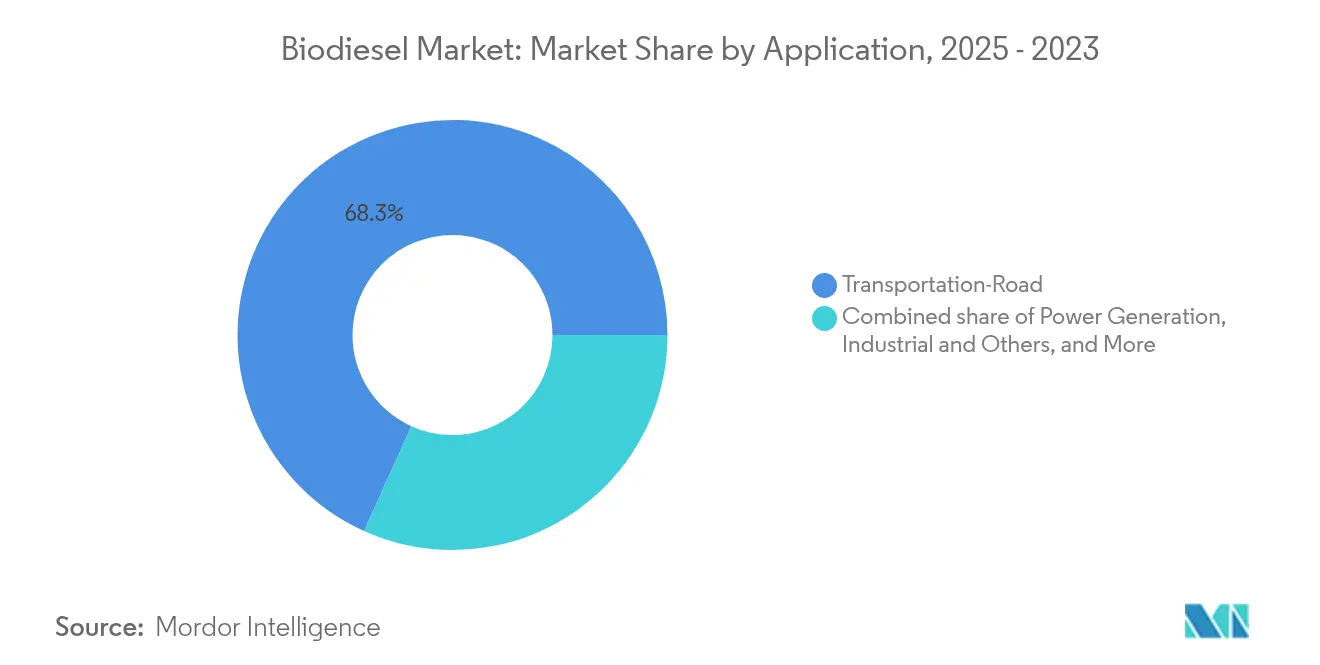
- By application, transportation-road retained a 68.25% share of the biodiesel market size in 2025, and industrial uses are expanding at a 12.58% CAGR through 2031.
- By geography, Europe commanded a 37.62% share of the biodiesel market in 2025; Asia-Pacific is registering the highest 10.02% CAGR through 2031.
Note: Market size and forecast figures in this report are generated using Mordor Intelligence’s proprietary estimation framework, updated with the latest available data and insights as of 2026.
Global Biodiesel Market Trends and Insights
Drivers Impact Analysis*
| Driver | (~) % Impact on CAGR Forecast | Geographic Relevance | Impact Timeline |
|---|---|---|---|
| Renewable-fuel blend mandates expanding (B5 → B20) in U.S., Brazil, Indonesia, EU | 2.10% | North America, South America, APAC, Europe | Medium term (2-4 years) |
| Demand from hard-to-abate sectors (mining, marine, rail) seeking drop-in low-carbon fuels | 1.30% | Europe, North America with global spillover | Long term (≥ 4 years) |
| HVO/SAF capacity build-outs by oil majors lifting glycerin off-take | 1.80% | Europe, North America, emerging APAC | Medium term (2-4 years) |
| Waste- and residue-based feedstock credits (UCO, tallow) widening biodiesel-diesel margin | 1.20% | California, EU, Canada and other premium credit regions | Short term (≤ 2 years) |
| Co-processing technology lowering CAPEX via existing refineries | 0.90% | Refinery-dense regions worldwide | Medium term (2-4 years) |
| Carbon-intensity score premiums under LCFS & EU ETS | 0.70% | California, EU, Canada | Long term (≥ 4 years) |
| Source: Mordor Intelligence | |||
Renewable-fuel Blend Mandates Expanding
National blend programmes are scaling rapidly, guaranteeing sizeable offtake volumes and underpinning long-term financing across the biodiesel market. Brazil’s Fuel-of-the-Future law raises the obligatory blend from B14 to B17 by 2027 and foresees B25 later in the decade, lifting domestic biodiesel use from 9.3 billion litres in 2024 to 12.3 billion litres by 2027.[1]D. Holt, “Brazil Fuel of the Future Law Boosts Biodiesel Blend,” agweb.com Indonesia is rolling out its B40 programme, while all EU member states must align with higher advanced biofuel quotas under RED-III. British Columbia now insists that 8% of diesel renewable content be produced domestically from April 2025, signalling how mandates increasingly favour local supply. Renewable Fuel Standard obligations remain in force in the United States and provide a dependable compliance baseline. These rules establish price floors, enabling producers to expand capacity and adopt efficiency-enhancing technologies.
Hard-to-Abate Sectors Seeking Drop-in Decarbonisation
Mining, marine, and rail operators' segments, where electrification lags, are adopting biodiesel blends to meet near-term carbon-reduction goals without infrastructure overhauls. Global mining firms spend roughly USD 7 billion annually on diesel equipment; switching to B20 or renewable diesel delivers 50–85% lifecycle emission cuts while lowering particulate outputs sharply.[2]Engine Technology Forum, “Biodiesel Reduces Mining Emissions,” engine-technology.org In Europe, Chevron Renewable Energy Group supplies EN 14214-grade fuel that cuts particulate matter in mines from 300-800 µg m³ to 50-200 µg m³. Marine uptake is growing through REG–Bunker Holding alliances to deploy B30, and freight rail trials show seamless engine compatibility. Willingness to pay decarbonisation premiums in these sectors supports higher-margin sales within the biodiesel market.
HVO and SAF Capacity Build-outs
Oil majors are investing heavily in HVO assets to harvest co-product value and create SAF supply chains, a trend reshaping competitive dynamics in the biodiesel industry. Neste lifted renewable aviation-fuel capacity to 1.5 million t pa in April 2025 and is enlarging its Rotterdam complex into the world’s largest renewable diesel and SAF facility by 2027.[3]Neste, “Annual Report 2025 – Renewable Products,” neste.com OMV’s EUR 200 million co-processing line at Schwechat converts 160,000 t of liquid biomass yearly, avoiding 360,000 t of fossil CO₂.[4]Euro-Petrole, “OMV Starts Schwechat Co-Processing Unit,” euro-petrole.com BP took full control of BP Bunge Bioenergia, yet shelved two greenfield SAF projects for portfolio optimisation. Premium-grade glycerin from HVO outputs further improves plant economics, reinforcing capital flows toward this pathway.
Waste- & Residue-based Feedstock Credits
Used cooking oil, tallow, and similar residues collect superior carbon credits under the Low Carbon Fuel Standards, widening the spread between biodiesel and fossil diesel margins. Imports of UCO into California rose markedly in 2024 as producers chased lower carbon-intensity scores, while waste inputs formed 88% of Neste’s renewable feedstock slate in Q2 2024. Brazil’s beef tallow exports jumped to 198,340 t in the first 11 months of 2023, doubling year-on-year, as overseas demand for low-CI feedstock increased. These incentives accelerate the biodiesel market pivot from edible oils toward circular-economy streams.
Restraints Impact Analysis*
| Restraint | (~) % Impact on CAGR Forecast | Geographic Relevance | Impact Timeline |
|---|---|---|---|
| Feedstock price volatility (soy-oil, tallow) squeezes margins | −1.4% | Global, particularly high-output regions | Short term (≤ 2 years) |
| Land-use change scrutiny and EU RED-II food-crop cap | −0.8% | Europe with spillover to exporters | Medium term (2-4 years) |
| Oversupply of low-CI credits in U.S. LCFS | −0.6% | California and neighbouring states | Short term (≤ 2 years) |
| Electrification of light-duty fleets reducing diesel pool | −0.9% | Accelerating in mature markets worldwide | Long term (≥ 4 years) |
| Source: Mordor Intelligence | |||
Feedstock Price Volatility
Soybean-oil quotations oscillated sharply through 2024 as Brazil’s higher blends drew more volumes, eroding producer margins and prompting output optimisation at several plants. UCO values approached virgin-oil parity once LCFS credits were incorporated, diluting expected cost advantages. Neste cited elevated feedstock costs as a principal factor behind depressed margins in 2024 despite flat diesel benchmarks. Climatic disruptions and ongoing food-versus-fuel tensions compound price uncertainty, compelling firms across the biodiesel market to diversify inputs or adopt hedging strategies where possible.
Land-use Change Scrutiny
EU RED-II caps traditional crop-based biofuels at 7% of transport energy and imposes strict land-use-change documentation, effectively narrowing the eligible pool of palm- and soy-derived esters for European customers. Compliance demands cradle-to-gate traceability, adding certification expense and limiting feedstock flexibility for exporters. Producers unable to verify low-ILUC status may face market exclusion, underscoring why waste-derived alternatives are gathering momentum inside the biodiesel market.
*Our forecasts treat driver/restraint impacts as directional, not additive. The impact forecasts reflect baseline growth, mix effects, and variable interactions.
Segment Analysis
By Feedstock: Waste Streams Gathering Speed
Vegetable oils still delivered 63.45% of the 2025 supply, sustaining baseline volumes for the biodiesel market, yet their growth tempo is flattening as policymakers and buyers chase lower carbon-intensity scores. Palm oil dominates South-East Asia, whereas soybean oil prevails in the Americas, but each faces scrutiny over land-use risks.
Waste cooking oil and tallow are projected to expand at a 10.15% CAGR, well ahead of edible oils, thanks to premium LCFS credits and emerging advanced-biofuel quotas. Brazil’s beef-tallow exports, rising 144% year-on-year, signal widening global arbitrage. Algae-based oils and winter-canola pilots from the Neste–Bayer alliance illustrate the exploratory edge of feedstock R&D. Competition for residues is now sharpening, inserting new price volatility while steadily raising the sustainability bar across the biodiesel market.
By Production Process: HVO Ascendant
The familiar trans-esterification route retained 70.35% share of the biodiesel market size in 2025 by virtue of its comparatively light capital burden and well-established supply chain compatibility. It remains the mainstay for many small-to-mid producers, particularly in developing economies with limited refinery integration.
However, HVO capacity is forecast to clock a 11.74% CAGR as oil majors leverage existing hydrotreaters to create fungible diesel, SAF, and naphtha streams. The biodiesel market benefits because HVO commands infrastructure parity with fossil diesel, enabling B100 equivalents without cold-flow problems. Higher-value technical-grade glycerin and flexible feedstock windows further enhance plant returns, spurring a pipeline of conversions and greenfields across Europe, North America, and Asia-Pacific.


By Blend Level: High-Concentration Uptake Rising
B5-and-below products represented 47.58% of 2025 volumes, serving the mainstream automotive fleet with minimal infrastructure change. These blends underpin mass-market stability within the biodiesel market because almost all diesel vehicles can use them under manufacturer warranties.
Mandated jumps to B20 in markets such as Indonesia and niche B100 rollouts for mining and marine customers are pivoting growth toward higher blends. Pure biodiesel is set to climb at 10.82% CAGR through 2031. Operators adopting B30–B100 report lifecycle CO₂ reductions exceeding 80% and substantial particulate abatement, important metrics for ESG-oriented cargo owners and public procurement agencies.
By Application: Industrial Diversification Broadens Demand
Road transportation still commanded 68.25% of 2025 consumption, anchored by haulage and municipal fleet compliance rules. Electrification headwinds remain subdued in heavy freight, leaving a substantial diesel pool open for substitution.
Industrial, marine, rail, and power segments are forecast to increase at a 12.58% CAGR, signifying meaningful diversification of the biodiesel market. For instance, marine bunker suppliers in the Netherlands are now bunkering river-cruise fleets with B30 derived from waste oils. Remote mines are trialling B100 in gensets to reduce Scope 1 emissions without investing in grid upgrades. Such cross-sector adoption embeds biodiesel as a flexible decarbonisation lever beyond highway use.
Geography Analysis
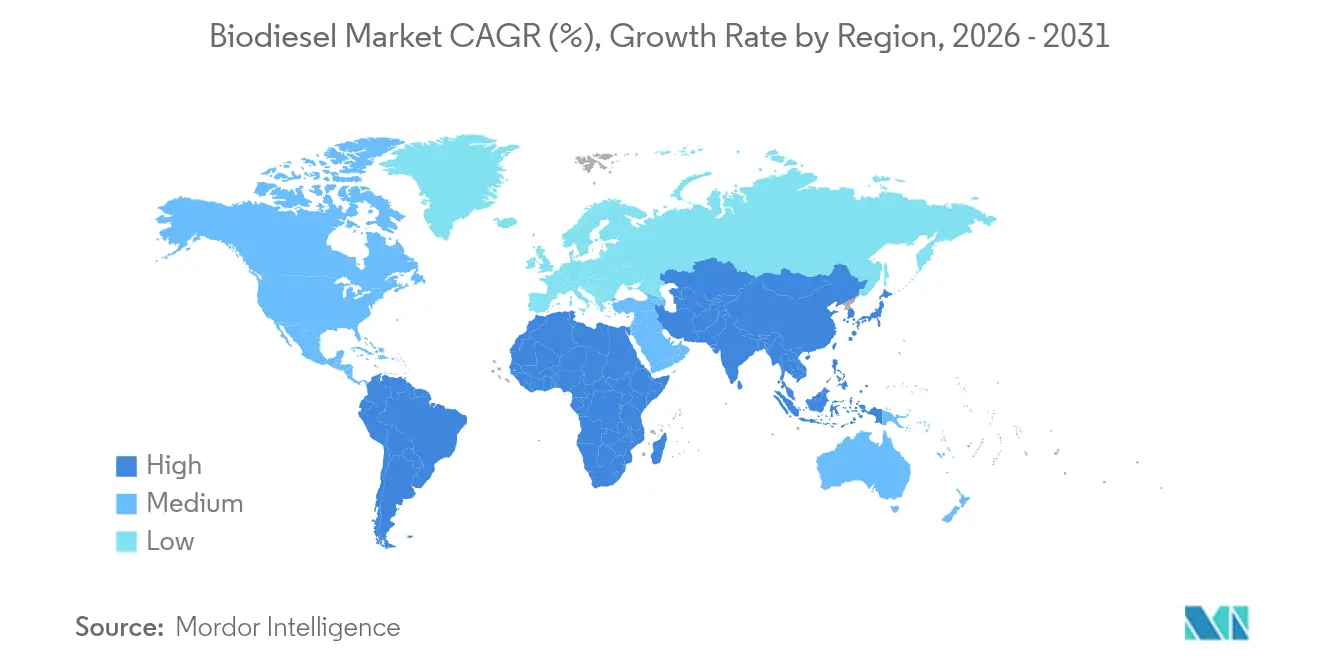
Europe delivered 37.62% of global sales in 2025 and continues to reward low-carbon biodiesel through RED-III quotas, national carbon taxes, and subsidy schemes for waste-based feedstocks. Germany, France, and the United Kingdom each tightened blend obligations in 2025, and the Nordics are frontrunners in collecting municipal UCO for local processing, reinforcing regional circular-economy objectives. Sustainability certification remains stringent however, limiting feedstock choice and raising administrative overhead.
Asia-Pacific offers the fastest expansion path, showing a 10.02% CAGR projection to 2031 as Indonesia escalates toward B40, India allocates grants for capacity, and China integrates biodiesel into its dual-carbon roadmap. Accessible palm-oil supply, rising urban diesel demand, and supportive fiscal incentives make the region a strategic growth engine inside the biodiesel market. Nonetheless, export potential to Europe is checked by deforestation-linked rulings, compelling producers to upgrade traceability protocols.
North America holds mature infrastructure and policy stability via the U.S. Renewable Fuel Standard and an expanding patchwork of state-level Low Carbon Fuel Standards. Advanced credit trading deepens revenue pools, yet LCFS credit oversupply recently squeezed pricing. South America, led by Brazil’s trajectory toward B25, is simultaneously a feedstock powerhouse and a major internal market. Argentina’s producers navigate export tariffs but maintain competitiveness regionally through soybean-oil scale and established esterification expertise.

Regulatory Landscape
Biodiesel demand and pricing are shaped by blending and credit regimes that define compliance volumes and reward lower-carbon feedstocks. In the United States, the Environmental Protection Agency finalized Renewable Fuel Standard (RFS) standards for 2026 and 2027 in April 2026, including biomass-based diesel requirements expressed in RINs (9.07 billion RINs for 2026). This reinforced the importance of D4 RIN value in producer economics and offtake contracting.
In Europe, RED III implementation tightens sustainability requirements and crop-based limits, with the European Biodiesel Board tracking a 2026 crop cap for diesel. That direction supports a shift toward waste and residue pathways to preserve eligibility and avoid tighter land-use scrutiny. Outside the US and EU, fuel-quality and local-content rules influence market access and product specifications. Australia issued the Fuel Quality Standards (Biodiesel) Determination 2025, creating an updated compliance reference point for biodiesel supplied to the domestic market. At the provincial level in Canada, British Columbia implemented an April 2025 requirement that 8% of diesel renewable content be produced domestically, which can redirect trade flows and favor localized production and feedstock sourcing.
Competitive Landscape
Market concentration is increasing as integrated energy companies purchase specialist biodiesel firms and retrofit hydrotreaters for HVO output. Neste, Chevron Renewable Energy Group, and Archer Daniels Midland top the leaderboard through tight feedstock control, technology depth, and multi-regional distribution. Partnerships such as TotalEnergies with Cargill or Shell with Bunge create farm-to-fuel pipelines that hedge raw-material fluctuations.
Competitive advantage increasingly rests on lifecycle-emission credentials and flexibility to pivot between SAF, renewable diesel, and bio-naphtha depending on margin signals. Firms with refinery footprints fast-track co-processing to avoid greenfield CAPEX, whereas smaller independents carve niches in local waste-feedstock aggregations within the biodiesel market. Despite consolidation moves, new entrants continue to appear in emerging economies where domestic blends expand and local residue supply remains underutilised.
Intellectual-property development is centred on catalyst optimisation, glycerin valorisation, and pretreatment of high-FFA feedstocks. Licensing revenues and engineering-services contracts are now material profit streams for technology owners, adding layer to competitive dynamics.
Biodiesel Industry Leaders
Archer Daniels Midland Company
Wilmar International Ltd
Neste Oyj
Chevron Renewable Energy Group
Cargill
- *Disclaimer: Major Players sorted in no particular order


Market Opportunities and Future Outlook
Near-term whitespace centers on aligning capacity utilization and expansion with policy volumes, while upgrading supply chains for low-carbon, credit-advantaged molecules. The April 2026 US EPA final RFS standards for 2026 and 2027 increased compliance certainty for biomass-based diesel through defined RIN-based requirements. That supports multi-year offtake and credit-optimization structures for producers selling into D4 RIN and state LCFS markets.
In April 2026, Eslinger Biofuels announced a five-year arrangement with STX Group spanning D4 RINs, California LCFS credits, and 45Z Clean Fuel Production Credits. The deal points to a shift from more spot exposure toward structured monetization models that can underpin plant debottlenecking and feedstock flexibility investments. Opportunities also concentrate in integrated, feedstock-secure builds and in mandates that increase the share of higher blends within mainstream diesel pools. In Brazil, Potencial Group inaugurated a soy crusher and refined glycerin plant in Lapa in March 2026 to expand biodiesel output capacity, reflecting continued vertical integration from crushing through coproduct upgrading. In Asia-Pacific, Indonesia launched a B50 biodiesel mandate effective July 1, 2026, expanding the addressable pool for palm-based diesel and raising the importance of traceability, logistics, and cold-flow management for higher-blend distribution. In Europe, RED III implementation and tighter crop-based limits create a commercial opening for waste cooking oil, tallow, and other residues, although the resulting competition for these inputs strengthens the case for collection networks, pretreatment capability, and certification-ready documentation across the supply base.
Recent Industry Developments
- June 2026: Cargill assessed the feasibility of using beef tallow as a biodiesel feedstock at its Brazilian plants, responding to shifting trade conditions affecting animal fat exports. The move shows how producers are diversifying residue inputs and re-optimizing feedstock slates to protect margins when traditional arbitrage routes tighten.
- April 2026: The US Environmental Protection Agency finalized Renewable Fuel Standard (RFS) standards for 2026 and 2027, setting updated compliance volumes and reinforcing credit-driven demand for biomass-based diesel. The rulemaking shaped contracting and operating plans for producers selling into D4 RIN and related credit markets.
- February 2025: Cargill signed an agreement to acquire the remaining 50% stake in SJC Bioenergia in Brazil, moving to take full control of the ethanol and biofuels producer. Full ownership increases Cargill's integration across feedstock sourcing, processing, and fuel marketing in a key biodiesel and biofuels geography.


Research Methodology Framework and Report Scope
Market Definition and Coverage
This market sizing covers the commercial value of biodiesel sold for energy use, across major producing and consuming countries, counted as revenue generated from biodiesel volumes sold into end-use channels at prevailing prices.
Scope exclusions: We exclude upstream farming economics and non-fuel bio-based oils that are not processed and sold as biodiesel.
Segmentation Overview
- By Feedstock
- Vegetable Oils
- Waste Cooking Oil and Tallow
- Animal Fat
- Algae and Novel Feedstocks
- By Production Process
- Trans-esterification (FAME)
- Hydro-treated Vegetable Oil (HVO)
- Co-processed/Co-refined Diesel
- By Blend Level
- B5 and Below
- B6 to B20
- B100
- By Application
- Transportation-Road
- Transportation-Marine and Rail
- Power Generation
- Industrial and Others
- By Geography
- North America
- United States
- Canada
- Mexico
- Europe
- Germany
- United Kingdom
- France
- Italy
- NORDIC Countries
- Russia
- Rest of Europe
- Asia-Pacific
- China
- India
- Japan
- South Korea
- ASEAN Countries
- Australia & New Zealand
- Rest of Asia-Pacific
- South America
- Brazil
- Argentina
- Rest of South America
- Middle East and Africa
- Saudi Arabia
- United Arab Emirates
- South Africa
- Egypt
- Rest of Middle East and Africa
- North America
Data Sources, Market Sizing, and Validation
Desk Research
Desk research was used to establish a factual baseline for supply, trade, and policy driven demand. We reviewed official energy and agriculture statistics that track diesel and biofuel blending volumes, plus trade flows that indicate import reliance in large markets. Public documentation around fuel specifications and sustainability rules also helped us keep the counted product consistent across regions.
Sources we leaned on include public datasets and publications such as the U.S. Energy Information Administration, the U.S. Environmental Protection Agency Renewable Fuel Standard program data, Eurostat energy and trade statistics, International Energy Agency energy balances, and FAOSTAT for feedstock context. We also used company filings and investor presentations to understand capacity additions and utilization direction, and a paid subscription for company financials and intelligence plus an import/export shipment-level database to sanity check cross-border movements. These desk sources are not exhaustive, and many other public documents and references were also used for data collection, validation, and clarification.
Primary Interviews and Surveys
Primary work focused on validating how blending mandates, pricing, and feedstock availability translate into real sell-through and realized prices. We spoke with a balanced mix of producers, distributors, and downstream buyers across key regions so the gaps from desk research could be addressed, and the final assumptions could be pressure tested with market reality.
Distribution of primary research fieldwork respondents
| Company type | Respondent position | Region |
|---|---|---|
| Top tier: 34% | CXOs: 16% | APAC: 44% |
| Mid tier: 50% | Functional/Unit leaders: 40% | EMEA: 31% |
| Smaller Players: 16% | Managers: 44% | Americas: 25% |
Market-Sizing & Forecasting
Our sizing starts with a top-down build that reconstructs demand from diesel consumption, announced and enacted blending requirements, and observed biodiesel blending volumes, and then converts volumes to value using region-appropriate price and spread assumptions. Results are cross-checked with selective bottom-up approximations such as sampled producer capacity and utilization, channel checks on typical contract pricing, and a volume times average selling price view for a few representative markets, so clear overcounts can be corrected.
Inputs used in the model include biodiesel production and capacity trends, import and export movements, blend rate changes (B mandates and similar programs), feedstock price direction for common oils and fats, and the relative price of biodiesel versus petroleum diesel. When a country level data series is patchy, we fill gaps using nearby policy timing, trade signals, and expert inputs, and then rebalance totals to match regional supply availability.
For forecasting, scenario analysis was used because policy strength and feedstock economics can shift quickly, and then the chosen path was aligned to the most consistent expectations shared by industry participants. Assumptions are kept transparent so clients can rerun sensitivities when blending targets or price spreads move.
Data Validation & Update Cycle
Triangulation is done by checking the modeled value against independent signals like reported blending volumes, trade balances, and capacity utilization direction, before any number is finalized. Outliers are flagged through variance checks at the country and region level, followed by a second analyst review to confirm the driver logic, units, and conversions.
The report is refreshed annually, and interim updates are made when there is a material policy change, trade disruption, or a large capacity event that can move the demand or pricing picture. Before delivery, we run a fresh review pass so the dataset and assumptions reflect the latest public releases and validated market feedback.
Mordor Intelligence's Biodiesel Market Size Versus Other Published Estimates
Published biodiesel market sizes often do not match because the counted product boundary and the year used for pricing and currency conversion can differ. In our work, we also see differences coming from how policy driven demand is translated into volumes, and whether trade flows are treated as re-exports or true consumption.
U.S. biodiesel supply and consumption volume signals, along with import share indications and regional trade patterns, are the checks that keep Mordor Intelligence aligned to a clear fuel-demand pool rather than a broader bioenergy value chain. The biggest spread typically appears when some publishers fold in renewable diesel or apply a different price basis year, which can change the value even if the volume story is similar.
Benchmark comparison
| Source | Market Size | Gaps in Research Methodology |
|---|---|---|
| Mordor Intelligence | USD 52.17 B (2026) | |
| Global Consultancy A | USD 43.10 B (2023) | Uses an earlier base year and a shorter horizon, and the scope appears to be anchored to a feedstock and technology lens, which can apply different price realization and regional weighting versus a fuel-demand based build. |
| Industry Publisher B | USD 43.80 B (2024) | May mix blend categories and end uses using high-level assumptions, and may rely on a single average price progression, which can understate volatility from diesel spreads and mandate-driven volume swings. |
The table shows that most gaps are explained by timing and counting choices, not by a completely different demand direction. By tying the value build to observable blending and trade signals, and then stress testing prices with interview feedback, the estimate stays repeatable and easy to audit year to year.


Key Questions Answered in the Report
What is the projected size of the biodiesel market by 2031?
The biodiesel market size is forecast to reach USD 74.22 billion in 2031, expanding at a 7.30% CAGR over 2026-2031.
Which feedstock category is growing fastest?
Waste cooking oil and tallow are expected to post a 10.15% CAGR as low-carbon credit incentives make residue-based fuel more profitable.
Why is HVO production gaining momentum?
HVO offers drop-in compatibility with existing diesel infrastructure, yields high-value co-products, and is backed by major refiners investing in hydrotreatment upgrades.
How do blend mandates influence demand?
Mandatory B20 and higher programmes in markets such as Brazil and Indonesia guarantee long-term offtake volumes, underpinning capacity expansion and price stability.
What restrains biodiesel profitability?
Volatile soybean-oil prices, stringent EU land-use criteria, and oversupply of LCFS credits in California can compress margins for producers.
Which region presents the highest growth opportunity?
Asia-Pacific, led by Indonesia and India, is projected to register a 10.02% CAGR owing to expanding blend mandates and abundant regional feedstock.
Page last updated on:


 Your data is secure and never sold or shared.


