
Bio Decontamination Market Size and Share
Market Overview
| Study Period | 2020 - 2031 |
|---|---|
| Market Size (2026) | USD 266.1 Million |
| Market Size (2031) | USD 383.5 Million |
| Growth Rate (2026 - 2031) | 7.58 % |
| Fastest Growing Market | Asia-Pacific |
| Largest Market | North America |
| Market Concentration | Medium |
Major Players *Disclaimer: Major Players sorted in no particular order Image © Mordor Intelligence. Reuse requires attribution under CC BY 4.0. | |
Bio Decontamination Market Analysis by Mordor Intelligence
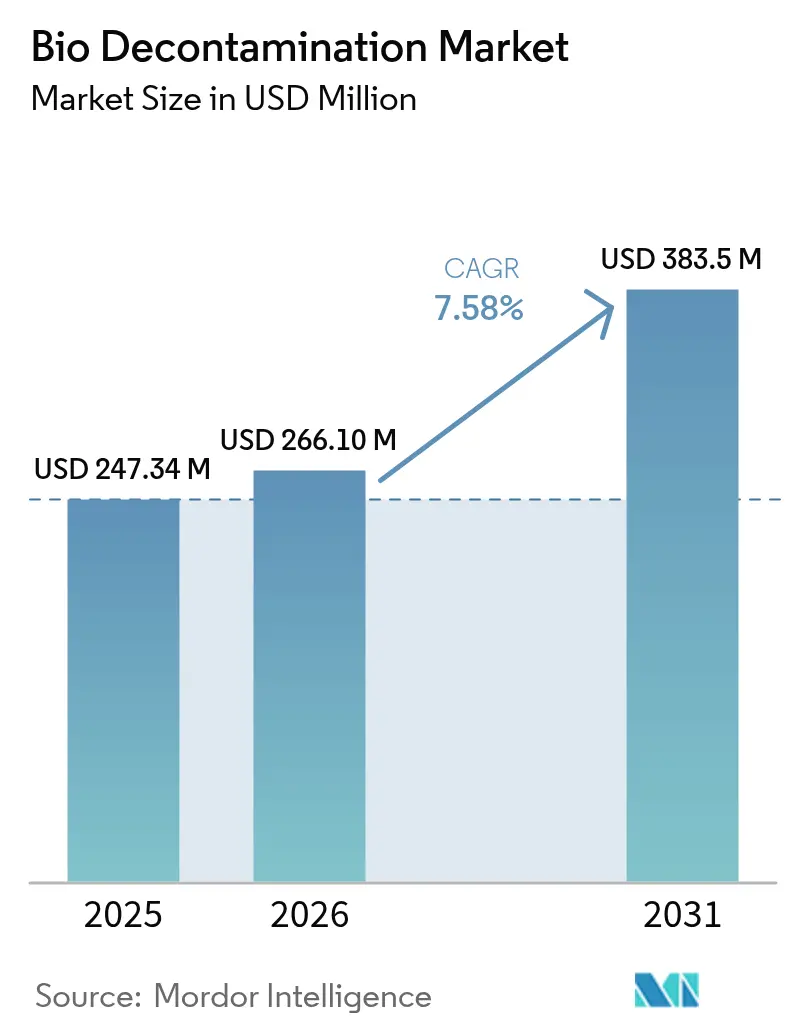
The bio decontamination market size was valued at USD 247.34 million in 2025 and estimated to grow from USD 266.1 million in 2026 to reach USD 383.5 million by 2031, at a CAGR of 7.58% during the forecast period (2026-2031). Increased awareness of healthcare-associated infections, regulatory endorsement of vaporized hydrogen peroxide, and investments in biologics manufacturing underpin the current expansion phase of the bio decontamination market. Equipment purchases dominate capital cycles as pharmaceutical producers replace ethylene oxide systems, while consumables gain momentum through the recurring nature of decontamination workflows. North American leadership rests on stringent standards and sustained healthcare spending, but Asia-Pacific’s rapid manufacturing build-out is generating the fastest incremental revenue. Competitive intensity remains moderate, with established suppliers leveraging global service networks and emerging firms introducing hybrid hydrogen peroxide and binary ionization platforms to address material compatibility and cycle-time concerns.
Key Report Takeaways
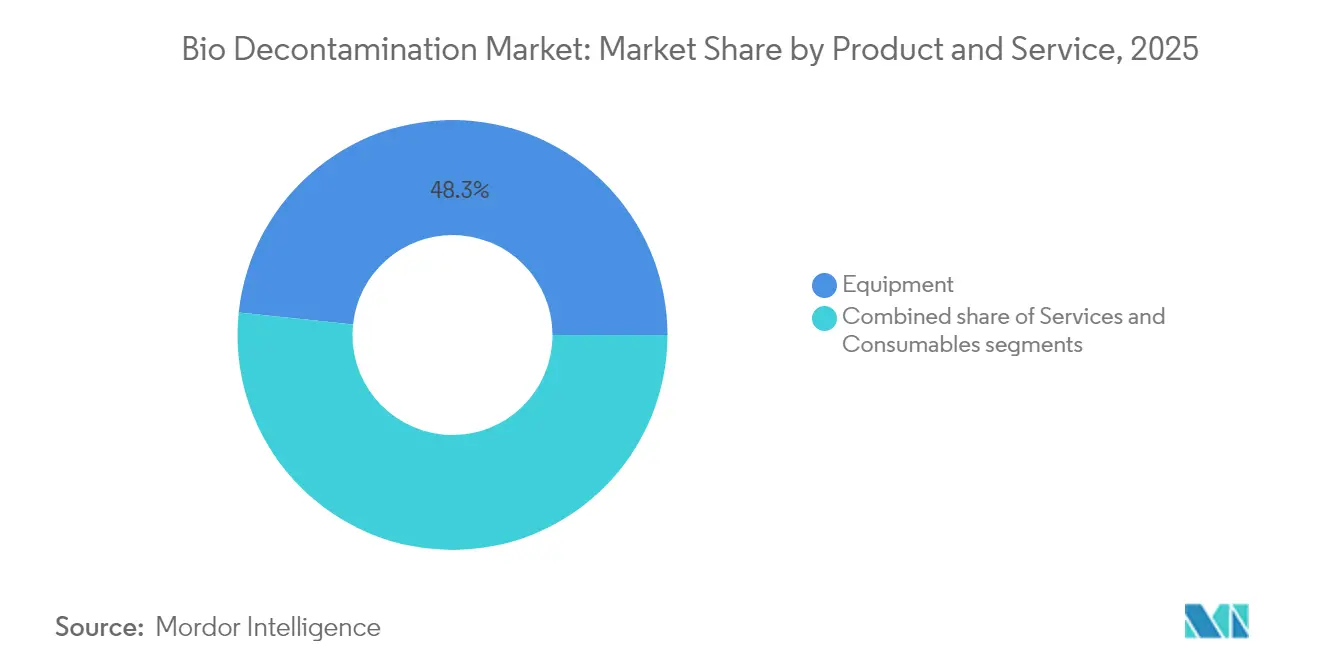
- By product and service, equipment led with 48.33% revenue share in 2025, while consumables are projected to register a 9.10% CAGR to 2031.
- By agent type, hydrogen peroxide held 50.72% of the bio decontamination market share in 2025 and peracetic acid is forecast to expand at an 8.31% CAGR to 2031.
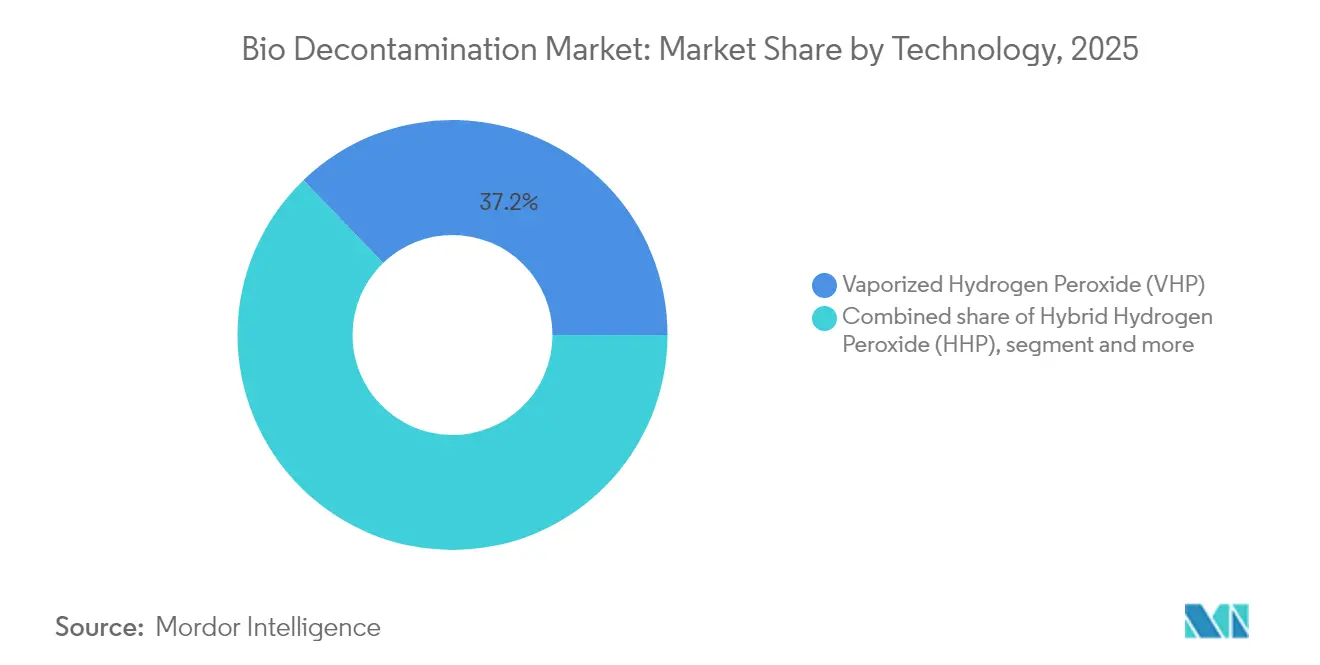
- By technology, vaporized hydrogen peroxide accounted for 37.20% of the bio decontamination market size in 2025 and hybrid hydrogen peroxide is advancing at an 8.55% CAGR through 2031.
- By end user, pharmaceutical and medical-device manufacturers controlled 45.88% revenue in 2025, while life-science research organizations are set to grow at a 9.22% CAGR to 2031.
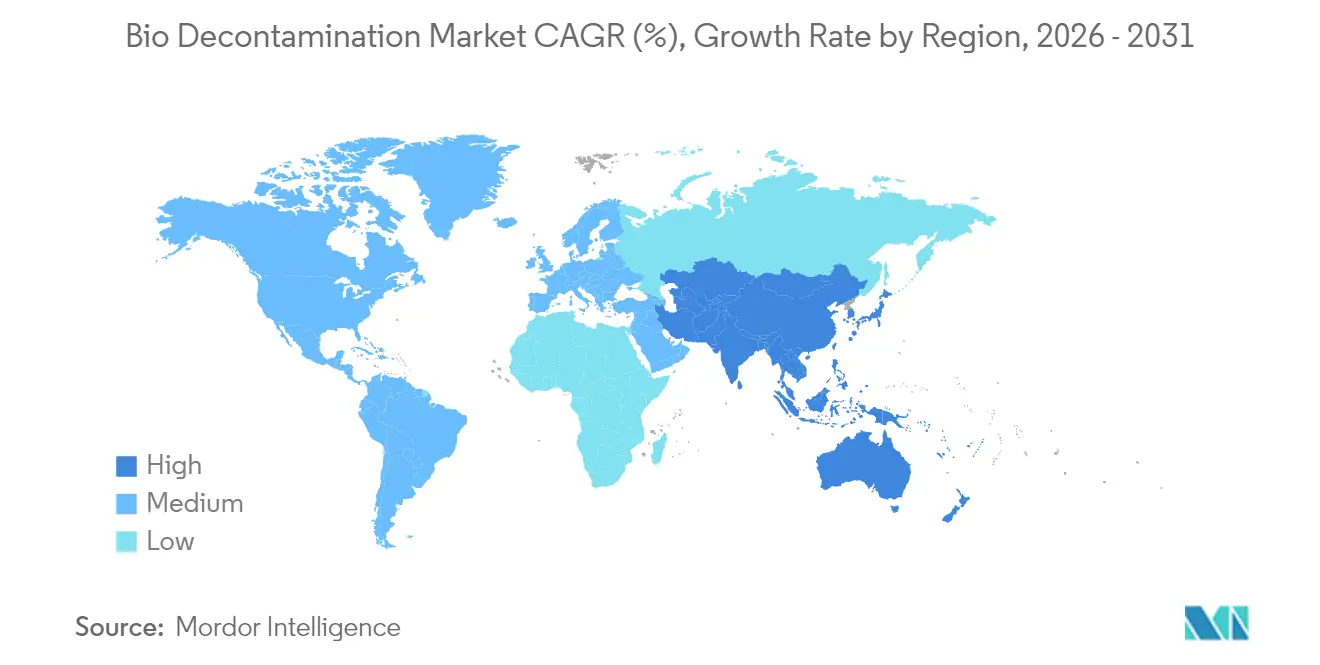
- By region, North America dominated with 41.96% revenue in 2025, whereas Asia-Pacific is predicted to rise at a 9.98% CAGR through 2031.
Note: Market size and forecast figures in this report are generated using Mordor Intelligence’s proprietary estimation framework, updated with the latest available data and insights as of 2026.
Market Trends and Insights
Drivers Impact Analysis of Bio Decontamination Market*
| Driver | (~) % Impact on CAGR Forecast | Geographic Relevance | Impact Timeline |
|---|---|---|---|
| Rising incidence of hospital-acquired infections | +1.8% | Global, with higher impact in North America & Europe | Medium term (2-4 years) |
| Growing number of surgical procedures worldwide | +1.5% | Global, concentrated in developed markets | Long term (≥ 4 years) |
| Stringent sterility regulations in pharma manufacturing | +2.1% | Global, led by North America & Europe | Short term (≤ 2 years) |
| Increasing outsourcing of bio-decontamination services | +1.2% | APAC core, spill-over to North America | Medium term (2-4 years) |
| Adoption in ATMP & cell-gene therapy cleanrooms | +0.9% | North America & Europe, emerging in APAC | Long term (≥ 4 years) |
| Rapid-turnaround biothreat response in aerospace & defense sites | +0.4% | North America, selective European markets | Medium term (2-4 years) |
| Source: Mordor Intelligence | |||
Rising Incidence of Hospital-Acquired Infections
Hospital-acquired infections affect millions of patients each year, with German facilities losing EUR 1,000 per avoidable case, which places direct financial pressure on administrators to upgrade environmental hygiene.[1]BMC Infectious Diseases, “Economic Burden of Nosocomial Infections in German Hospitals,” biomedcentral.com The emergence of Klebsiella pneumoniae ST307, tolerant of 70% of standard biocides, underscores the need for more potent decontamination technologies. Proposed USD 240 million cuts to the US Hospital Preparedness Program would reduce staffing for manual cleaning, which in turn encourages automated no-touch systems that maintain compliance with lean personnel models. The Joint Commission’s 2024 standards emphasize surface cleaning in patient areas, sparking immediate demand for mobile vaporized hydrogen peroxide generators.[2]The Joint Commission, “Revised Infection Prevention and Control Standards,” jointcommission.org In the United Kingdom, NHS England’s 2025 cleanliness benchmarks set rigorous environmental targets that require validated bio decontamination solutions. The CDC’s updated surface disinfection guidance positions environmental services as a core element of safety culture, making automated bio decontamination a strategic investment.
Growing Number of Surgical Procedures Worldwide
Global surgical volumes continue to climb, and each procedure generates multiple instrument reprocessing cycles that rely on dependable decontamination. STERIS reported 14% healthcare service revenue growth in fiscal 2024, largely attributed to higher operating-room throughput. Adoption of minimally invasive techniques raises demand for low-temperature sterilization that protects delicate polymeric components. The FDA’s clearance of vaporized hydrogen peroxide for 3D-printed surgical guides removes a regulatory barrier for personalized implants. Outpatient centers, which hinge on rapid instrument turnover, are installing compact units that finish cycles in under 30 minutes, thus cutting patient wait times. Ageing populations in developed countries guarantee continuing growth in elective interventions, while emerging markets accelerate surgery installations to meet basic healthcare needs. The proliferation of robotic surgery platforms increases the volume and complexity of reusable tools, strengthening the outlook for the bio decontamination market.
Stringent Sterility Regulations in Pharma Manufacturing
The European Union enforced revised GMP Annex 1 in 2024, mandating continuous 5 µm particle monitoring in Grade A and B areas, a change that compels facilities to install integrated decontamination and monitoring packages. Annex 2 now details contamination-control expectations for cell and gene therapies, driving purchases of specialized vaporized hydrogen peroxide isolators. The FDA aligned domestic oversight with Annex 1, creating a unified global compliance requirement that accelerates equipment upgrades inside US biologics plants. Environmental targets related to energy, water, and chemical stewardship promote hydrogen peroxide and peracetic acid, which decompose into benign byproducts. Continuous manufacturing lines favor periodic, automated decontamination that operates without halting production, supporting hybrid hydrogen peroxide systems designed for fast recreation of sterile conditions. Regulatory agencies move toward AI-enabled inspection analytics, increasing demand for decontamination solutions that automatically record every parameter required for audit trails.
Increasing Outsourcing of Bio Decontamination Services
Contract manufacturers are expected to manage 54% of world biologics capacity by 2028, centralizing demand for validated decontamination into a relatively small cohort of facilities.[3]Pharmaceutical Technology, “CMO Share of Global Biologics Capacity,” pharmaceutical-technology.com The biopharmaceutical CMO market reached USD 19.89 billion in 2023, with process development services capturing 34.7% share, reflecting the willingness of sponsors to outsource complex contamination-control operations. Asia-Pacific CMOs expanded floor space rapidly, yet must comply with EU and US sterility rules, stimulating orders for turnkey bio decontamination contracts that include training and documentation. Ecolab’s USD 950 million sale of its surgical solutions line in 2024 freed capital to intensify focus on infection-prevention services, including on-site decontamination programs. Small and mid-sized pharma firms prefer operating-expense models and leverage service providers to gain immediate access to high-specification equipment. The complexity of monoclonal antibody suites reinforces the trend, as contamination events can jeopardize entire commercial campaigns, making outsourced decontamination insurance indispensable.
Restraints Impact Analysis of Bio Decontamination Market*
| Restraint | (~) % Impact on CAGR Forecast | Geographic Relevance | Impact Timeline |
|---|---|---|---|
| High capital cost of advanced equipment | -1.4% | Global, more pronounced in emerging markets | Short term (≤ 2 years) |
| Budgetary constraints in healthcare facilities | -1.1% | Global, acute in resource-limited settings | Medium term (2-4 years) |
| Material-compatibility & safety concerns with chemical agents | -0.8% | Global, regulatory focus in North America & Europe | Long term (≥ 4 years) |
| Lack of standardized validation for large biologics suites | -0.6% | North America & Europe, emerging in APAC | Medium term (2-4 years) |
| Source: Mordor Intelligence | |||
High Capital Cost of Advanced Equipment
A hydrogen peroxide vapor system can list at EUR 50,000, whereas aerosolized alternatives often cost under EUR 10,000, challenging small hospitals that operate on modest capital budgets. The transition away from ethylene oxide further inflates budgets by triggering validation studies and workforce retraining. Healthcare administrators must prioritize among competing investments, and decontamination may rank below imaging equipment when funds are tight. Validation for specialty products such as prefilled syringes adds laboratory costs that raise the total cost of ownership beyond sticker price. Emerging markets face currency volatility that magnifies imported capital-equipment expenses. Finally, complex systems need skilled maintenance, and a shortage of local technicians can extend downtime and increase lifetime costs.
Budgetary Constraints in Healthcare Facilities
A benchmarking study of inpatient cost frameworks showed wide variation in environmental-service spending, revealing a structural hurdle for uniform decontamination adoption. Potential elimination of federal preparedness funding in the United States risks delaying equipment replacement cycles, even as infection-prevention requirements tighten. Resource-limited hospitals often lack robust cleaning protocols and staff training, making sophisticated decontamination technology difficult to justify. Extended patient stays caused by infections reduce day-to-day revenue, compounding the capital-shortage problem. Public facilities in emerging regions must spread scarce funds across basic diagnostic and treatment needs, so automated systems remain aspirational. Reimbursement models now require demonstrable clinical and financial returns, and economic data on bio decontamination is still limited.
*Our forecasts treat driver/restraint impacts as directional, not additive. The impact forecasts reflect baseline growth, mix effects, and variable interactions.
Bio Decontamination Market Segment Analysis
By Product and Service:
Equipment Dominance Drives Capital CyclesEquipment captured 48.33% of 2025 revenue in the bio decontamination market, underscoring how capital assets remain the backbone of contamination-control strategies. Large pharmaceutical plants adopt fixed vaporized hydrogen peroxide chambers to replace aging ethylene oxide units, spurred by the FDA’s 2024 Category A recognition that lowered regulatory uncertainty. Service revenues grow as hospitals and contract manufacturers embrace leasing models that bundle preventive maintenance and consumable supply, reducing up-front expenditure. Consumables, including hydrogen peroxide cartridges and single-use delivery nozzles, are growing at a 9.10% CAGR because higher cycle frequencies are mandated by stricter cleaning protocols. Integrated asset-as-a-service agreements, which guarantee uptime and include remote performance monitoring, are reshaping vendor–customer relationships by shifting risk toward suppliers. The bio decontamination market continues to see OEMs diversify into managed-service tiers that provide validation support and regulatory documentation. Over the forecast horizon, equipment suppliers will concentrate on modular systems that fit within pre-fabricated cleanrooms, cutting installation time for greenfield biologics facilities. Service providers are also incorporating digital twins that simulate chamber performance, which helps operators plan maintenance windows without disrupting production. Sustainability metrics drive interest in reclaim systems that reduce hydrogen peroxide consumption, ensuring future growth in both consumable and upgrade kits.
Consumables benefit from varied end-user segments, including pharmacies that run daily instrument cycles and biosafety laboratories that decontaminate high-risk agents. The increase in turnaround frequency directly feeds volume demand for single-use spray heads and catalyzers, making consumables the fastest contributor to incremental revenue. In emerging geographies, distributors bundle consumables with remote validation software to overcome staff shortages, allowing facilities to meet EU GMP standards without owning advanced analytic tools. The bio decontamination market is therefore experiencing a gradual shift in revenue mix toward recurring streams, a trend likely to accelerate as more hospitals outsource non-core processes. Over the next five years, equipment renewals will peak as ethylene oxide is phased down, after which consumable and service revenue will form the bulk of vendor cash flow. Overall, the combined trajectory of equipment and consumables keeps the bio decontamination market on a stable multi-year expansion path.


By Agent Type:
Hydrogen Peroxide Leadership Faces Peracetic Acid ChallengeHydrogen peroxide retained 50.72% bio decontamination market share in 2025, supported by decades of efficacy data and broad regulatory acceptance. Its decomposition into water and oxygen aligns with corporate sustainability goals, encouraging adoption across pharmaceutical, medical device, and hospital settings. Enhanced efficacy against resistant spores sustains its popularity, and innovation in plasma-activated water boosts kill rates while retaining material compatibility. However, peracetic acid, posting an 8.31% CAGR, is gaining ground due to environmental credentials and strong performance in surface applications, including advanced oxidation for wastewater treatment that aligns with zero-liquid-discharge policies. Chlorine dioxide maintains relevance for whole-facility fumigation, particularly during refurbishments when large volumes must be treated quickly. Nitrogen dioxide sterilization, operating at room temperature and low concentrations, shows promise for complex combination products that cannot tolerate heat, radiation, or high humidity. The others category, featuring ozone and hypochlorous acid, caters to niche applications yet faces stability issues limiting mainstream use.
Emerging agents battle established incumbents on the axes of cycle time, residue, and material compatibility. Peracetic-acid blends combined with surfactants achieve shorter contact times, making them attractive for high-throughput hospitals. Research in plasma-enhanced hydrogen peroxide underscores the agent’s flexibility as operators can dial concentrations to match bioburden without harming sensitive plastics, extending its leadership position. Combination chemistries such as chlorine dioxide with UV-C aim to deliver rapid kill in high-volume instrument reprocessing units, although cost remains a barrier. Future market share shifts will hinge on regulatory acceptance for novel agents and demonstration of consistent efficacy in real-world conditions. Vendors that can validate multi-agent platforms gain a competitive edge, appealing to facilities that must decontaminate diverse substrates under a single quality system. Overall, intense innovation ensures that the bio decontamination market will remain technologically dynamic, with hydrogen peroxide’s dominance challenged but not yet displaced.
By Technology:
Vaporized Hydrogen Peroxide Dominance Challenged by Hybrid InnovationsVaporized hydrogen peroxide technology accounted for 37.20% of 2025 revenue in the bio decontamination market and continues to benefit from extensive validation files covering an array of industries. The dry-vapor approach forms sub-micron droplets that reach shadowed surfaces without leaving corrosive residues, a property valued in cleanrooms filled with sensitive sensors. Gas plasma systems, though mature, maintain a niche for heat-sensitive laparoscopic tools, aided by CDC guidance confirming compatibility with 95% of tested devices. Hybrid hydrogen peroxide platforms, combining fine-mist delivery with catalytic conversion, are the fastest movers at an 8.55% CAGR, offering cycle times under 20 minutes while mitigating condensation risks. Cold atmospheric plasma is emerging for food and packaging decontamination, widening addressable opportunities for technology vendors. UVC LED arrays deliver rapid surface disinfection in waste handling areas, though limited penetration confines them to adjunct roles.
Artificial-intelligence modules embedded in next-generation chambers monitor humidity, temperature, and peroxide concentration in real time, automatically adjusting parameters to remove human error. Integration with building management systems enables remote safety interlocks that shut down HVAC when decontamination begins, which satisfies Annex 1 demands for traceable environmental controls. Micro-sensor networks track residuals to certify readiness for re-entry, minimizing downtime in high-value biologics suites. Hybrid systems also appeal to contract manufacturers who must juggle varying material types across client portfolios, thus driving unit shipments. US government initiatives to replace ethylene oxide add momentum, as hybrid hydrogen peroxide shows comparable sterility assurance levels without producing hazardous ethylene chlorohydrin byproducts. Long term, technology portfolios that combine speed, documentation, and environmental compliance will dominate procurement lists, shaping the competitive rhythm of the bio decontamination market.
By End User:
Pharma Manufacturing Leads, Life Sciences AcceleratesPharmaceutical and medical-device producers held 45.88% revenue in 2025, reflecting stringent GMP mandates that prioritize validated decontamination pathways. Cell and gene therapy suites, which involve manual interventions, rely on automated vaporized hydrogen peroxide isolators to mitigate operator-borne contamination. Hospitals remain sizeable customers because growing surgical caseloads and tighter accreditation rules drive replacement of manual cleaning with no-touch systems. Life-science and biotechnology research organizations are advancing at a 9.22% CAGR as venture capital funds pour into novel modalities, each demanding aseptic work environments.
Dedicated aerospace and defense facilities splash a small yet strategic revenue pool, requesting rapid-turnaround systems to support biothreat response. Contract manufacturers support blockbuster monoclonal antibodies and vaccine campaigns, creating steady order flow for both fixed chambers and mobile units. Increasing prevalence of decentralized manufacturing centers for advanced therapies spreads adoption into secondary geographies, widening the bio decontamination market. Research incubators need flexible, bench-top chambers that scale with laboratory growth, which presents a new sales channel for niche suppliers. The broader healthcare shift toward outpatient procedures requires compact units that fit ambulatory surgery centers, further diversifying the end-user matrix and reinforcing healthy demand.
Geography Analysis
North America Bio Decontamination Market
North America commanded 41.96% revenue in 2025, anchored by the United States where FDA guidance and ANSI/AAMI ST24 revisions spur steady equipment upgrades. Federal recognition of vaporized hydrogen peroxide as Category A reduced regulatory friction, enabling faster procurement cycles for device manufacturers. Canada adopts similar frameworks, while Mexico’s grow-your-own drug-manufacturing initiatives add base-load demand for mid-tier chambers. The region also benefits from consolidation among hospital systems, which standardize equipment lists and negotiate multi-site service contracts, supporting predictable pull-through of consumables.
APAC Bio Decontamination Market
Asia-Pacific is the fastest-growing territory, posting a 9.98% CAGR to 2031, driven by Chinese and Indian biologics expansions, as well as supply-chain realignments prompted by the 2024 US Biosecure Act. Indian CDMOs, which handled USD 15.63 billion work orders in 2023, must now demonstrate US-equivalent sterility compliance, propelling orders for hybrid hydrogen peroxide suites. Japan and South Korea allocate national R&D budgets toward biopharmaceutical innovation, fueling decontamination spend in pilot and commercial facilities. Australia’s Therapeutic Goods Administration demands rigorous sterility dossier submissions, encouraging early adoption of AI-infused validation software bundled with chambers.
EMEA and South America Bio Decontamination Market
Europe posts stable mid-single-digit growth, heavily influenced by Annex 1 and Annex 2 enforcement. Germany’s pharmaceutical cluster around Frankfurt invests in advanced airborne decontamination for continuous production lines, while the United Kingdom’s biotech hubs leverage venture funding to install modular cleanrooms equipped with VHP generators. Southern European nations catch up on infection-control modernizations, focusing on public hospital refurbishments where chlorine dioxide fumigation reduces refurbishment downtime. The Middle East and Africa region remains nascent but benefits from GCC government programs targeting premium healthcare infrastructure. South America, led by Brazil, gradually adopts hydrogen peroxide systems to align with WHO infection-prevention goals, though fiscal constraints slow rollout. The geographic spread ensures multi-vector growth, safeguarding the long-term trajectory of the bio decontamination market.

Regulatory Landscape
Regulatory requirements for sterile manufacturing and device sterility claims continue to shape purchasing and validation practices for bio decontamination equipment and consumables. In the United States, the FDA updated its sterilization guidance in January 2024 to recognize ISO 22441:2022 for vaporized hydrogen peroxide as an Established Category A sterilization process, reducing the sterility-information submission burden for qualifying medical devices. In November 2024, FDA issued a final transitional enforcement policy to manage ethylene oxide sterilization facility changes for certain class III devices and limit supply disruptions.
In Europe, EU GMP Annex 1 remains a central compliance anchor for sterile-product environments, reinforcing validated room, isolator, and cleanroom biodecontamination cycles as part of contamination control strategies. The European Commission has continued to refresh the harmonized standards framework supporting sterile and labeling requirements, including the April 2025 adoption of EN 556-1:2024 and EN 556-2:2024 for devices designated as sterile. In January 2026, Implementing Decision (EU) 2026/197 added updated EN ISO references to support conformity pathways under EU rules.
Value Chain Analysis
The value chain spans chemical inputs (notably hydrogen peroxide and peracetic acid formulations and packaging), equipment OEMs (fixed chambers, mobile generators, isolator-integrated systems, and hybrid platforms), and downstream validation and service execution at end-user sites. OEMs and branded solution providers such as Ecolab (Bioquell), TOMI Environmental Solutions, CURIS, and DSE typically pair hardware with consumables, documentation, and cycle-development support aligned to cleanroom biocontamination control practices (for example, EN 17141 for controlled environments) and site-specific safety interlocks.
Distribution and execution increasingly depend on regional technical partners that can install, qualify (IQ/OQ/PQ), and sustain uptime through maintenance and training, particularly across multinational GMP networks and biosafety laboratories. TOMI's March 2026 appointment of Total Clean Air as its preferred European partner for SteraMist iHP further tightens the link between equipment sales and local compliance services across the UK and EU. The chain also includes third-party certification bodies and committees that influence procurement checklists; TOMI's June 2026 step to engage the NSF Joint Committee on Biosafety Cabinets highlights how independent certifications can become a gating factor for standardized protocols and recurring consumable pull-through.
Competitive Landscape
Market concentration is moderate, with the top five players accounting for roughly 45% of global revenue, which leaves ample room for specialized challengers. STERIS recorded 6% topline expansion in fiscal 2025, supported by double-digit service growth and the rollout of hyper-cycle VHP chambers. Ecolab divested its surgical solutions unit to focus on infection prevention, freeing capital to scale its Bioquell VHP service network. Getinge expanded its bioprocess footprint through acquisitions of High Purity New England and Healthmark, broadening its portfolio of filtration and compliance consumables. TOMI Environmental Solutions secured a USD 450,000 custom system contract at a Rhode Island university and earned Disinfection and Decontamination Products Company of the Year 2025, highlighting its competitive rise. Sonata Scientific introduced an ethylene oxide abatement platform that reaches 99% destruction efficiency, positioning itself for facilities that cannot yet abandon ethylene oxide but must meet emission ceilings.
Strategic moves center on capacity expansion, portfolio diversification, and regulatory positioning. Vendors bundle digital validation suites to satisfy Annex 1 traceability, an edge that pure-play equipment suppliers struggle to match. Partnerships with CMO networks give established brands recurring service revenue and early access to new facility projects. Sustainability pledges push competitors to advertise low-energy cycles and biodegradable consumables, resonating with ESG-oriented investors. In emerging markets, suppliers establish local training academies to ease skill shortages and reduce downtime, supporting customer retention. R&D pipelines focus on hybrid delivery formats and real-time residual monitoring, key differentiators in bids for high-value biologics lines. Overall, moderate concentration coexists with active innovation, shaping an environment where niche advances can secure profitable niches before incumbents counter.
Bio Decontamination Industry Leaders
Ecolab
JCE Biotechnology
Zhejiang Tailin Bioengineering Co., Ltd.
Steris Plc
Tomi Environmental Solutions Inc.
- *Disclaimer: Major Players sorted in no particular order

Bio Decontamination Market Companies Covered in this Report
- Steris plc
- Ecolab (Bioquell)
- TOMI Environmental Solutions
- Getinge
- ClorDiSys Solutions Inc.
- Fedegari Autoclavi SpA
- Amira SRL
- Howorth Air Technology Ltd
- JCE Biotechnology
- Zhejiang Tailin Bioengineering Co. Ltd
- Noxilizer Inc.
- Stryker (Cantel Medical)
- Curis System
- Solvay SA (Peroxides)
- Arkema Peroxides
- Evonik Industries
- Johnson & Johnson (ASP)
- 3M

Market Opportunities and Future Outlook
A key opportunity lies in third-party validation and certification of biodecontamination protocols for high-consequence applications such as biosafety cabinets and controlled environments, where procurement often calls for independent proof beyond vendor validation packages. In June 2026, TOMI Environmental Solutions advanced an NSF certification initiative for its SteraMist iHP decontamination protocol by presenting to the NSF Joint Committee on Biosafety Cabinets, creating an adoption pathway that can simplify buyer qualification across research organizations and regulated laboratories.
In healthcare and cleanroom operations, demand is also being shaped by expanding portfolios of regulated sporicidal solutions and automation-friendly workflows that reduce dependence on manual cleaning for critical spaces. Ecolab's October 2025 launch of an EPA-registered Klercide Rapid Sporicide for cleanroom applications supports product-line extensions that pair surface disinfection chemistries with room and isolator bio decontamination programs. Separately, FDA authorization activity for air decontamination devices, including Biomoneta's Avata Rx clearance in December 2025, points to growing interest in real-time pathogen control as a complement to periodic room cycles, which creates integration opportunities with existing decontamination service contracts and digital compliance recordkeeping.
Recent Industry Developments in Bio Decontamination Market
- June 2026: TOMI Environmental Solutions announced progress toward NSF certification for its SteraMist ionized hydrogen peroxide (iHP) decontamination protocol by engaging the NSF Joint Committee on Biosafety Cabinets. The effort focuses on third-party validation for a common laboratory asset, supporting more standardized procurement and reducing protocol-by-protocol buyer requalification.
- October 2025: Ecolab Life Sciences introduced Klercide Rapid Sporicide, an EPA-registered sporicidal disinfectant positioned for cleanroom environments. The launch expands consumables options that align with validated contamination-control programs and adds incremental pull-through alongside equipment and service-based decontamination workflows.
- November 2024: The US FDA issued final guidance establishing a transitional enforcement policy for ethylene oxide sterilization facility changes affecting certain class III devices. By clarifying how facility modifications are managed to mitigate supply disruptions, the guidance reinforces the broader shift toward compliant sterilization and decontamination strategies when manufacturers adjust or replace legacy EtO-dependent processes.


Bio Decontamination Market Report Scope and Research Methodology
Market Definition and Coverage
This market tracks the revenues earned from biodecontamination solutions used to remove or neutralize biological contamination in controlled environments, especially in healthcare and life-science settings. It covers equipment, related consumables, and contracted decontamination services applied in rooms, cleanrooms, and production suites.
Scope exclusions: It excludes routine manual cleaning and wipe-down disinfection using general-purpose disinfectants.
Segments Covered in This Report
- By Product and Service
- Equipment
- Services
- Consumables
- By Agent Type
- Hydrogen Peroxide
- Chlorine Dioxide
- Peracetic Acid
- Nitrogen Dioxide
- Others
- By Technology
- Vaporized Hydrogen Peroxide (VHP)
- Hybrid Hydrogen Peroxide (HHP)
- Gas Plasma
- Others
- By End User
- Pharmaceutical and Medical-Device Manufacturing Companies
- Life-Sciences and Biotechnology Research Organizations
- Hospitals and Healthcare Facilities
- Others
- Geography
- North America
- United States
- Canada
- Mexico
- Europe
- Germany
- United Kingdom
- France
- Italy
- Spain
- Rest of Europe
- Asia-Pacific
- China
- Japan
- India
- Australia
- South Korea
- Rest of Asia-Pacific
- Middle East and Africa
- GCC
- South Africa
- Rest of Middle East and Africa
- South America
- Brazil
- Argentina
- Rest of South America
- North America
Data Sources, Market Sizing, and Validation
Desk Research
Desk research was used to define the demand pool and operating context before assumptions were finalized. We reviewed public sources such as the US FDA site for sterilization and contamination-control context, the US CDC for infection prevention guidance, and the WHO for broader infection-control practices that influence adoption.
To pressure-test assumptions around pharma and cleanroom demand, we also referred to sources such as USP general chapters, Eurostat and UN Comtrade trade series (for directional movement of relevant equipment categories), and peer-reviewed papers indexed on PubMed that discuss decontamination agents like vaporized hydrogen peroxide. Company filings, investor presentations, and trusted press were used to map installed-base cues, pricing direction, and service-cycle patterns, supported by a paid subscription for company financials, patent tracking, and shipment-level trade signals where helpful. The sources listed are illustrative, and many other references were used to collect, validate, and clarify the dataset.
Primary Interviews and Surveys
Primary work focused on aligning the model to how biodecontamination is procured and used across end users, including sterile manufacturing sites, hospitals, and laboratory operators. We spoke with a mix of equipment-focused participants and service-led participants across major regions, which helped close gaps on cycle frequency, typical bundle content (equipment plus consumables), and regional pricing differences.
Distribution of primary research fieldwork respondents
| Company type | Respondent position | Region |
|---|---|---|
| Top tier: 26% | CXOs: 13% | APAC: 53% |
| Mid tier: 59% | Functional/Unit leaders: 35% | EMEA: 29% |
| Smaller Players: 15% | Managers: 52% | Americas: 18% |
Market-Sizing & Forecasting
Sizing started with a top-down build where regulated cleanroom and critical-space demand was reconstructed using life-science manufacturing activity and controlled-environment usage, and then translated into biodecontamination spending by applying adoption and cycle-rate assumptions. To keep outputs realistic, we corroborated totals using selective bottom-up checks like sampled ASP x unit volumes for key system types and channel feedback on service contract values, and then adjusted when the two views did not align.
Inputs used in the model included, for example, the spread of cleanroom and aseptic production capacity, the frequency of room and isolator decontamination cycles, mix shifts across agent types (such as vaporized hydrogen peroxide versus chlorine dioxide), average service attachment rates, and the pace of replacement or upgrade of legacy approaches. For forecasting, scenario analysis was used around expansion of biologics manufacturing, tightening contamination-control practices, and pricing progression for consumables, then the final path was checked with what interviewees viewed as a reasonable year-by-year adoption curve. Where bottom-up evidence was thin in smaller countries or niche end uses, we bridged gaps using proxy indicators like facility counts and regional production intensity before being cross-checked again in interviews.
Data Validation & Update Cycle
Validation relied on multiple checks so the final numbers do not depend on one source or one assumption. Outputs were compared against independent signals such as life-science capacity additions, infection-control related procurement trends, and observed price ranges for systems, consumables, and service cycles, and then outliers were investigated until the driver was clearly explained.
A second analyst review was completed before sign-off, and interview re-contacts were triggered when a key input moved outside the expected range, for example, a sudden jump in service cycle pricing or a large change in agent mix. Reports are refreshed annually, and interim updates are made when material events change demand or pricing. Before delivery, a final review pass is done so clients receive the most current view that fits the stated scope.
Mordor Intelligence's Biodecontamination Market Size Measured Against Other Published Estimates
Published market values for biodecontamination can look inconsistent because the scope line is drawn differently across studies, and because cycle frequency and pricing assumptions are handled in different ways. Differences also show up when services and consumables are treated as optional add-ons instead of being tied to actual decontamination cycles.
The main gap comes from whether contracted biodecontamination services and recurring consumables are counted alongside equipment revenues, and in Mordor Intelligence's model they are included only when they are linked to defined room or cleanroom decontamination cycles rather than everyday disinfection activity.
Benchmark comparison
| Source | Market Size | Gaps in Research Methodology |
|---|---|---|
| Mordor Intelligence | USD 247.34 M (2025) | |
| Industry Publisher A | USD 229.50 M (2023) | Uses an older base year and can understate near-term demand when cleanroom additions accelerated after 2023, and scope descriptions are less explicit about how service cycles and consumables are linked to usage. |
| Industry Publisher B | USD 178.00 M (2024) | Focuses on biodecontamination systems, which often narrows coverage to equipment and can leave out contracted services and recurring consumables, thereby lowering the total versus a full solution revenue view. |
The spread in the table is mostly explained by what gets counted as recurring revenue versus one-time systems, and by which year is used to anchor the model. By tying services and consumables to identifiable cycle drivers and then cross-checking pricing with field feedback, we keep the estimate traceable to clear operational variables instead of broad, lump-sum assumptions.


Key Questions Answered in the Report
What is the current size and expected growth rate of the bio decontamination market?
The market is valued at USD 266.1 million in 2026 and is forecast to reach USD 383.5 million by 2031, advancing at a 7.58% CAGR.
Which product category generates the most revenue and which grows the fastest?
Equipment accounts for 48.33% of 2025 revenue, while consumables post the highest growth with a 9.10% CAGR to 2031.
Which recent regulatory decisions are accelerating adoption of new decontamination technologies?
In January 2024 the FDA classified vaporized hydrogen peroxide as an Established Category A sterilization method, cutting barriers to ethylene-oxide alternatives.
Which is the fastest growing region in Bio Decontamination Market?
Asia-Pacific is estimated to grow at the highest CAGR over the forecast period (2026-2031).
Which geographic region is expanding the quickest and why?
Asia-Pacific shows a 9.98% CAGR through 2031, propelled by Chinese and Indian pharmaceutical capacity build-outs and supply-chain diversification after the 2024 US Biosecure Act.
What technologies are gaining traction as replacements for ethylene oxide sterilization?
Vaporized and hybrid hydrogen peroxide systems are leading substitutes because they combine rapid cycles, broad material compatibility, and growing regulatory acceptance.
Page last updated on:


 Your data is secure and never sold or shared.


