
Biochemical Reagents Market Size and Share
Market Overview
| Study Period | 2020 - 2031 |
|---|---|
| Market Size (2026) | USD 46.92 Billion |
| Market Size (2031) | USD 66.34 Billion |
| Growth Rate (2026 - 2031) | 7.17 % |
| Fastest Growing Market | Asia Pacific |
| Largest Market | North America |
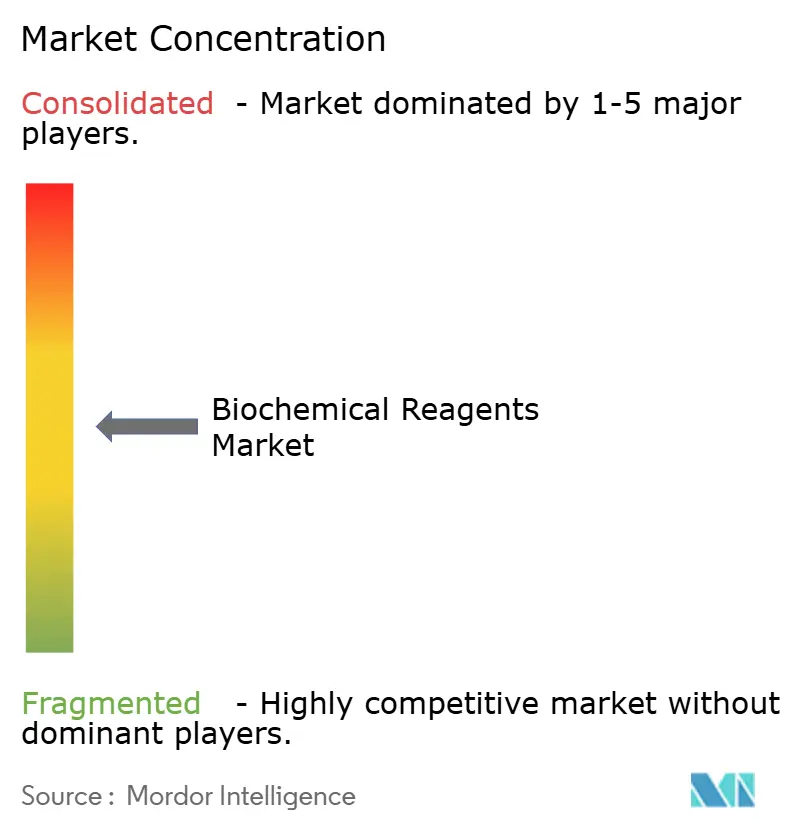
| Market Concentration | Medium |
Major Players *Disclaimer: Major Players sorted in no particular order Image © Mordor Intelligence. Reuse requires attribution under CC BY 4.0. | |
Biochemical Reagents Market Analysis by Mordor Intelligence
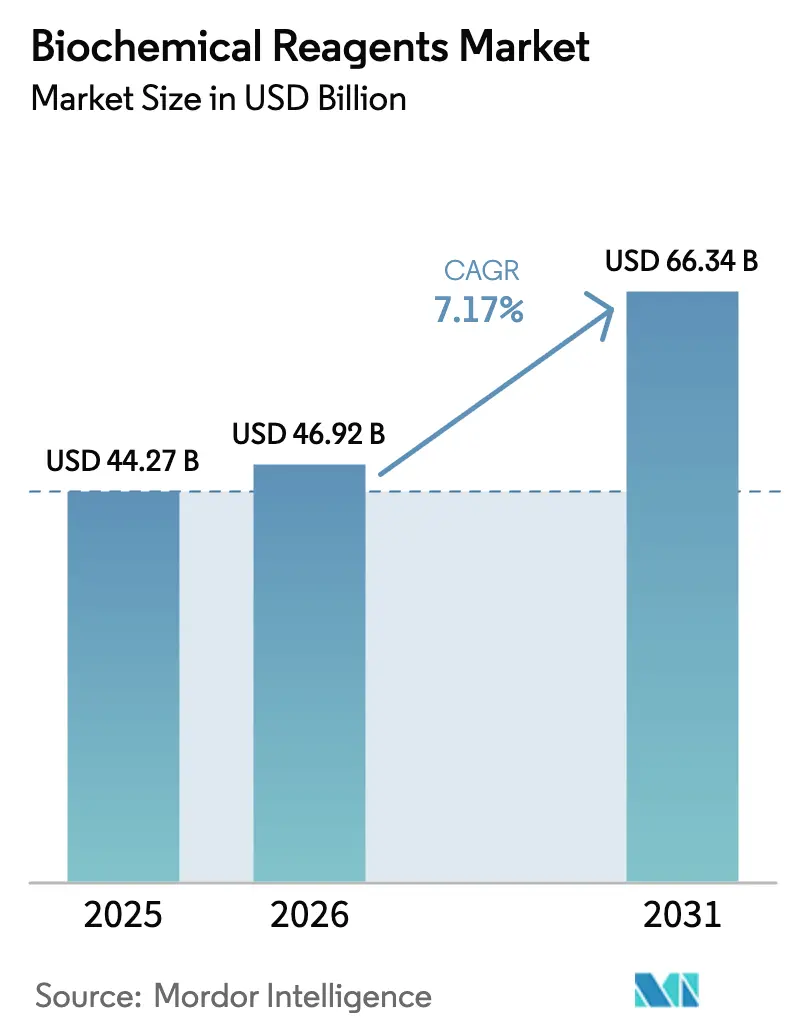
The Biochemical Reagents Market size is expected to increase from USD 44.27 billion in 2025 to USD 46.92 billion in 2026 and reach USD 66.34 billion by 2031, growing at a CAGR of 7.17% over 2026-2031.
Sovereign funding pushes are reshaping supply chains, led by the United States where the National Institutes of Health set aside USD 50.1 billion for fiscal 2025 to support genomics and proteomics programs that depend on high-purity reagents.[1] Parallel growth stems from the U.S. Advanced Research Projects Agency for Health, which secured up to USD 2.5 billion to accelerate next-generation sequencing and molecular diagnostics platforms, further enlarging the biochemical reagents market.[2] Structural incentives favor domestic production as policymakers guard against enzyme-supply shocks that emerged during 2024-2025 geopolitical tensions, and firms that can guarantee uninterrupted deliveries are securing long-horizon contracts. The biochemical reagents market is also benefiting from automation-ready kit formats that reduce labor costs in high-throughput screening centers and from AI-driven formulation tools that shorten development cycles for custom mixes.
Key Report Takeaways
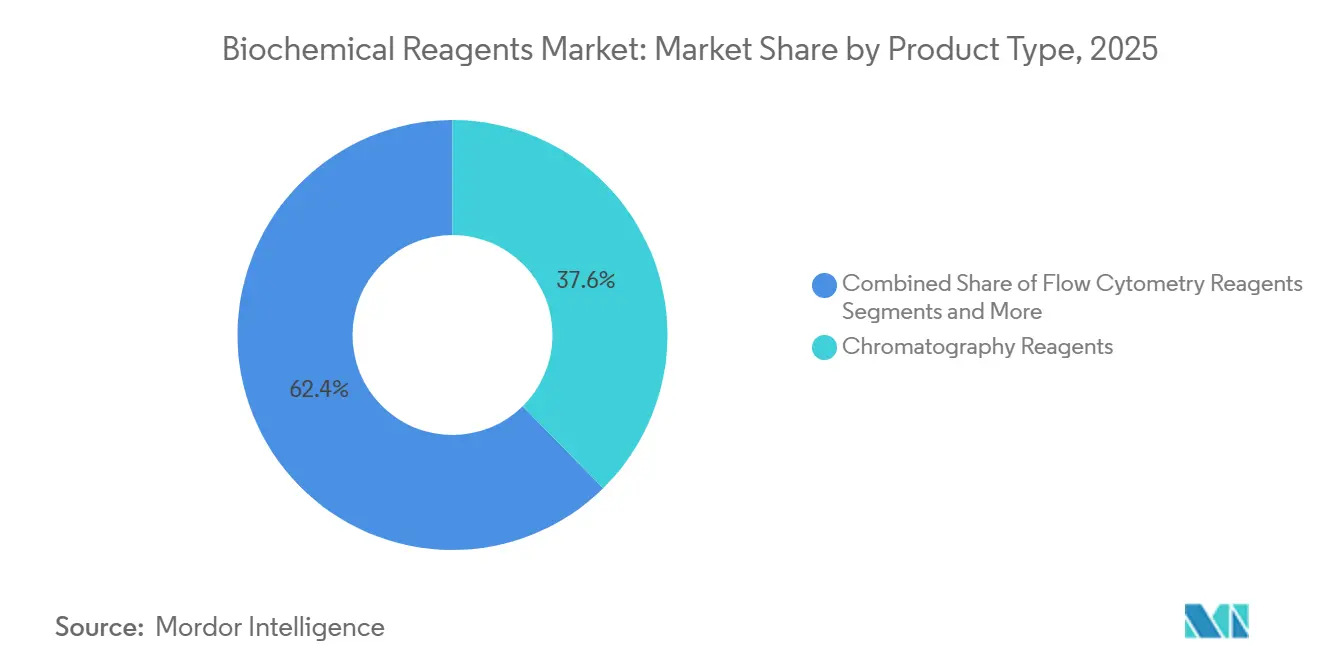
- Chromatography reagents accounted for a 37.63% biochemical reagents market share in 2025, while PCR kits are projected to advance at a 10.44% CAGR through 2031 as the fastest growing product category.
- By end user, biotechnology companies led with 31.56% of the biochemical reagents market in 2025, whereas contract research organizations are expanding at a 10.06% CAGR, the strongest pace among customer groups.
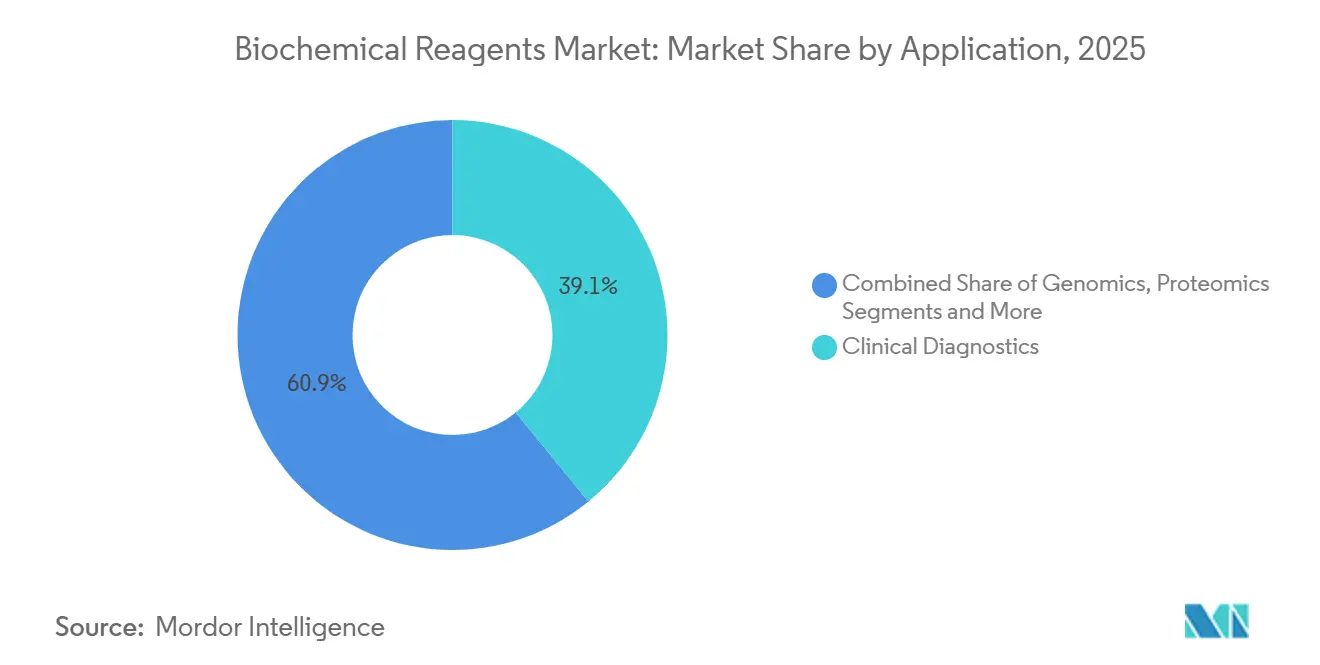
- Within applications, clinical diagnostics held a 39.11% share in 2025, yet genomics use cases are on track for an 11.63% CAGR and will narrow the gap by 2031.
- PCR technology dominated with a 44.23% share in 2025; however, next-generation sequencing reagents are forecast to climb at a 10.34% CAGR as large-scale population sequencing intensifies.
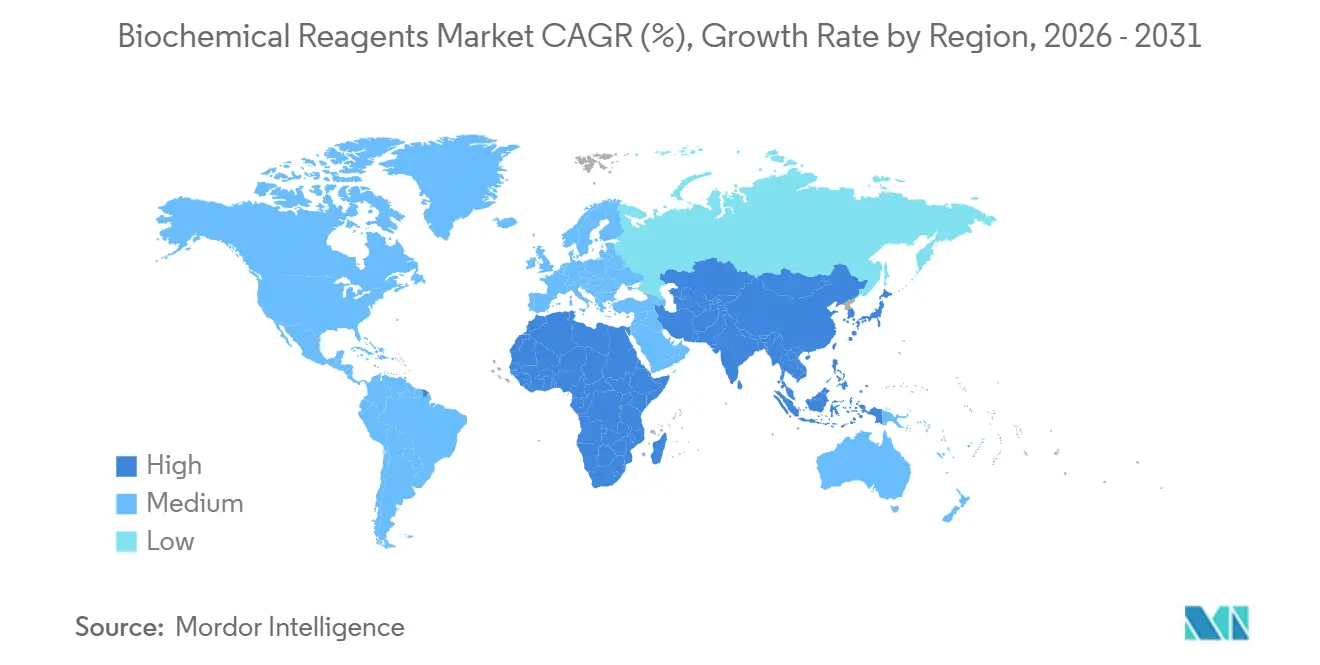
- North America captured 44.42% of global revenue in 2025, while Asia-Pacific is expected to register a 9.35% CAGR—the quickest regional trajectory—supported by local manufacturing hubs.
Note: Market size and forecast figures in this report are generated using Mordor Intelligence’s proprietary estimation framework, updated with the latest available data and insights as of January 2026.
Market Trends and Insights
Drivers Impact Analysis of Biochemical Reagents Market*
| Driver | (~) % Impact on CAGR Forecast | Geographic Relevance | Impact Timeline |
|---|---|---|---|
| Soaring Demand for Molecular Diagnostics | 1.8% | Global, with peak intensity in North America & Europe | Short term (≤ 2 years) |
| Expansion of Genomics & Proteomics Research | 1.5% | Global, led by North America, Europe, and Asia-Pacific (China, Japan, Singapore) | Medium term (2-4 years) |
| Rising Biopharma R&D Budgets Worldwide | 1.3% | Global, concentrated in North America & Europe | Medium term (2-4 years) |
| Automation & High-Throughput Screening Adoption | 1.0% | North America, Europe, and APAC (China, Japan, South Korea) | Medium term (2-4 years) |
| AI-Optimized Reagent Formulation Pipelines | 0.9% | North America & Europe, early adoption in APAC | Long term (≥ 4 years) |
| Localized Manufacturing Hubs In Emerging Markets | 0.7% | APAC core (China, India), spill-over to MEA and South America | Long term (≥ 4 years) |
| Source: Mordor Intelligence | |||
Soaring Demand for Molecular Diagnostics
Point-of-care settings now rely on ready-to-use PCR and isothermal mixes, lifting reagent throughput in hospital networks. The U.S. Food and Drug Administration cleared 23 new in-vitro diagnostic assays in 2025, 17 of which utilize PCR or NGS chemistries. Europe’s IVDR is forcing suppliers to reformulate products with stronger stability data, driving incremental sales of enhanced buffer systems. Infectious-disease surveillance remains central, highlighted by the World Health Organization’s 2025 AMR network that enrolled 120 countries, each standardizing PCR kits for pathogen detection.[3] Lyophilized formulations that ship without refrigeration already represented 18% of PCR unit sales in 2025 and are expanding quickly as telehealth services proliferate.
Expansion of Genomics and Proteomics Research
Population-level sequencing is transitioning from pilots to national programs. The United Kingdom plans to sequence 5 million genomes by 2028, translating into roughly 15 million library prep kits over the span. Japan earmarked USD 800 million in 2025 to link genomic data with electronic medical records, prompting bulk orders for high-throughput sequencing reagents. On the proteomics front, the European Molecular Biology Laboratory established a data repository that sets common sample-prep specifications across laboratory networks. Single-cell sequencing programs funded by the U.S. National Science Foundation are spreading barcoding reagent demand across 30 academic sites.
Rising Biopharma R&D Budgets Worldwide
Roche reported CHF 15.2 billion (USD 17.1 billion) in R&D spending for 2025 with a 40% allocation toward oncology and immunology workflows that intensively use flow-cytometry and cell-culture reagents. Pfizer earmarked USD 13.8 billion for R&D, including USD 2.1 billion devoted to mRNA vaccine platform expansion that leans on nucleotide analogs. CDMOs such as Lonza have followed suit, adding USD 1.2 billion in capacity and locking in reagent supply contracts. Novel therapies such as antibody-drug conjugates consume 3-5 times the reagent volume of traditional small-molecule processes, sustaining double-digit growth across chromatography and conjugation chemistries.
Automation and High-Throughput Screening Adoption
Reagents pre-validated for robotic liquid handlers grew 22% year on year for Thermo Fisher in 2025, triple the pace of manual format products. Danaher reported USD 1.8 billion in automation-compatible reagent sales for 2025, confirming strong laboratory migration to 384-well plates. Accreditation bodies now embed automation performance in their audits, encouraging clinical labs to retire in-house mixes for standardized kits. The combination of speed, lower error rates, and compliance advantages positions automated reagents as a durable growth catalyst.
Restraints Impact Analysis of Biochemical Reagents Market*
| Restraint | (~) % Impact on CAGR Forecast | Geographic Relevance | Impact Timeline |
|---|---|---|---|
| Stringent Regulatory & Compliance Burden | -0.8% | Global, most acute in North America & Europe | Short term (≤ 2 years) |
| Short Shelf-Life and Cold-Chain Costs | -0.6% | APAC, MEA, South America, with moderate impact in rural North America & Europe | Medium term (2-4 years) |
| Enzyme-Supply Geopolitical Concentration Risk | -0.5% | Global, with highest exposure in APAC and MEA dependent on Western suppliers | Medium term (2-4 years) |
| Escalating IP Litigation Delaying Launches | -0.4% | Global, concentrated in North America & Europe due to patent-enforcement infrastructure | Short term (≤ 2 years) |
| Source: Mordor Intelligence | |||
Stringent Regulatory and Compliance Burden
Europe’s IVDR imposes clinical evidence demands that add USD 0.5-2 million to each diagnostic reagent, delaying launches by up to 18 months. The FDA also signaled tighter control over laboratory-developed tests in 2025, unsettling hospital labs that historically prepared their own mixes. Only 40% of Asia-Pacific suppliers held ISO 13485 certification by 2025, limiting their ability to win global contracts. Environmental frameworks such as REACH added 18 solvents to restriction lists, triggering expensive reformulations.
Short Shelf-Life and Cold-Chain Costs
A 2024 PLOS ONE study found that 22% of PCR shipments into sub-Saharan Africa arrived partially degraded, compromising diagnostic accuracy. Temperature-controlled logistics add 15-25% to landed cost in tropical settings, undermining competitiveness versus locally produced goods. Lyophilization increases manufacturing cost by up to 40%, while global cold-chain airfreight capacity grew only 4% in 2025 against 9% demand growth. Hospitals discard 10-12% of inventory annually due to expiry, which deters economies of scale in procurement.
*Our forecasts treat driver/restraint impacts as directional, not additive. The impact forecasts reflect baseline growth, mix effects, and variable interactions.
Biochemical Reagents Market Segment Analysis
By Product Type:
PCR Kits Surge while Chromatography Retains Purification RoleChromatography reagents held 37.63% of the biochemical reagents market share in 2025 and remain central to monoclonal-antibody purification. PCR kits are on course for a 10.44% CAGR to 2031, underpinned by point-of-care testing mandates and wide infectious-disease surveillance. The biochemical reagents market size for PCR kits is projected to grow from USD 11.2 billion in 2026 to USD 18.3 billion by 2031, reinforcing their momentum. Cell and tissue culture reagents continue to climb, energized by the maturing cell-therapy pipeline, while electrophoresis reagents experience moderate growth due to rising adoption of microfluidic alternatives.
Second-generation flow cytometry dyes now support 20-plus-parameter panels, driving 8-9% annual growth in that subcategory. NGS and genomics reagents are set for a steady 9-10% CAGR, buoyed by falling sequencing-run costs and population genomics. Specialty mixes aimed at CRISPR applications and single-cell barcoding grow fastest on a smaller base, capturing premium prices due to their customization level.

By End User:
CROs Accelerate as Biotech Holds Top RankBiotechnology firms consumed 31.56% of the biochemical reagents market in 2025, sustained by heavy early-stage research pipelines. CRO demand is advancing at 10.06% CAGR through 2031, lifted by the outsourcing model favored by big pharma, pushing the biochemical reagents market size among CROs to a projected USD 9 billion by 2031. Pharmaceutical companies maintain a large yet steady footprint, whereas CDMOs represent a rising buyer block, particularly in cell culture media and chromatography resins used for contract biologics manufacture.
Hospitals and diagnostic reference labs are tightening quality controls by migrating to standardized kits. Academic and research institutes remain price sensitive, although new grants for large scale sequencing and proteomics bolster reagent procurement volumes.
By Application:
Genomics Growth Outpaces DiagnosticsClinical diagnostics commanded 39.11% of revenue in 2025, but genomics applications will clock an 11.63% CAGR as more nations roll out population sequencing. That surge will push the biochemical reagents market share of genomics applications closer to one-third of global sales by 2031. Proteomics is rising on the back of improved mass-spectrometry workflows, while drug discovery applications expand steadily as phenotypic assays become mainstream in high-content screening.
By Technology:
PCR Dominates yet NGS Advances RapidlyPCR accounted for 44.23% of sales in 2025, underscoring its diagnostic ubiquity. NGS reagents nevertheless will capture incremental share at a 10.34% CAGR, reflecting the broadening of whole-genome and transcriptome sequencing. Isothermal amplification reagents grow quickly although from a smaller base, and digital PCR enjoys a double-digit trajectory in precision-oncology testing.
Geography Analysis
North America Biochemical Reagents Market
North America generated 44.42% of global revenue in 2025 due to a robust reimbursement environment, mature regulatory pathways, and heavy public research funding. The United States accounts for three-quarters of regional sales and concentrates demand in bioclusters anchored by California and Massachusetts. Canada leverages Genome Canada’s USD 180 million precision-medicine program to drive 5-6% annual growth. Mexico is expanding as pharma manufacturing shifts south, but logistics hurdles slow uptake.
APAC Biochemical Reagents Market
Asia-Pacific is forecast to post a 9.35% CAGR, the fastest for any region. China is progressing from import dependence toward domestic supply, helped by a USD 2.3 billion enzyme facility initiative aimed at 30% local share by 2028. India’s Department of Biotechnology introduced a USD 500 million cold-chain subsidy that improves penetration in tier-2 cities. Japan’s aging population is boosting companion diagnostic volumes, while South Korea capitalizes on biosimilar expansion.
EMEA and South America Biochemical Reagents Market
Europe, anchored by Germany, France, and the United Kingdom. Full IVDR enforcement prompted the withdrawal of about one-third of legacy kits, creating white-space for re-engineered offerings. The Middle East and Africa rise at 6-7% as Saudi Arabia and the United Arab Emirates build genomic centers to diversify their economies. South America advances at a similar clip, led by Brazil where ANVISA’s streamlined approval rules cut regulatory drag.
Regulatory Landscape
Biochemical reagents sold for clinical and diagnostic use fall under in-vitro diagnostic (IVD) and quality-system rules in major markets, which tighten documentation and traceability requirements for manufacturers and, increasingly, for laboratory customers. In the United States, the FDA alignment of the Quality Management System Regulation (QMSR) for 21 CFR Part 820 with ISO 13485:2016 took effect on February 2, 2026, reinforcing design controls, supplier controls, and complaint handling that directly affect assay kits and critical reagent components used in regulated workflows.
In Europe, Regulation (EU) 2017/746 (IVDR) continues to raise the bar for clinical evidence and Notified Body involvement across Class B, C, and D IVDs, shaping product reformulation and stability-data packages for reagent portfolios. Administrative and post-market obligations increased further with the European Commission mandate for the first four EUDAMED modules for MDR- and IVDR-compliant devices from May 28, 2026, adding centralized registration and reporting steps for IVD-linked reagents. Standards activity also feeds into compliance programs, including ISO publications in 2026 covering molecular IVD pre-examination processes and biotechnology provenance and cell-line identification, which labs and suppliers use to align quality and data integrity expectations.
Value Chain Analysis
The biochemical reagents value chain runs from upstream chemical and biological inputs (buffers, solvents, nucleotides, antibodies, resins, and enzymes) through formulation and fill-finish (often with cold-chain or lyophilized options), quality control, and regulatory documentation, then distribution via direct sales, authorized distributors, and e-commerce channels to biopharma, CROs, hospitals, and diagnostic laboratories. Supply reliability depends on a relatively concentrated base for GMP-grade raw materials and specialized biologics inputs, and the market has faced bottlenecks where proprietary enzymes and functionalized chromatography ligands come from limited qualified sources; for GMP-certified enzyme manufacturing, inspection and qualification backlogs of 18-24 months can extend the time required to add capacity.
Downstream, procurement increasingly favors suppliers that can document uninterrupted deliveries and support automation-ready formats for high-throughput labs, shifting bargaining power toward large, vertically integrated players and established distributors. Trade and localization dynamics are also reshaping flows: Chinese pharmaceutical firms have been substituting Western reagent imports with local suppliers to reduce cost and delivery time, while multinationals have been building regional footprints, including Roche announcing an expansion of reagent production, laboratory, and logistics facilities in Suzhou, China (announced August 2025, with operations starting in 2028). Policy-driven supply chain security initiatives and cross-border coordination efforts, such as the Bio-5 Coalition, reinforce the shift toward regional sourcing, dual-qualification of critical inputs, and deeper supplier-audit programs.
Competitive Landscape
The biochemical reagents market remains moderately consolidated. Vertically integrated manufacturing and multi-year supply contracts shield incumbents, yet regional challengers such as Vazyme Biotech and Takara Bio are capturing Asia-Pacific share through 20-30% lower price points and faster delivery. AI-driven reagent design is becoming a competitive frontier; Thermo Fisher reported a 40% cut in time-to-market for bespoke mixes released through its machine-learning platform in 2025. Smaller firms exploit niche gaps with enzyme variants for difficult templates or antibodies validated for new biomarkers, often commanding premium prices despite limited volume. Compliance hurdles—including ISO 13485 certification timelines of up to 24 months—continue to deter new entrants, reinforcing incumbents’ scale advantages.
Biochemical Reagents Industry Leaders
-
Agilent Technologies Inc.
-
Merck KGaA
-
Bio-Rad Laboratories
-
Thermo Fisher Scientific Inc.
-
F. Hoffmann-La Roche Ltd
- *Disclaimer: Major Players sorted in no particular order
Biochemical Reagents Market Companies Covered in this Report
- Abbott Laboratories
- Agilent Technologies
- Beckton Dickinson
- Bio-Rad Laboratories
- Danaher
- Enzo Biochem
- Roche
- Illumina
- Lonza Group
- Merck
- New England Biolabs
- Promega
- QIAGEN
- Revvity
- Siemens Healthineers
- Takara Bio
- Thermo Fisher Scientific
- Vazyme Biotech
- Waters Corporation
Market Opportunities and Future Outlook
Opportunity concentrates in formats and supply models that reduce compliance friction and operational cost for high-throughput and regulated users. IVDR-driven product withdrawals and re-registration burdens in Europe create a practical opening for suppliers that can deliver re-engineered IVD reagent kits with stronger clinical evidence and stability data, and for service offerings that support laboratories as they transition from in-house mixes toward standardized, audited consumables. In the United States, NIH support for genomics and proteomics programs (USD 50.1 billion set aside for fiscal 2025) and ARPA-H funding to accelerate next-generation sequencing and molecular diagnostics platforms (up to USD 2.5 billion) provide visible demand-side pull for high-purity reagents, particularly those optimized for automation and rapid assay development.
A second clear whitespace is in resilient, localized manufacturing and logistics for cold-chain sensitive products, particularly in fast-growing Asia-Pacific hubs where a certification gap persists among suppliers (only 40% of Asia-Pacific suppliers held ISO 13485 certification by 2025). Facility investments point to where competition is building: Toyobo commenced operations at a new culture and purification building at its Tsuruga Biochemicals Plant in April 2024, and Roomey inaugurated a 10,000 square meter IVD production facility in Wuxi, China in August 2025 to scale diagnostic kit production. Product design that lowers temperature exposure risk, such as lyophilized PCR mixes, which represented 18% of PCR unit sales in 2025, and reagent portfolios validated for robotic liquid handlers align with operational constraints in emerging markets and with the broader move toward standardized, audit-friendly workflows in clinical labs and CROs.
Recent Industry Developments in Biochemical Reagents Market
- January 2026: Synthego formally entered molecular and clinical diagnostic reagents, extending its CRISPR-centered capabilities into validated assay consumables. The move broadens competitive intensity in specialized, workflow-ready reagents used in genomics and molecular diagnostics and supports faster deployment of standardized testing inputs across laboratories.
- December 2025: iGeneTech unveiled premixed reagent strips compatible with its IGT-AS12 workstation, offering ready-to-load formats for library preparation workflows. By packaging reagents in automation-aligned consumables, the launch supports higher throughput with lower handling variability and strengthens vendor stickiness around installed instruments.
- September 2025: Illumina launched Illumina Protein Prep, bringing NGS-based proteomics discovery to full commercial availability and enabling integrated multi-omics studies. The offering expands downstream demand for sample prep and sequencing-adjacent reagents tied to proteomics workflows, reinforcing reagent pull-through from platform adoption.
Biochemical Reagents Market Report Scope and Research Methodology
Market Definition and Coverage
This market covers revenue generated from biochemical reagents used to support life-science workflows, including research testing, clinical lab use, and bioprocess related activities. The sizing is kept in value terms in USD and is built across major regions to reflect real purchasing and replenishment patterns.
Scope exclusions: This scope excludes laboratory equipment, durable instruments, and general lab consumables that are not sold as biochemical reagent products.
Segments Covered in This Report
- By Product Type
- PCR Reagent Kits
- Cell & Tissue Culture Reagents
- Electrophoresis Reagents
- Chromatography Reagents
- Flow Cytometry Reagents
- NGS & Genomics Reagents
- Other Specialty Reagents
- By End User
- Biotechnology Companies
- Pharmaceutical Companies
- Contract Research Organisations (CROs)
- CDMOs
- Hospitals
- Diagnostic Laboratories
- Academic & Research Institutes
- By Application
- Genomics
- Proteomics
- Clinical Diagnostics
- Drug Discovery & Development
- Others
- By Technology
- PCR
- Next-Generation Sequencing
- Isothermal Amplification
- Microarray & Others
- By Geography
- North America
- United States
- Canada
- Mexico
- Europe
- Germany
- France
- United Kingdom
- Italy
- Spain
- Rest of Europe
- Asia-Pacific
- China
- Japan
- India
- South Korea
- Australia
- Rest of Asia-Pacific
- Middle East & Africa
- GCC
- South Africa
- Rest of Middle East & Africa
- South America
- Brazil
- Argentina
- Rest of South America
- North America
Data Sources, Market Sizing, and Validation
Desk Research
Desk work starts by mapping how reagents move from manufacturing to end users and how demand shows up in public signals. We rely on public sources such as the US FDA databases, the US National Institutes of Health funding and reporting pages, the World Health Organization publications, and the OECD health and R&D indicators to anchor demand drivers.
To make the model more practical, we also review company annual reports, investor presentations, product catalogs, and reputable science press to understand pricing direction and mix changes. In parallel, we use paid subscriptions for company financials and intelligence plus patent databases to cross-check innovation intensity and new assay adoption signals. These examples are not exhaustive, and many other public sources were also consulted for data collection, validation, and clarification.
Primary Interviews and Surveys
Primary work is used to test the desk assumptions with experts across reagent manufacturing, distribution, and end-user labs, and then to close gaps where public data is not specific enough. We covered a mix of regions and customer groups so that usage patterns in pharma and biotech, hospitals and diagnostic labs, and academic institutes could be compared and normalized.
Distribution of primary research fieldwork respondents
| Company type | Respondent position | Region |
|---|---|---|
| Top tier: 38% | CXOs: 13% | APAC: 41% |
| Mid tier: 47% | Functional/Unit leaders: 27% | EMEA: 34% |
| Smaller Players: 15% | Managers: 60% | Americas: 25% |
Market-Sizing & Forecasting
Sizing is built with a top-down demand pool method where R&D intensity and clinical testing activity are translated into reagent consumption, and then converted into value using typical price ladders by workflow. The totals are then checked through selective bottom-up approximations, such as sampled supplier revenue references, channel checks with distributors, and a volume times average selling price build for a few high-usage reagent families.
Inputs that materially shape the model include public and interview-validated signals such as NIH funding trends, growth in molecular and genomics testing volumes, installed base expansion of high-throughput workflows, shifts toward ready-to-use kits versus bulk formats, and regional price dispersion driven by procurement norms and import reliance. When unit detail is missing for smaller countries, we fill gaps using proxy indicators like lab density and research spend per capita, before it is normalized against peer markets.
For forecasting, we lean on scenario analysis supported by simple multivariate relationships, where volumes are linked to R&D and testing indicators and pricing is guided by mix shifts and inflation expectations validated by interviews. The final curve is reviewed for realism against known adoption cycles so that near-term jumps do not get overstated.
Data Validation & Update Cycle
Outputs are validated by comparing model totals against independent signals such as public R&D spending direction, regional diagnostics growth, and observed pricing ranges from catalogs and distributor feedback. If a country or segment shows a sharp deviation from these signals, the assumptions are reopened and the variance is explained before finalization.
A multi-step review is followed, where another analyst checks formulas, unit logic, and currency conversions, and then flags outliers for rework. Reports are refreshed annually, and interim updates are triggered when large regulatory shifts, major capacity changes, or material demand shocks are observed. Before delivery, we do a final pass to ensure the latest public indicators and expert inputs are reflected.
Mordor Intelligence's Biochemical Reagents Market Size Compared With Other Published Estimates
Published market sizes for biochemical reagents often differ because each publisher draws the line differently on what counts as a reagent sale, which year is treated as the anchor, and how prices are carried forward into the forecast. Small changes in included products or in the way end-use demand is reconstructed can move the final number by several billion dollars.
Laboratory instruments and general lab consumables sit outside Mordor Intelligence's scope, which is why some broader life-science supply figures look higher even when they quote similar growth rates. Other gaps usually come from using a single global price uplift instead of mixing kit formats versus bulk formats, from reporting a different base year with different currency timing, or from not cross-checking the demand side with research funding and clinical testing activity.
Benchmark comparison
| Source | Market Size | Gaps in Research Methodology |
|---|---|---|
| Mordor Intelligence | USD 44.27 B (2025) | |
| Industry Publisher A | USD 46.35 B (2024) | Uses a different base year and a broader category set by grade and source groupings, which can shift pricing and mix assumptions versus workflow-led consumption checks. |
| Global Publisher B | USD 50.02 B (2025) | Includes additional adjacent revenue pools through technique and channel framing, and relies on longer-horizon extrapolation to 2035, which can widen the near-term market level. |
The table shows that most of the spread is explained by what is counted as a reagent revenue line and how base-year prices are carried into the forecast. By keeping the scope tied to defined biochemical reagent products and validating with practical demand indicators, our estimate stays easier to audit and repeat when new data points appear.
Key Questions Answered in the Report
What is the projected value of the biochemical reagents market in 2031?
It is expected to reach USD 66.34 billion by 2031, expanding at a 7.17% CAGR from 2026.
Which product segment is forecast to grow the fastest?
PCR reagent kits are set for a 10.44% CAGR, benefiting from widespread deployment in point-of-care diagnostics.
How large is North America’s share of global sales?
North America accounted for 44.42% of revenue in 2025, the largest regional share.
Why are CROs increasing reagent purchases?
Outsourcing trends in pharmaceutical R&D are driving CRO reagent demand at a 10.06% CAGR through 2031.
Which technology is gaining ground on PCR?
Next-generation sequencing reagents are increasing at a 10.34% CAGR as whole-genome studies proliferate.