
Billiards And Snooker Equipment Market Size and Share
Market Overview
| Study Period | 2021 - 2031 |
|---|---|
| Market Size (2026) | USD 359.84 Million |
| Market Size (2031) | USD 418.07 Million |
| Growth Rate (2026 - 2031) | 3.05 % |
| Fastest Growing Market | Asia Pacific |
| Largest Market | North America |
| Market Concentration | Medium |
Major Players *Disclaimer: Major Players sorted in no particular order Image © Mordor Intelligence. Reuse requires attribution under CC BY 4.0. | |
Billiards And Snooker Equipment Market Analysis by Mordor Intelligence
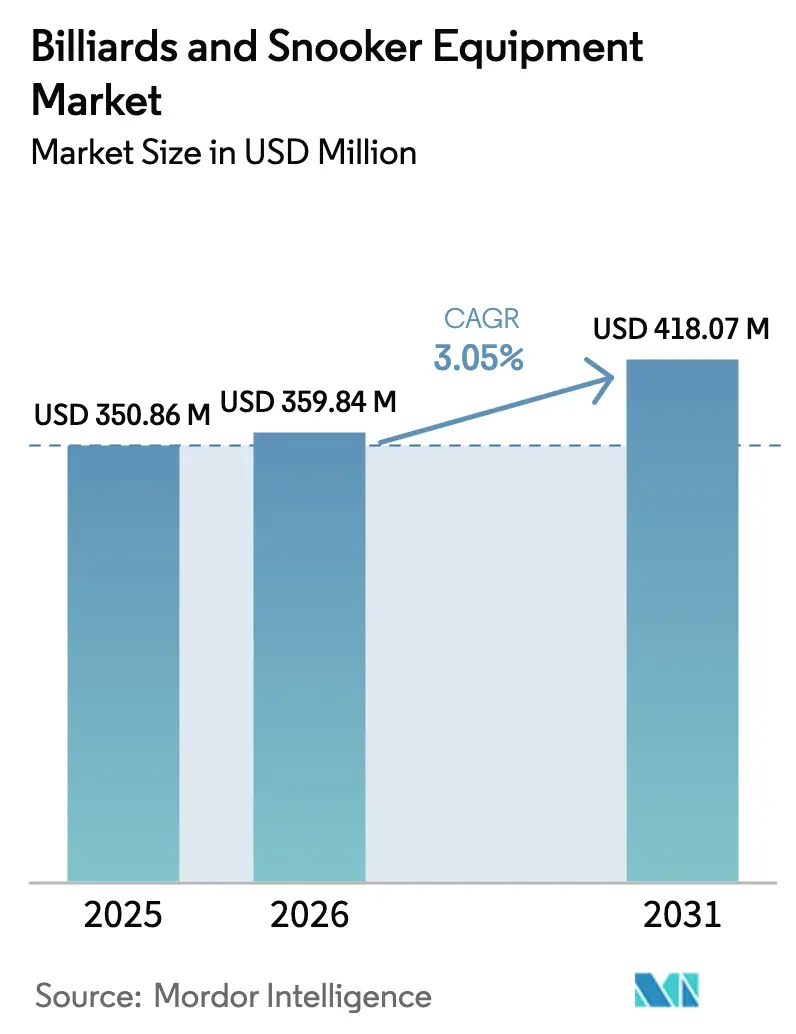
The billiards and snooker equipment market size is expected to grow from USD 350.86 million in 2025 to USD 359.84 million in 2026 and is forecast to reach USD 418.07 million by 2031 at a 3.05% CAGR over 2026-2031. This growth pace mirrors the industry's long replacement cycles, often punctuated by premium upgrades. Three key forces drive this expansion: venues leveraging technology to monetize tables hourly, direct-to-consumer platforms enhancing global pricing transparency, and the rise of carbon-fiber cues, which have reduced replacement intervals to as short as five years. While pool remains the primary revenue driver, especially in North America's and Europe's bar culture, snooker is witnessing the fastest growth, thanks to streaming platforms promoting it in emerging Asian markets. Commercial operators are investing in high-durability tables to maximize profit per square foot, while affluent homeowners are driving a premium surge in personal purchases. Furthermore, online storefronts, equipped with 3-D configurators and white-glove delivery, are breaking geographic barriers, directing a significant portion of discretionary spending towards specialty equipment.
Key Report Takeaways
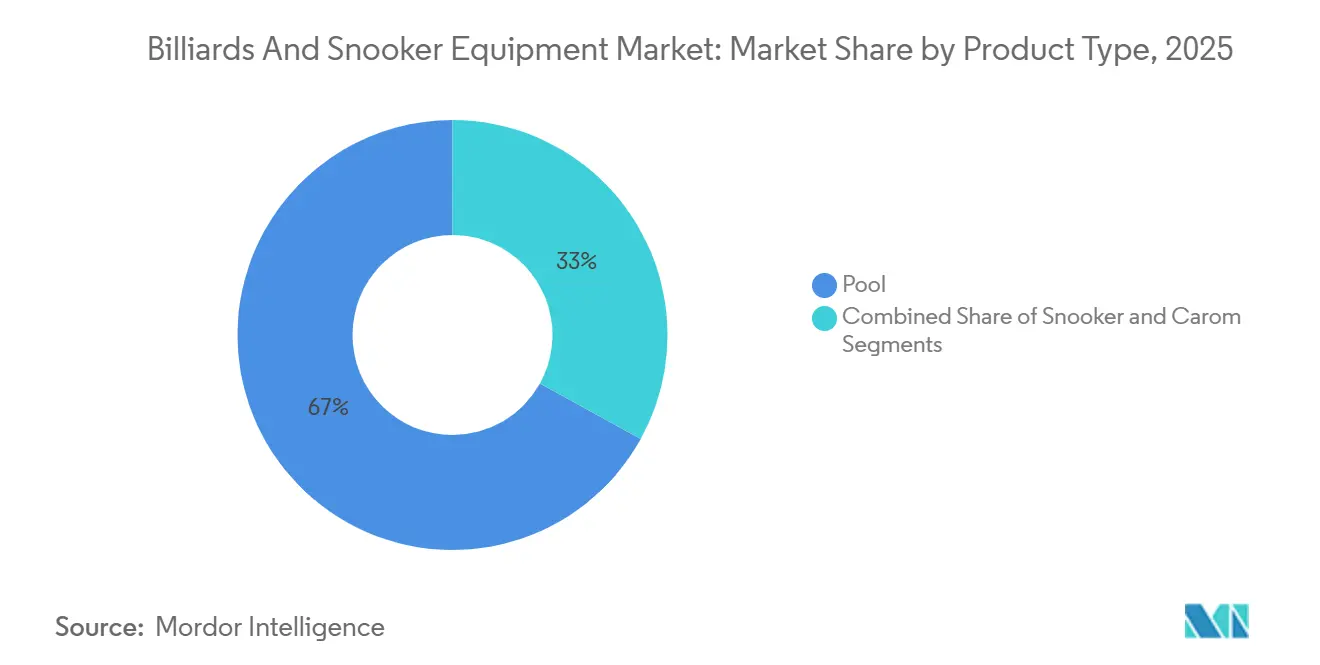
- By product type, pool led with 66.96% of the billiards and snooker equipment market share in 2025; snooker is projected to expand at a 3.20% CAGR through 2031.
- By equipment, tables accounted for 59.82% of the billiards and snooker equipment market size in 2025, while cues are advancing at a 3.78% CAGR through 2031.
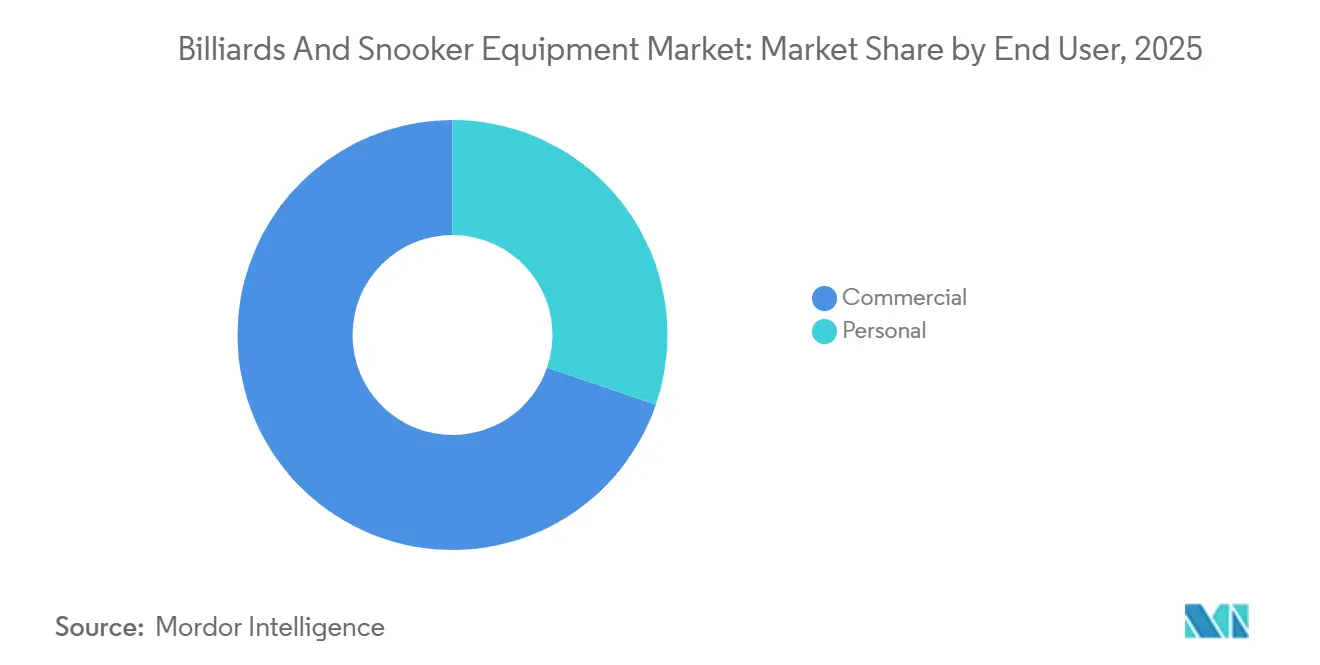
- By end user, commercial venues held 69.74% revenue share in 2025; personal buyers record the highest forecast CAGR at 3.93% between 2026 and 2031 in the end user segment.
- By distribution channel, offline outlets commanded 72.57% of 2025 revenue, whereas online sales are projected to increase at a 4.36% CAGR to 2031.
- By geography, North America contributed 37.43% of 2025 turnover; Asia-Pacific is the fastest-growing region with a 3.96% CAGR forecast to 2031.
Note: Market size and forecast figures in this report are generated using Mordor Intelligence’s proprietary estimation framework, updated with the latest available data and insights as of January 2026.
Market Trends and Insights
Drivers Impact Analysis of Billiards And Snooker Equipment Market*
| Driver | (~) % Impact on CAGR Forecast | Geographic Relevance | Impact Timeline |
|---|---|---|---|
| Expansion of premium in-home game rooms | +0.6% | North America and Europe, spillover to the Gulf Cooperation Council | Medium term (2-4 years) |
| Urban pool-bar and experiential venue boom | +0.8% | Global, with concentration in the UK, US metro areas, Southeast Asia gateway cities | Short term (≤ 2 years) |
| Direct-to-consumer e-commerce unlocks global niche demand | +0.5% | Global, particularly strong in North America, Western Europe, and urban Asia-Pacific | Medium term (2-4 years) |
| Carbon-fiber/low-deflection cue innovation accelerates upgrade cycles | +0.4% | North America, Europe, Australia; emerging uptake in China, India | Long term (≥ 4 years) |
| Youth engagement via streamed cue-sport tournaments and influencers | +0.3% | Global, led by the UK, China, Thailand, growing in India, the Middle East | Long term (≥ 4 years) |
| Government-backed sports academies in emerging Asia and Africa | +0.2% | Asia-Pacific core (China, India, Thailand), nascent in Nigeria, Egypt | Long term (≥ 4 years) |
| Source: Mordor Intelligence | |||
Expansion of premium in-home game-rooms
Affluent households are transforming underutilized spaces into dedicated game rooms, with billiard tables taking center stage as symbols of leisure sophistication. Legacy Billiards and GameTablesOnline have noted a rise in inquiries for custom 8-foot and 9-foot tables featuring designer finishes. Meanwhile, professional installation networks have ramped up their capacity, offering services like leveling and cloth tensioning, tasks that buyers find challenging to replicate. This trend has created a split in demand: high-net-worth individuals are investing in tournament-grade tables, often exceeding USD 8,000, while upper-middle-income buyers are leaning towards 7-foot convertible models that serve a dual purpose as dining surfaces. This shift is not only speeding up replacement cycles in established markets, where homeowners who opted for entry-level tables in the 2010s are now gravitating towards premium brands, but also unveiling new opportunities in Gulf Cooperation Council nations, where newly constructed villas are increasingly featuring game rooms.
Urban pool-bar and experiential venue boom
Hospitality operators are transforming pool halls into tech-savvy social hubs, merging cue sports with craft cocktails, live music, and digital scoreboards. In 2024, Poolhouse secured USD 34 million in seed funding, eyeing a 2026 debut in London. Their venue will boast app-based table reservations, overhead coaching displays, and tiered memberships for priority bookings. This innovative approach views tables as revenue-generating assets, not mere fixtures. It fuels demand for commercial-grade equipment, built for 12-hour daily use, and integrated scoring systems, catering to casual players unfamiliar with traditional scorekeeping. This experiential shift is pushing manufacturers to provide shorter lead times and modular designs, as venue operators refresh layouts every 3-5 years to keep things fresh.
Direct-to-consumer e-commerce unlocks global niche demand
Online platforms are dismantling geographic barriers that once confined buyers to local retailers with limited inventory. Predator and XingPai launched configurator tools in 2024 that let customers select cloth color, pocket style, and leg finish, then arrange white-glove delivery and installation without visiting a showroom. This shift compresses price discovery; buyers compare specifications and reviews across brands in minutes, and it expands addressable markets in regions where specialty billiard retailers are sparse, such as Scandinavia, Eastern Europe, and Latin America. E-commerce also enables niche segments: left-handed cues, custom-length shafts, and low-deflection tips that brick-and-mortar stores rarely stock. The channel's 4.36% CAGR through 2031 reflects its structural advantage in serving long-tail demand and in reducing distribution costs that manufacturers can reinvest in product innovation.
Carbon-fiber/low-deflection cue innovation accelerates upgrade cycles
Advanced materials are reshaping performance benchmarks, leading industry players to swap out traditional maple cues for carbon-fiber shafts that promise tighter shot dispersion. Predator's REVO shaft, boasting a layered composite design, claims to cut cue-ball deflection by 30% compared to standard wood. This assertion is backed by patents filed in 2024, focusing on fiber orientation and resin bonding. Cuetec and McDermott have also jumped on the bandwagon, filing similar patents for hybrid carbon-maple designs, underscoring a collective industry shift towards these engineered materials. Thanks to these advancements, the upgrade cycle has shrunk from the usual 10-plus years of a maple cue's lifespan to a mere 3-5 years. Players are noticing tangible accuracy improvements, and with tournament organizers now endorsing carbon shafts in official events, the shift is even more pronounced. Additionally, this trend has birthed a secondary market for used maple cues. Entry-level players are snapping them up at discounted rates, broadening the player base without denting new-cue sales.
Restraints Impact Analysis of Billiards And Snooker Equipment Market*
| Restraint | (~) % Impact on CAGR Forecast | Geographic Relevance | Impact Timeline |
|---|---|---|---|
| Raw-material inflation | -0.4% | Global, with acute issues in North America and Europe, primarily due to the sourcing of hardwood and slate. | Short term (≤ 2 years) |
| Competition from console/virtual reality (VR) gaming for leisure time | -0.3% | Global, most pronounced in North America, Europe, and urban Asia-Pacific | Medium term (2-4 years) |
| Counterfeit and low-quality imports erode brand equity | -0.2% | Global, concentrated in Asia-Pacific, the Middle East, and Latin America | Medium term (2-4 years) |
| Urban living space constraints limit full-size table installs | -0.2% | Urban Asia-Pacific, European city centers, North American metro areas | Long term (≥ 4 years) |
| Source: Mordor Intelligence | |||
Raw-material inflation
Manufacturers grapple with persistent cost pressures on core inputs, including slate, hardwood, and phenolic resin, used for tables, cues, and balls, as they struggle to pass these costs onto price-sensitive buyers. Yushan County in China, recognized as the world's largest billiard-slate production hub, ships out 250,000 slabs annually, boasting an output value exceeding CNY 1.5 billion (around USD 206 million)[1]Source: Yushan County Government, “Slate Industry Report 2025,” yushan.gov.cn. However, quarry operators in the region are contending with rising labor and energy costs, leading to slab price surges in the double digits since 2024. Meanwhile, maple and ash hardwoods, predominantly sourced from North American forests, faced supply constraints in 2024-2025. This was attributed to diminished logging activities and export restrictions. On the other hand, phenolic resin, a key ingredient in Aramith balls, is reliant on petrochemical feedstocks, making it vulnerable to fluctuations in crude oil prices. These mounting input pressures are tightening margins for mid-tier brands, which lack the leverage to adjust prices. As a result, these brands are left with two choices: absorb the rising costs or risk a decline in sales volume. Furthermore, these challenges are driving manufacturers to consider vertical integration, with many exploring direct ownership of quarries and lumber mills.
Competition from console/virtual reality (VR) gaming for leisure time
The global billiards and snooker equipment market grapples with challenges as console and virtual reality (VR) gaming rapidly expand, vying for the limited leisure time of the younger, tech-savvy crowd. By 2026, the VR gaming market is on the rise, buoyed by immersive hardware like the PlayStation VR2, which slashed its prices in 2025 to attract a broader audience. This digital evolution gains momentum with government backing, exemplified by India's 2025 Promotion and Regulation of Online Gaming Act. This act lays down a national framework, championing e-sports and safe digital play as viable career and recreational avenues for the youth. In response to lengthy product replacement cycles and the growing appeal of virtual alternatives, manufacturers are rolling out significant technological innovations. A case in point: Brunswick Billiards, in February 2024, unveiled a new range of smart cues. These cues, boasting Bluetooth and sensors, provide real-time ball tracking and shot analytics, mirroring the data-centric feedback found in video games.
*Our forecasts treat driver/restraint impacts as directional, not additive. The impact forecasts reflect baseline growth, mix effects, and variable interactions.
Billiards And Snooker Equipment Market Segment Analysis
By Product Type:
Pool Dominates, Snooker Gains Streaming LiftIn 2025, Pool captured 66.96% of product-type revenue, driven by its strong presence in North American bars, European leisure centers, and Latin American social clubs, where 7-foot and 8-foot tables fit standard floor plans, and gameplay rules are simple. Snooker, with a smaller revenue share, is projected to grow fastest at a 3.20% CAGR through 2031, supported by broadcast deals expanding the World Snooker Tour's reach in Asia and prize funds reaching GBP 2.395 million (around USD 3.0 million) for the 2024 World Championship. The 2025 championship saw 29 million streams on BBC platforms, a 25% year-over-year increase, and 12.6 million television viewers, highlighting snooker's ability to convert casual audiences into equipment buyers. Carom, popular in continental Europe and parts of Asia, grows modestly as niche clubs sustain demand for pocketless tables and specialized cushion rubber. The product-type split reflects a strategic contrast: pool's mass-market appeal drives volume, while snooker's premium positioning and tournament visibility attract aspirational buyers investing in full-size 12-foot tables.
Streaming platforms are reshaping product preferences by exposing casual viewers to professional equipment. Billiard TV, a cue-sports streaming service, recorded 65 million unique viewers in 2024, a 63% year-over-year jump, with an average watch time of 80 minutes per session and over 1,000 hours of live programming in 2025. This visibility drives equipment inquiries, as viewers search for products like Predator Apex tables or REVO carbon-fiber cues seen in tournaments, creating a halo effect for sponsored brands. Snooker's growth benefits from its longer matches and higher skill ceiling, appealing to viewers seeking strategic depth. The BBC-WST broadcast deal through 2032 ensures sustained media exposure for the sport.


By Equipment:
Tables Lead Revenue, Cues Post Fastest GrowthIn 2025, tables commanded 59.82% of the equipment revenue, bolstered by their pricing and decades-long replacement cycles, marking them as the most significant purchase in a player's lifetime. Cues, on the other hand, are set to experience the fastest growth at a 3.78% CAGR through 2031. This surge is fueled by innovations in carbon fiber, which shorten upgrade cycles, and a trend towards customization, with players opting for multiple cues tailored to different shot types. Predator's Apex Pro 9-foot table, retailing at USD 9,995, underscores the premium segment's robustness. In contrast, the Apex Premier League 7-foot model, priced at USD 6,795, caters to buyers with limited space who value brand prestige over tournament dimensions. Balls and accessories, like chalk, tips, and gloves, make up the rest, capitalizing on the consumable nature that ensures steady revenue streams.
Manufacturers are rapidly innovating cues, evidenced by 2024 patent filings from Clawson, Cuetec, and McDermott. Their submissions highlight advancements in carbon-fiber layering, low-deflection joints, and vibration-damping inserts. Such innovations resonate with competitive players seeking precision and recreational buyers viewing premium cues as symbols of status. This evolution also paves the way for aftermarket services: specialty retailers are capitalizing on tip replacements, shaft refinishing, and joint upgrades through lucrative service packages. While tables, due to their mechanical simplicity, undergo slower innovation cycles, manufacturers are venturing into tech enhancements. They're integrating features like sensors to monitor shot speed and spin, and LED lights to emphasize optimal aim points, aiming to justify premium prices and stand out in a crowded market.
By End User:
Commercial Anchors Volume, Personal AcceleratesIn 2025, commercial end-users accounted for a dominant 69.74% of the revenue, buoyed by pool halls, sports bars, and hospitality chains. These establishments view tables as profit-generating assets, raking in hourly rental fees, beverage sales, and membership dues. Poolhouse's successful USD 34 million seed round in 2024 underscored the viability of the experiential-venue model. Here, tech-enhanced tables and app-driven reservations boost utilization rates, and premium finishes command elevated hourly rates. Meanwhile, personal buyers, holding the remaining market share, are projected to expand at a robust 3.93% CAGR through 2031. This growth is fueled by affluent homeowners transforming basements and garages into game rooms, alongside the rising popularity of compact 7-foot tables tailored for urban apartments. This segment's surge mirrors a broader trend in home entertainment spending, with households increasingly investing in durable leisure assets. These include home theaters, gym equipment, and game tables, all of which promise extended utility and reflect aspirational lifestyles.
E-commerce platforms play a pivotal role in streamlining the buying journey for the personal segment. Configurator tools empower buyers to visualize cloth colors and leg finishes in their own spaces. Meanwhile, premium delivery services manage installation and leveling, tasks that previously necessitated specialized contractors. On the other hand, commercial buyers emphasize durability and serviceability. They favor slate beds over MDF alternatives and opt for replaceable cushion rubber, designed to endure rigorous 12-hour daily use. This divergence in preferences has led to distinct supply chains: commercial equipment traverses dealer networks that bundle maintenance contracts, while personal equipment predominantly flows through online channels, spotlighting price transparency and home delivery. This evolving landscape indicates that manufacturers are adopting dual go-to-market strategies. Commercial sales hinge on relationship-driven selling, whereas personal sales lean heavily on digital marketing and customer testimonials.
By Distribution Channel:
Offline Holds Share, Online SurgesIn 2025, offline channels secured 72.57% of distribution revenue, largely due to specialty retailers. These retailers, offering professional installation, leveling services, and valued in-store consultations, cater to buyers making high-ticket purchases. Acting as showrooms, they allow customers to test table responsiveness and cue balance before purchase, a tactile experience absent in online platforms. Meanwhile, online channels, accounting for 27.43% of sales in 2025, are set to experience the most significant growth, projected at a 4.36% CAGR through 2031. This surge is driven by D2C brands sidestepping retail markups and configurator tools, enabling buyers to customize specifications remotely. In 2024, Predator and XingPai introduced these tools, allowing customers to choose cloth color, pocket style, and leg finish, and coordinate delivery and installation via third-party networks.
This online momentum mirrors a generational shift in purchasing habits: younger consumers value price transparency and customer reviews more than in-store expertise. They also leverage social media and streaming platforms for product research. With Billiard TV boasting 65 million unique viewers in 2024, brands see a prime opportunity for targeted digital ads and influencer collaborations. In response, offline retailers are adopting omnichannel strategies, offering click-and-collect services, virtual consultations, and financing plans, merging digital ease with personal touch. This distribution trend highlights a broader shift: while offline channels will continue to dominate commercial sales, where relationship-driven selling and maintenance contracts are crucial, online platforms are poised to lead in personal sales, prioritizing price and convenience over tactile assessments.
Geography Analysis
North America Billiards and Snooker Equipment Market
In 2025, North America accounted for 37.43% of global revenue, driven by the U.S.'s extensive pool halls, sports bars, and home game rooms. However, growth in the region will lag due to market maturity, extending replacement cycles, and urban space constraints limiting new installations. Canada and Mexico contribute modestly, with Canada's billiard culture centered in Ontario and Quebec, and Mexico's demand stemming from social clubs in metropolitan areas. The region's growth is shaped by two trends: a premium-segment surge as affluent buyers opt for tournament-grade tables and carbon-fiber cues, and a volume decline as younger audiences shift to console gaming and VR platforms. Predator's April 2024 launch of a Jacksonville showroom and production hub highlights confidence in North America's demand, particularly for high-margin items like the REVO carbon-fiber shaft.
APAC Billiards and Snooker Equipment Market
Asia-Pacific, with a smaller share in 2025, is set for the fastest growth at a 3.96% CAGR through 2031. This growth is driven by government-supported sports academies in China and India, the World Snooker Tour's decision to host ranking events in Thailand and Singapore, and Yushan County in China, which produces 250,000 slate slabs and 50,000 tables annually for export to over 70 countries. India's 2025 National Sports Policy mandates that grassroots programs receive 20% of National Sports Federation assistance, with 10% allocated to coaching infrastructure, boosting equipment demand. In April 2025, China's World Snooker Academy opened a 1,300-square-meter branch in Chengdu with 22 tables and a 3-year vocational program, emphasizing China's focus on nurturing talent and expanding its player base. Thailand and Singapore, as Southeast Asian hubs, host professional tournaments that drive media exposure and local demand for premium equipment.
Europe, LATAM and Africa Billiards and Snooker Equipment Market
Europe, holding a moderate share in 2025, sees steady growth. The UK, Germany, and France sustain demand through established club networks. The 2025 World Championship attracted 29 million streams and 12.6 million TV viewers, converting passive audiences into equipment buyers. A BBC-WST broadcast deal through 2032 ensures continued media exposure. Additionally, a 2024 partnership between the European Pool and Billiard Federation and Predator boosts brand visibility at regional tournaments. In Latin America, Brazil and Argentina lead demand through social clubs, while Turkey and South Africa anchor their regions. Despite challenges like infrastructure gaps and limited specialty retailers, emerging markets increasingly rely on online channels, leveraging D2C platforms and third-party logistics partnerships.
Regulatory Landscape
Regulation for billiards and snooker equipment is primarily routed through broad consumer-product safety and chemical-compliance regimes, with country-level technical standards shaping product testing and procurement. In the United States, products fall under the Consumer Product Safety Act framework and related requirements (including CPSIA provisions relevant to hazardous substances and product safety). These regimes can trigger corrective actions when hazards emerge, which typically pushes brands and retailers to tighten pre-shipment QC and improve traceability.
Alongside mandatory safety frameworks, conformity requirements and play-standardization come through national standards and sport governing bodies. China maintains an equipment-specific table standard, GB/T 22751-2008, which defines terminology, classification, requirements, and test methods for billiard tables and influences domestic manufacturing and export documentation. For tournament-facing equipment, associations such as WPBSA (snooker and English billiards) and WPA (pool) publish rules and recommended equipment specifications that manufacturers and venues use as procurement benchmarks, creating an additional layer of assurance for premium and professional-grade products.
Value Chain Analysis
The value chain begins with raw materials and components, where slate for table beds and hardwoods for frames and cues (along with phenolic resin for balls and specialty textiles for cloth) drive both cost and lead-time variability. China anchors a large share of upstream and midstream activity through manufacturing clusters, with Yushan County serving as a major slate and table production hub (as noted in the report context for high-volume slate output). This supports vertically integrated producers that can shorten lead times by controlling critical inputs.
Midstream manufacturing includes slate cutting and leveling, cabinet and rail fabrication, finishing, and assembly, followed by packaging and logistics for bulky, damage-sensitive tables and higher-velocity cues and accessories. Downstream routes split by buyer type: commercial venues often procure through dealers that bundle installation, leveling, and maintenance contracts, while personal buyers increasingly rely on D2C and online configurations paired with third-party white-glove delivery networks. Aftermarket services such as cloth replacement, cushion or rubber servicing, tip replacement, and shaft refinishing also extend the chain into recurring revenue and influence brand preference, particularly as carbon-fiber and low-deflection cue innovation increases upgrade frequency and raises demand for certified repair and fitting services.
Competitive Landscape
Brunswick, Predator, and XingPai, three established players in the billiards and snooker equipment market, leverage decades-old dealer networks, tournament sponsorships, and strong brand equity to command premium pricing. Dominating the manufacturing scale, XingPai has produced over 500,000 tables and exports to more than 70 countries. By controlling slate sourcing from its base in Yushan county, it offers vertically integrated production, significantly reducing lead times. In August 2024, Predator announced a multi-year partnership with the European Pool and Billiard Federation and became the official table partner for the WPA World Championship, highlighting the strategic importance of tournament visibility in influencing buyer preferences. Meanwhile, smaller players like Poolhouse, which secured USD 34 million in seed funding in 2024, are revolutionizing the experiential-venue segment by positioning tables as tech-enabled assets that generate hourly revenue instead of being mere one-time sales.
Two emerging opportunities stand out: tech-integrated tables equipped with sensors to track shot accuracy and provide real-time coaching prompts, and subscription models for cue maintenance and cloth replacement, turning one-time buyers into recurring revenue streams. Patents filed in 2024 by Clawson, Cuetec, and McDermott, focusing on carbon-fiber cue construction and low-deflection joint mechanisms, highlight an innovation race where intellectual property will set premium brands apart from commodity producers. The competitive landscape showcases geographic specialization: North American brands prioritize premium finishes and customization, European manufacturers hone in on tournament-grade precision, and Asian producers capitalize on cost advantages to dominate volume segments.
As brands adopt RFID tags, holograms, and DNA coding to combat counterfeiting, they're responding to the 152 million counterfeit items detained in the EU in 2023, with a staggering value exceeding EUR 3.4 billion[2]Source: European Commission, “Report on Detained Counterfeit Goods 2023,” ec.europa.eu. This move aligns with ISO 22383:2020 guidelines for authentication solutions and the EU Commission's 2024/915 Recommendation on anti-counterfeiting measures, underscoring the industry's commitment to quality standards[3]Source: ISO, “ISO 22383:2020 Standards,” iso.org.
Billiards And Snooker Equipment Industry Leaders
XingPai
Predator Group
Escalade, Inc.
Guangzhou Shender Billiards Co., Ltd.
Riley Leisure Limited
- *Disclaimer: Major Players sorted in no particular order

Billiards And Snooker Equipment Market Companies Covered in this Report
- Escalade, Inc.
- Riley Leisure Limited
- XingPai
- Clawson Custom Cues, Inc. (Predator Group)
- Diamond Billiard Products, Inc.
- Chevillotte
- Guangzhou Shender Billiards Co., Ltd.
- Peradon Limited
- Saluc SA
- Guangzhou Junbao Sports Goods Co., Ltd.
- Norditalia Ricambi s.r.l.
- Wiraka Pte Ltd
- BCE Distributors Limited
- American Heritage Billiards, LLC
- H. Betti Industries, Inc.
- Envisage Co., Ltd.
- Viking Cue Manufacturing, LLC
- McDermott Cue Mfg., LLC
- Meucci Cues
- Clawson Custom Cues, Inc.

Market Opportunities and Future Outlook
Tournament-linked standardization and product visibility continue to create opportunities for brands that secure official-equipment positions and convert that presence into retail demand across tables, balls, and cues. Matchroom naming Dynaspheres as the official ball sponsor of the World Nineball Tour (Titan Series) provides a tangible example of how tour partnerships can set reference products for clubs, academies, and serious amateurs, supporting premium ball adoption and repeat consumables purchasing. Governing bodies such as WPBSA and WPA also keep equipment specifications central to competitive play, reinforcing opportunities for manufacturers that can certify conformity and supply consistent global SKUs.
Technology and venue monetization are also expanding demand for higher-spec, serviceable equipment packages rather than one-off table purchases. Evidence of smart-table concepts, including a showcased table with automated ball-arranging capability at an industry exhibition in 2026, aligns with commercial operators treating tables as high-utilization assets and supports integrated add-ons such as scoring and booking integration, along with durability-focused components. On the channel side, manufacturing footprint expansion and consolidation support new strategies. Predator Group completing an acquisition of Portugal-based Bilhares Carrinho in 2025 offers a pathway to European production and faster regional fulfillment, which can improve lead times and customization for both offline dealers and online configurator-driven buyers.
Recent Industry Developments in Billiards And Snooker Equipment Market
- May 2026: XingPai Billiards launched the ZINOVA snooker table at the 2026 Canton Fair, signaling a broader product push for professional venues. The release reinforces XingPai's position as an export-oriented manufacturer with flagship models for distributors and venue operators.
- July 2025: Predator Group completed the acquisition of Portuguese manufacturer Bilhares Carrinho to expand manufacturing capacity and establish a stronger European production base. The deal enables shorter fulfillment timelines for customized tables and cues and strengthens its regional supply-chain control.
- August 2024: Predator Group announced a multi-year partnership with the European Pool and Billiard Federation and became the official table partner for WPA World Championship events in the region. This expands brand exposure among clubs and competitive players.


Billiards And Snooker Equipment Market Report Scope and Research Methodology
Market Definition and Coverage
This market covers revenue generated from equipment used to play billiards and snooker, counted when products are sold through offline or online channels to personal buyers or commercial venues across the covered geographies.
Scope exclusions: services (club entry, coaching, and table rental), used equipment resale, and betting related activity are excluded.
Segments Covered in This Report
- Product Type
- Carom
- Pool
- Snooker
- Equipment
- Table
- Ball
- Cue
- Others
- End User
- Commercial
- Personal
- Distribution Channel
- Offline Channels
- Online Channels
- Geography
- North America
- United States
- Canada
- Mexico
- Rest of North America
- Europe
- United Kingdom
- Germany
- France
- Italy
- Spain
- Sweden
- Belgium
- Poland
- Netherlands
- Rest of Europe
- Asia-Pacific
- China
- Japan
- India
- Thailand
- Singapore
- Indonesia
- South Korea
- Australia
- New Zealand
- Rest of Asia-Pacific
- South America
- Brazil
- Argentina
- Peru
- Colombia
- Chile
- Rest of South America
- Middle East and Africa
- South Africa
- Nigeria
- Egypt
- Morocco
- Turkey
- Rest of Middle East and Africa
- North America
Data Sources, Market Sizing, and Validation
Desk Research
Desk research was used to set the market boundaries, create a clean product list, and build the first view on demand signals across regions. We referred to public sources such as UN Comtrade trade statistics, World Bank and IMF macro indicators, government statistical offices that publish consumer spending and retail series, and customs or tariff schedules that help map relevant product codes.
To keep the model grounded in real market behavior, we also reviewed brand websites and product catalogs, annual reports and investor presentations where available, and reputable press coverage on cue sports participation and venue expansion. Patents and technical literature (through patent databases and peer reviewed journals) helped validate material shifts and table component changes that can move average selling prices. We also used paid subscriptions for company financials and news intelligence, plus shipment level import export databases where they improved cross checks. These examples are not exhaustive, and many other sources were used for data collection, validation, and research clarification.
Primary Interviews and Surveys
Primary work focused on checking what actually sells by equipment category, how pricing moves across entry and premium ranges, and how demand splits between commercial venues and home buyers. We spoke with manufacturers, distributors, specialty retailers, and commercial operators across APAC, EMEA, and the Americas so that desk assumptions could be corrected before finalizing the model.
Distribution of primary research fieldwork respondents
| Company type | Respondent position | Region |
|---|---|---|
| Top tier: 27% | CXOs: 20% | APAC: 41% |
| Mid tier: 52% | Functional/Unit leaders: 22% | EMEA: 34% |
| Smaller Players: 21% | Managers: 58% | Americas: 25% |
Market-Sizing & Forecasting
Market size was first reconstructed using a top-down approach where participation and venue indicators are converted into an equipment demand pool, and then filtered through replacement cycles and typical spend per setup. Once the demand pool was built, it was translated into value by applying region specific pricing ranges for tables, cues, balls, and accessories, followed by channel mix adjustments.
To keep the totals realistic, we corroborated them using selective bottom-up approximations, such as sampling average selling prices from catalogs and retail listings, and then applying plausible unit volumes tied to venue counts and household uptake. Inputs that mattered most included cue sports participation levels, number of clubs and entertainment venues adding tables, import intensity for tables and cues, promotional seasonality around tournaments, and pricing shifts tied to materials and freight costs. Where bottom-up inputs were thin in smaller countries, gaps were handled by using proxy ratios from similar markets and then stress testing the result in expert calls.
Forecasts were developed using scenario analysis supported by trend checks on participation, venue openings, and consumer discretionary spending. Assumptions were reviewed with industry respondents so the growth path did not rely on a single aggressive adoption story, and we kept currency conversions consistent within the model year to reduce noise.
Data Validation & Update Cycle
Validation was done through multiple checks so that one data point did not overly drive the outcome. We compared the model against independent signals like trade flows for relevant equipment categories, price ranges seen in retail channels, and the pace of venue additions in key cities, and then anomalies were investigated before final sign-off.
A second analyst review was used to test the logic and confirm that assumptions stay consistent across regions and years. Reports are refreshed annually, with interim updates when material events impact pricing, supply availability, or consumer demand. Before delivery, a final refresh pass is completed so clients receive the latest updated view.
Mordor Intelligence's Billiards and Snooker Equipment Market Size Compared Against Other Published Estimates
Published market sizes for billiards and snooker equipment can vary because the scope line is not always drawn the same way, and because different teams rely on different demand signals when direct sales data is limited. We also see differences when base years are not aligned and when currency timing or inflation handling is not clearly stated.
By tracking replacement cycles and retail price bands by equipment type, Mordor Intelligence keeps the 2026 total tied to tables, cues, balls, and accessories purchased for personal and commercial use, and it avoids counting adjacent spend like venue services that can inflate totals.
Benchmark comparison
| Source | Market Size | Gaps in Research Methodology |
|---|---|---|
| Mordor Intelligence | USD 359.84 M (2026) | |
| Industry Publisher A | USD 375.85 M (2026) | Uses a higher starting value in the same year, which can come from broader accessory counting and faster assumed ASP progression across regions, especially when commercial venue demand is generalized. |
| Research Publisher B | USD 368.60 M (2024) | Uses a different base year and a different inflation and currency timing, which can shift the starting point before forecasting, and may also blend material based equipment definitions that change what is counted as core equipment. |
The table shows that most of the spread is explained by year alignment and what gets counted as equipment versus adjacent spending, followed by how pricing is stepped forward by region. Our approach stays traceable to simple demand indicators and repeatable checks, which makes the final number easier to defend on a client call.


Key Questions Answered in the Report
How big is the billiards and snooker equipment market in 2026?
The billiards and snooker equipment market size is expected to grow from USD 350.86 million in 2025 to USD 359.84 million in 2026 and is forecast to reach USD 418.07 million by 2031 at a 3.05% CAGR over 2026-2031.
Which product type contributes the most revenue?
Pool equipment delivers 66.96% of 2025 sales because it dominates bars and recreational centers across mature economies.
What equipment segment is growing fastest?
Cues post the highest forecast CAGR at 3.78% as carbon-fiber shafts shorten upgrade cycles from a decade to about five years.
Why is Asia-Pacific the growth leader?
Government-funded academies, new World Snooker Tour events, and large-scale manufacturing hubs push the region to a 3.96% CAGR through 2031.
How are online sales changing distribution?
Digital channels already account for 27.43% of purchases and will climb fastest at a 4.36% CAGR through 2031 because configurators and white-glove delivery simplify buying high-value tables and cues.
Page last updated on:


 Your data is secure and never sold or shared.


