
Market Overview
| Study Period | 2020 - 2031 |
|---|---|
| Forecast Data Period | 2026 - 2031 |
| Base Year Market Size (2025) | USD 40.52 Billion |
| Market Size (2026) | USD 42.84 Billion |
| Market Size (2031) | USD 56.58 Billion |
| Growth Rate (2026 - 2031) | 5.73 % |
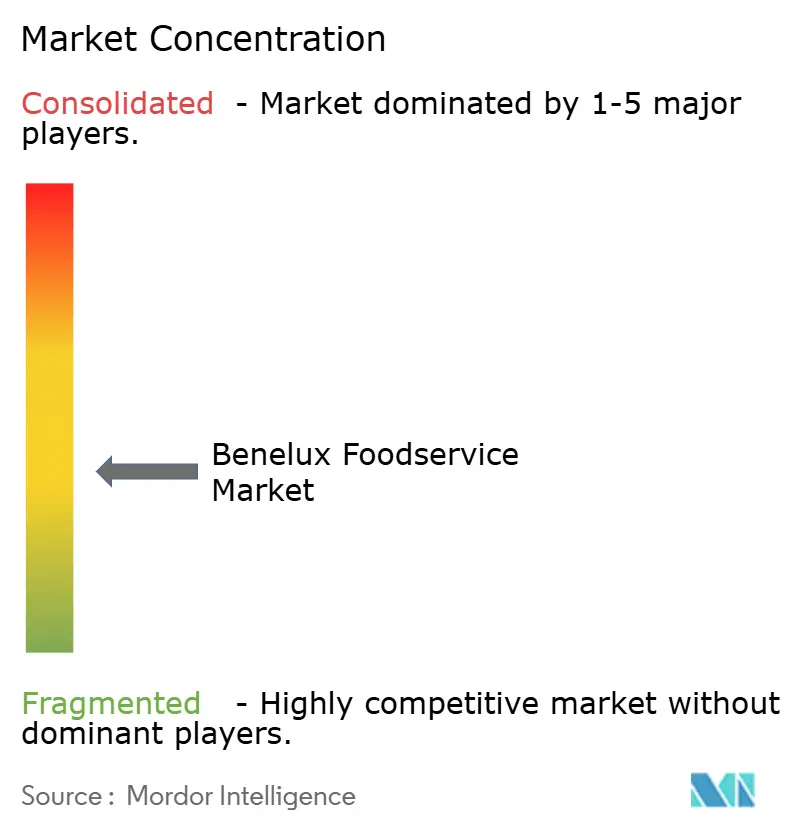
| Market Concentration | Medium |
Major Players *Disclaimer: Major Players sorted in no particular order Image © Mordor Intelligence. Reuse requires attribution under CC BY 4.0. | |
Benelux Foodservice Market Analysis by Mordor Intelligence
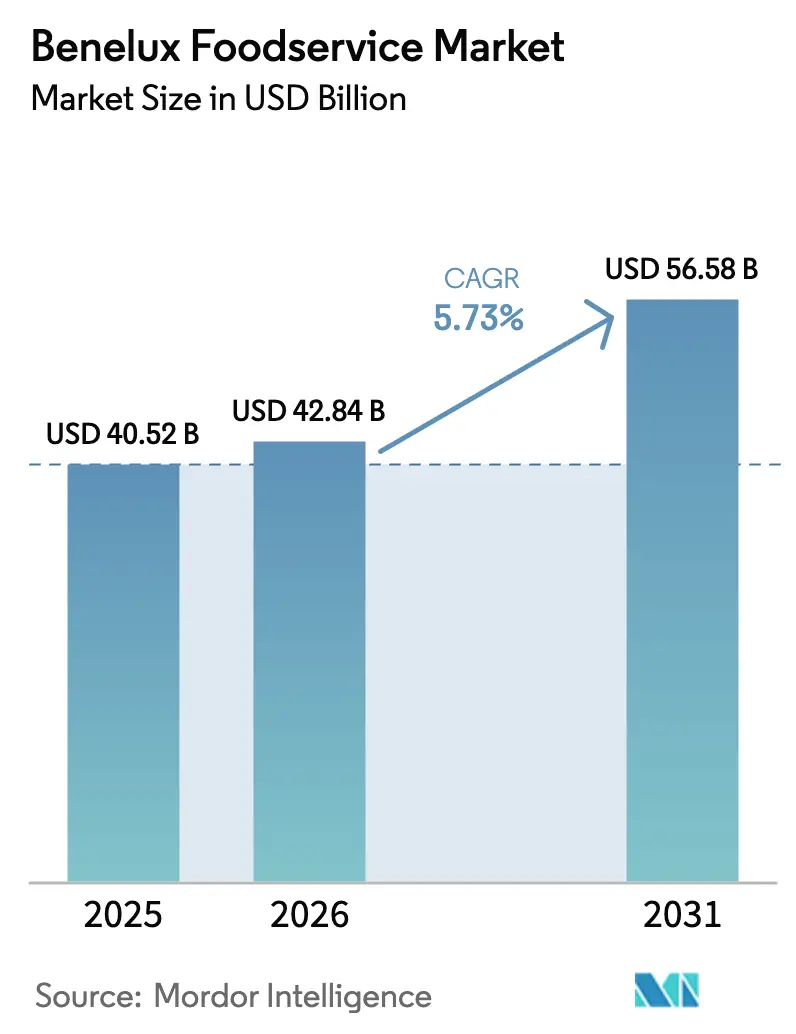
The Benelux foodservice market size was valued at USD 40.52 billion in 2025 and estimated to grow from USD 42.84 billion in 2026 to reach USD 56.58 billion by 2031, at a CAGR of 5.73% during the forecast period (2026-2031). Rising consumer demand for convenience, the swift adoption of omnichannel ordering technology, and a rebound in tourism across major city hubs are driving the current expansion. Consumers increasingly prefer seamless and efficient dining experiences, which has fueled the growth of technology-driven solutions in the foodservice industry. However, wage indexation in Belgium, coupled with labor tightness across the euro area, is pressuring margins. This has led operators to automate both front-of-house and kitchen workflows increasingly, aiming to reduce costs and improve operational efficiency. Quick service restaurants (QSRs) and delivery-only formats are catering to price-sensitive diners by offering affordable and accessible options. In contrast, full-service restaurants (FSRs) are enhancing their value propositions through plant-forward menus, premium sourcing, and a focus on experiential dining, which appeals to consumers seeking unique and high-quality dining experiences. Chains that harness technology are outpacing independent establishments by capitalizing on scale for data-driven pricing, centralized procurement, and a greater penetration of digital sales, enabling them to remain competitive in a challenging market environment.
Key Report Takeaways
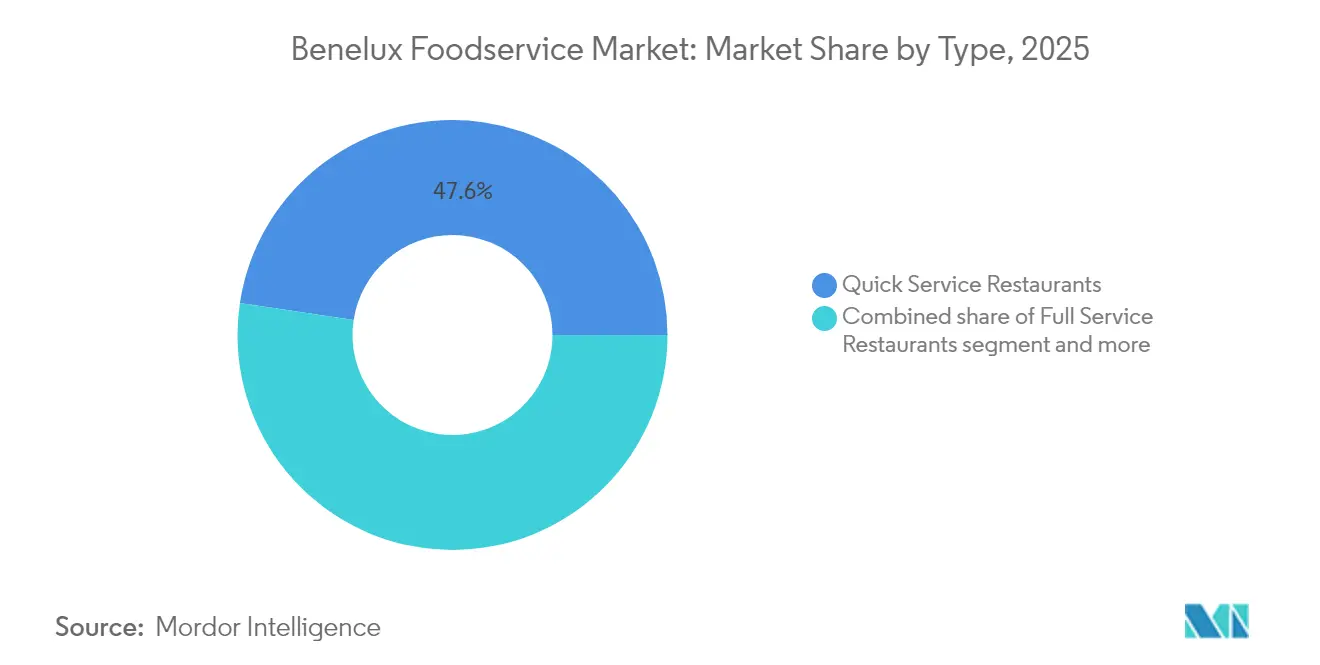
- By source, QSRs captured 47.62% of Benelux foodservice market share in 2025; 100% home-delivery restaurants are projected to expand at an 8.05% CAGR through 2031.
- By structure, independent outlets held 71.85% of the Benelux foodservice market size in 2025, while chained operations record the fastest forecast growth at 6.02% CAGR to 2031.
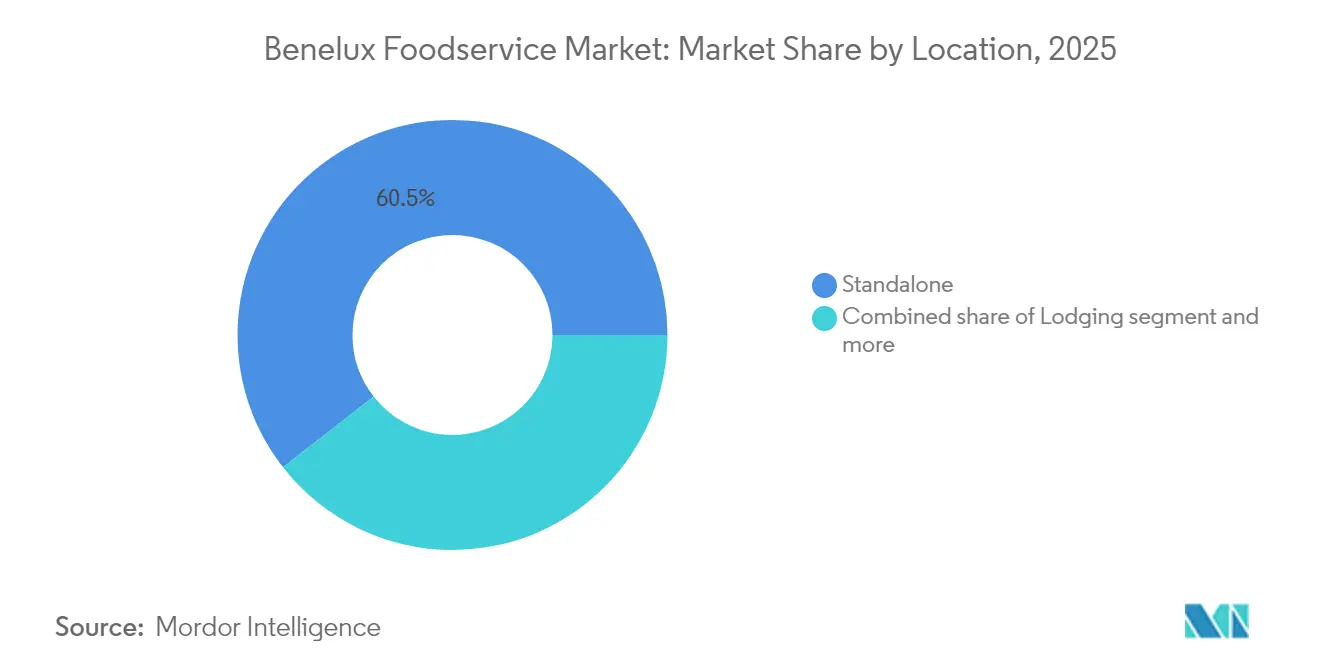
- By location, standalone venues commanded 60.55% share of the Benelux foodservice market size in 2025 and lodging-based foodservice is advancing at a 6.18% CAGR through 2031.
- By country, the Netherlands led with 57.30% Benelux foodservice market share in 2025; Luxembourg is set to grow at a 6.32% CAGR between 2026-2031.
Note: Market size and forecast figures in this report are generated using Mordor Intelligence’s proprietary estimation framework, updated with the latest available data and insights as of 2026.
Benelux Foodservice Market Trends and Insights
Drivers Impact Analysis*
| Driver | (~) % Impact on CAGR Forecast | Geographic Relevance | Impact Timeline |
|---|---|---|---|
| Omnichannel ordering integration | +1.2% | Netherlands, Belgium | Medium term (2-4 years) |
| Delivery-only dark kitchens | +0.8% | Amsterdam, Brussels, Antwerp | Short term (≤2 years) |
| Tourism rebound in top cities | +0.7% | Netherlands lead, Belgium follow | Medium term (2-4 years) |
| Chains adopt plant-forward menus | +0.5% | Region-wide | Long term (≥4 years) |
| Robotic food preparation funding | +0.4% | Dutch tech hubs, Belgian industrial zones | Long term (≥4 years) |
| 5G/IoT kitchen analytics | +0.3% | Urban Netherlands, Brussels corridor | Medium term (2-4 years) |
| Source: Mordor Intelligence | |||
Omnichannel ordering gains traction through mobile and kiosk integration
Operators are increasingly adopting mobile apps and self-service kiosks, aiming for seamless experiences that boost average ticket sizes and reduce labor in order-taking. AmRest highlighted a 57% penetration in digital sales, underscoring the impact of robust 5G roll-outs and broader fiber networks on commerce in Dutch and Belgian outlets. This shift reflects the growing reliance on advanced connectivity to support uninterrupted digital transactions and enhance customer convenience. Cloud-based point-of-sale systems synchronize back-office inventory with real-time demand, minimizing waste during peak times, improving operational efficiency, and enabling better resource allocation. The trend is further fueled by younger diners favoring on-the-go transactions, which cater to their fast-paced lifestyles, and the rise of budget-friendly QR-code solutions. These solutions lower entry barriers for independent operators, allowing them to adopt digital tools, streamline operations, and remain competitive in the evolving market landscape.
Rise of delivery-only "dark kitchens" transforms urban food distribution
Ghost kitchens are transforming affordable industrial and suburban spaces into bustling production hubs, sidestepping the high costs of city-center locations. This model, now gaining momentum in Amsterdam and Brussels, allows operators to experiment with menus and maintain tighter delivery radii, all without the constraints of traditional dine-in setups. By focusing on delivery-only operations, ghost kitchens can optimize resources, reduce overhead costs, and adapt quickly to changing consumer preferences. Additionally, they enable businesses to scale operations more efficiently by leveraging technology and data analytics to streamline processes and enhance customer satisfaction. However, while order density is vital for profitability, municipal regulators are closely monitoring traffic and noise implications, adding a layer of uncertainty to expansion endeavors.
Key benelux cities experience tourism rebound driving foodservice demand
In 2024, Amsterdam anticipates 22.9–25.4 million overnight stays, significantly boosting dining activity in cafés, full-service restaurants (FSRs), and hotel eateries[1]. This growth is driven by increased tourism, business travel, and events, contributing to higher footfall across dining establishments. The rise in overnight stays reflects the city's appeal as a key destination for both leisure and business travelers. Similarly, Brussels and Luxembourg City experience steady demand, supported by consistent business travel associated with EU institutions, which helps stabilize the market even during off-peak leisure seasons. These cities benefit from their strategic importance within the European Union, attracting a steady flow of professionals and delegates. Additionally, an uptick in the average length of stay translates into more meal occasions per visitor, further enhancing the food service industry's performance in these cities. This trend underscores the growing opportunities for food service providers to cater to a diverse and expanding customer base.
Chains embrace plant-forward menus to capture evolving consumer preferences
Regional chains are expanding their plant-based offerings to attract flexitarian diners and boost profits from alternative proteins. In 2023, research in the EU, backed by funding of USD 523 million, is speeding up ingredient innovations that are swiftly making their way into kitchens across Benelux[2]. This funding supports advancements in plant-based ingredients, enabling the development of more diverse and appealing menu options. These innovations not only cater to the growing demand for sustainable and healthier food choices but also provide chains with the ability to differentiate themselves in a competitive market. Additionally, the adoption of alternative proteins allows regional chains to reduce their reliance on traditional meat products, which are often subject to price volatility and supply chain disruptions. Thanks to standardized supply chains, these chains can introduce new SKUs more rapidly than independent establishments, further solidifying their competitive edge by meeting evolving consumer preferences, maintaining operational efficiency, and ensuring consistent quality across their offerings. This agility in product launches also positions regional chains to respond quickly to market trends, enhancing their ability to capture a larger share of the growing plant-based food market.
Restraints Impact Analysis*
| Restraint | (~) % Impact on CAGR Forecast | Geographic Relevance | Impact Timeline |
|---|---|---|---|
| Wage costs outpace menu prices | -1.8% | Belgium high, Netherlands moderate | Short term (≤2 years) |
| Restaurant bankruptcies rising | -1.2% | Netherlands primary, Belgium spillover | Short term (≤2 years) |
| Municipal zoning limits kiosks | -0.6% | Amsterdam, Brussels, Antwerp | Medium term (2-4 years) |
| Carbon-footprint disclosure costs | -0.4% | EU-wide, Benelux early adoption | Long term (≥4 years) |
| Source: Mordor Intelligence | |||
Wage costs rise faster than menu prices creating margin compression
In January 2025, wages in Belgium's Horeca sector rose by 3.571%, elevating hourly labor costs to EUR 48.2 as per Eurostat. This surge has been eroding restaurant margins more swiftly than price hikes can offset, posing significant challenges for operators in maintaining profitability. In the Euro area, growth in unit labor costs within service sectors is outpacing productivity gains, further straining businesses' ability to absorb these cost increases without passing them on to consumers. For context, the European Labour Authority highlighted that in 2023, the Horeca sector in the EU employed over 10.4 million workers, representing 5.1% of the total EU workforce[3]. The sector's notable reliance on mobile workers, who often move across borders for employment opportunities, adds another layer of complexity to cost management. This mobility increases administrative burdens and compliance challenges, particularly in managing varying labor regulations and wage structures across different countries.
Restaurant bankruptcies predicted to spike in 2025 due to operational pressures
In 2025, ABN AMRO forecasts that 450 Dutch restaurants will shutter their doors, a figure that more than doubles the 2023 count. This trend underscores the mounting liquidity challenges faced by smaller, independent eateries, grappling with rising energy costs, rent, and payroll commitments. The financial strain on these businesses is expected to intensify as operating expenses continue to rise, leaving many unable to sustain their operations. Additionally, the competitive pressure from larger, well-capitalized chains further exacerbates the difficulties faced by smaller players. Meanwhile, these larger chains are strategically positioned to capitalize on the market disruption, targeting distressed assets for acquisition at reduced multiples. This consolidation trend is anticipated to significantly alter the structure of the Dutch restaurant market, favoring financially robust players while potentially reducing the diversity of independent dining options available to consumers.
*Our forecasts treat driver/restraint impacts as directional, not additive. The impact forecasts reflect baseline growth, mix effects, and variable interactions.
Segment Analysis
By Source: QSR leadership and delivery-only ascent
In 2025, Quick Service Restaurants (QSRs) dominate the Benelux foodservice market, accounting for 47.62% of total sector sales. Their stronghold is largely due to the adoption of digital ordering platforms, standardized cooking methods, and compact operations. These strategies not only allow for lean staffing but also facilitate quicker table turnover. Such efficiencies are crucial in a region characterized by high labor costs and swift consumer turnover, consistently enhancing both throughput and profitability. By leveraging technology and standardizing menus, QSRs adeptly cater to the rising consumer demand for convenience and speed. Post-pandemic shifts in dining habits have further bolstered QSR popularity, with consumers now prioritizing swift and dependable food experiences. Consequently, as the industry anticipates a CAGR of 5.73% through 2031, QSRs are poised to see their market size swell in tandem, solidifying their foundational role in Benelux's foodservice landscape. Their growth trajectory is bolstered by competitive pricing, an expansive geographic footprint, and a robust delivery network.
Meanwhile, delivery-only restaurants are emerging as the fastest-growing segment, boasting a robust CAGR of 8.05%. They capitalize on the post-pandemic trend of at-home dining. By sidestepping the costs associated with dine-in services, these establishments can target new customer bases and adopt more flexible, scalable business models. Their shift towards virtual kitchens and concise menus allows them to swiftly adapt to changing food trends and local demand surges. However, this rapid expansion poses challenges for traditional full-service operators, as delivery-only restaurants efficiently cater to both urban and suburban diners, often outpacing physical locations. While cafes and bars are witnessing a resurgence in foot traffic thanks to a renewed interest in socializing, they're grappling with payroll challenges due to longer hours and rising wages. Full-service establishments that focus on enhancing ambiance and sourcing premium ingredients are successfully retaining a dedicated urban clientele. Yet, many still face the challenge of squeezed profit margins. This dynamic landscape not only highlights the resilience of delivery-only models but also underscores the pressing need for traditional establishments to evolve both operationally and strategically.

By Structure: Independent resilience versus chain efficiency
In the Benelux foodservice market, independent venues assert their dominance, holding a significant 71.85% market share. This stronghold underscores the region's commitment to its local culinary traditions and the rich tapestry of its entrepreneurial spirit. These independent operators curate dining experiences that resonate with local palates, fostering deep-rooted community ties. Their unique offerings, often marked by innovative menus and distinct ambiance, set them apart from the more standardized chain establishments. Even amidst a wave of industry consolidation, these independents stand firm, championing cultural authenticity and culinary innovation in both urban hubs and rural locales. Their adaptability to shifting consumer trends and emphasis on hyper-local sourcing bolster their resilience. Yet, challenges loom large: surging operational costs and complex regulatory landscapes prompt some independents to rethink their strategies or explore partnerships.
Chains are emerging as the fastest-growing segment in the Benelux foodservice market, projected to expand at a robust CAGR of 6.02%. They harness the power of operational scale and cutting-edge technology to fuel their growth. By centralizing purchasing, chain operators not only enhance cost efficiency but also ensure consistent supply. Their unified brand identities play a pivotal role in building consumer trust and recognition. Moreover, chains are increasingly turning to data analytics and digital loyalty initiatives, not just to elevate customer experiences but also to encourage repeat patronage. Their collaboration with third-party delivery platforms further amplifies their reach, maximizing table-fill rates. The chain expansion is also buoyed by merger and acquisition activities, exemplified by the 50 food and beverage deals in the Netherlands in 2023. These deals facilitate the integration of independent venues, allowing chains to expand their geographic footprint without the lengthy process of establishing new outlets. As the landscape shifts, chains are poised to gain an edge, navigating cost pressures and compliance challenges with greater efficiency, underscoring the delicate balance between tradition and modernity in the Benelux foodservice arena.
By Location: Standalone dominance and lodging-based upswing
Standalone restaurants command a dominant 60.55% share of the Benelux foodservice market. Their success is largely attributed to prime main-street locations and the personal touch of owner-operators. These establishments, deeply rooted in their communities, enjoy a loyal customer base, bolstered by traditional dining habits and an emphasis on quality, localized experiences. Their legacy status and established presence in both urban and suburban locales ensure a stable revenue stream. While the broader industry faces challenges, standalone restaurants showcase resilience, thanks to their adaptability and direct consumer engagement. The owner-operator model further enhances this resilience, enabling swift decision-making and tailored offerings in a competitive landscape. This dominance underscores the enduring significance of independently run, brick-and-mortar dining in the Benelux region.
Lodging-integrated foodservice is the fastest-growing segment, boasting an anticipated CAGR of 6.18%. This growth is driven by surging hotel occupancy rates, as inbound travel rebounds to pre-pandemic levels. Cities like Amsterdam, which witnessed 22.9 and 25.4 million overnight stays in 2024, present lucrative opportunities for hotel restaurants and room-service operations. The uptick in both tourism and business travel amplifies the demand for high-quality, convenient dining within hotels. Meanwhile, while retail-attached foodservice grapples with dwindling foot traffic in traditional malls, a resurgence in travel hubs like airports and train stations is breathing new life into the sector. Food halls, with their diverse vendor layouts, are gaining popularity, allowing independent vendors to share operational costs while attracting consumers with their variety and convenience. In summary, lodging-integrated foodservice stands are poised to leverage broader mobility trends and shifting consumer preferences in the Benelux market.
Geography Analysis
In 2025, the Netherlands commands a dominant 57.30% share of the Benelux foodservice market, buoyed by its advanced digital infrastructure, thriving tourism sector, and a business-friendly environment. The country's strong digital infrastructure facilitates seamless online food delivery and reservation systems, enhancing customer convenience and operational efficiency for businesses. Additionally, the robust tourism industry, supported by iconic attractions and cultural events, drives significant foot traffic to foodservice establishments. As visitor spending surges and domestic demand rises, the Netherlands' foodservice market is poised to align with the region's projected 5.73% CAGR. However, the forecasted 450 restaurant bankruptcies in the Netherlands for 2025 highlight the challenges faced by undercapitalized independent establishments, which often struggle with financial resilience and operational scalability.
In 2024, Belgium experiences significant food inflation, which is impacting discretionary spending. As food prices rise, consumers are adapting by opting for more budget-friendly dining options or reducing the frequency of dining out. A 3.571% wage hike in January 2025, driven by automatic wage indexation, has further strained the Horeca sector by increasing operational costs for businesses already navigating tight profit margins. While inflation is expected to moderate to 2.8% in 2025, offering a glimmer of hope for consumer spending, Brussels enjoys a buffer from institutional travel tied to EU agencies, somewhat mitigating the inflationary pressures. This institutional travel not only sustains demand for foodservice establishments but also supports premium dining experiences catering to business travelers and diplomats.
Luxembourg, riding on its high disposable income and a compact urban layout that favors efficient delivery, is set to expand at the fastest rate of 6.32% CAGR through 2031. The country's affluent population drives demand for premium dining experiences, while its small geographic size enables foodservice operators to optimize delivery networks and reduce logistical challenges. This growth is bolstered by a steady demand in corporate dining, benefiting premium and full-service restaurant categories. Additionally, Luxembourg's strategic focus on fostering a high-quality dining culture further enhances its appeal as a foodservice market, attracting both local and international players.
Regulatory Landscape
Foodservice operators across Benelux work within a dense EU and national food-safety framework covering hygiene, traceability, and temperature control. Belgiums Federal Agency for the Safety of the Food Chain (FASFC) is referenced as an active enforcement body for traceability and temperature logging practices in hot service lines (2026). In parallel, menu and product information requirements are being shaped by EU sustainability and nutrition initiatives, including the EU Farm to Fork direction. This is pushing front-of-pack labeling schemes, such as Nutri-Score, and reformulation targets, which in turn increases documentation and supplier-data needs for both chains and independents.
Carbon-footprint disclosure and product-level emissions data are also raising the compliance and data-management workload. Operators and their suppliers are being pulled toward more standardized carbon accounting and reporting practices. For public companies active in the region, governance and disclosure obligations affect how quickly initiatives (including omnichannel investments, sourcing changes, and consolidation) are communicated to the market. Listed operators such as AmRest are therefore subject to EU financial reporting and disclosure rules.
Value Chain Analysis
The Benelux foodservice value chain starts with agricultural and ingredient suppliers and runs through processors and branded manufacturers, then into foodservice distributors, wholesalers, and last-mile logistics providers serving restaurants, travel and lodging locations, and delivery-only kitchens. Large chains and integrated retailers with foodservice footprints use centralized procurement, while independents lean more on local wholesalers and cash-and-carry formats. Ahold Delhaizes joint sourcing approach in Europe illustrates how scale supports affordability and helps standardize specifications across brands.
On logistics and compliance, investment in distribution and fleet operations supports higher order frequency and tighter delivery windows needed for omnichannel demand, including e-commerce-enabled meal solutions and retail-adjacent foodservice. In Belgium, Delhaize is investing EUR 8 million in a transport and maintenance hub in Zellik to centralize trailer fleet management and technical inspection (July 2026), while partners such as Van Moer Logistics support distribution with specialized trailer fleets. Upstream, suppliers are increasingly being asked to provide sustainability data and participate in decarbonization actions, including Ahold Delhaizes product carbon footprinting work with HowGood and alignment efforts with WBCSD PACT. Programs involving partner farmers and suppliers such as Arvesta and Franson are also referenced to reduce methane emissions from beef supply (June 2026).
Competitive Landscape
In a landscape marked by moderate fragmentation, technology-driven multinationals and agile independents engage in a balanced competition for market dominance. AmRest, boasting H1 2024 sales of EUR 1,231.5 million and a significant 57% digital penetration, highlights the edge chains possess in executing omnichannel strategies, seamlessly blending online and offline channels to elevate the customer experience. Meanwhile, Yum! Brands has seen a 16% uptick in its global digital system sales in 2024, highlighting the advantages of its integrated loyalty ecosystem, which drives customer retention and repeat purchases through personalized rewards and offers.
Independent operators maintain their market share through hyper-local sourcing, chef-driven concepts, and unique experiential settings that cater to specific community preferences and create differentiated dining experiences. While venture-funded ghost-kitchen specialists are on the rise, they face the challenge of achieving order density to transition from mere revenue growth to actual profitability, as high operational costs and competitive pricing pressure their margins.
Investments in the supply chain are on the rise: bpostgroup's acquisition of Staci aims at integrating B2B and B2C logistics, enhancing last-mile fulfillment by improving delivery speed and efficiency. in June 2024, Vion Food Group's decision to channel resources towards its Benelux operations indicates a bullish stance on regional demand, driven by strong consumer preferences and stable economic conditions in the area. Furthermore, the industry is witnessing a shift in competitive standards, with emphasis on digital proficiency, cost analytics, and transparency in ESG (Environmental, Social, and Governance) practices, which are increasingly becoming critical for long-term sustainability and stakeholder trust.
Benelux Foodservice Industry Leaders
-
Yum Brands Inc
-
Mcdonald’s Corporation
-
Starbucks Corporation
-
AmRest Holdings SE
-
Ahold Delhaize
- *Disclaimer: Major Players sorted in no particular order
Market Opportunities and Future Outlook
Margin pressure and more selective consumer behavior in Belgium (with stabilized or declining visits and higher critical sentiment noted in 2026) are creating room for operators that can strengthen value perception while protecting convenience. Scale procurement and cross-brand sourcing are one lever. Ahold Delhaizes joint sourcing initiative in Europe is framed around affordability, health, and sustainability, and it supports more stable input costs, simplified assortments, and faster rollout of reformulated or plant-forward SKUs across chain systems.
A second opportunity is in measurable sustainability and data-led operations, where compliance and customer requirements are converging on product-level transparency. Ahold Delhaizes roll-out of product carbon footprinting capabilities (including collaboration with HowGood and data-standardization bodies such as WBCSD PACT) signals how suppliers and foodservice operators can differentiate using verified footprint data and supplier engagement, alongside menu engineering that connects cost, waste reduction, and emissions. Omnichannel execution also remains a commercial lever for chains, reflected in operator emphasis on digital customer experience and delivery capabilities (for example, AmRests stated strategic focus on omnichannel). At the same time, investments in logistics capacity and maintenance infrastructure in Belgium reinforce the need for resilient fulfillment to handle higher digital order volumes and tighter service-level expectations.
Recent Industry Developments
- February 2026: Delhaize Belgium completed the acquisition of Delfood NV, with Belgian Competition Authority approval including divestitures. The deal broadens the Benelux convenience and omnichannel network, enabling more integrated online and in-store fulfillment. It strengthens Delhaize's position in the Benelux market by boosting e commerce capacity and regional reach.
- November 2025: KFC opened its first Luxembourg outlet at Luxembourg-Gare with Drive-Thru. The launch expands Luxembourg entry and adds a drive-thru capability to the footprint, expanding the omnichannel and delivery footprint in the Benelux region.
- May 2025: Delhaize Belgium (Ahold Delhaize) opened a new distribution center in Forest with a 53 million euros investment, doubling e commerce capacity. The expansion increases omnichannel capacity in the Benelux region and improves e commerce fulfillment and last mile efficiency to meet rising online demand.
Research Methodology Framework and Report Scope
Market Definition and Coverage
For this methodology, the Benelux foodservice market covers revenue generated from food and beverage sold for immediate consumption by commercial and institutional operators across Belgium, the Netherlands, and Luxembourg.
Scope exclusions: Retail grocery sales for at-home consumption and pure packaged food manufacturing revenue are excluded from this market sizing.
Segmentation Overview
- By Type
- Full-Service Restaurants (FSRs)
- Cafés and Bars
- Quick Service Restaurants (QSRs)
- 100 % Home-Delivery Restaurants
- By Outlets
- Chained Outlets
- Independent Outlets
- By Location
- Leisure
- Lodging
- Retail
- Standalone
- Travel
- By Geography
- Belgium
- Netherlands
- Luxembourg
Data Sources, Market Sizing, and Validation
Desk Research
Desk work sets the base structure of the model, especially for the size of the eating-out economy and how it moved after inflation and travel recovery. We mainly use official and public sources such as Eurostat (national accounts and household consumption), national statistics offices in Belgium, the Netherlands, and Luxembourg, and business demography series that indicate outlet counts and closures.
To sharpen foodservice-specific assumptions, we also review central bank releases, tourism boards and accommodation statistics, and open publications from food and hospitality trade bodies in the region (including channel definitions and demand commentary). Company annual reports, investor presentations, and reputable press are used to sanity-check expansion trends, pricing moves, and format shifts like delivery and takeout. Where needed, we reference paid subscriptions for company financials and intelligence, news and financials, and selective import and export shipment-level views to understand ingredient cost pressure. These sources are not exhaustive, and we relied on other public and paid references for data collection, cross-checking, and research clarification.
Primary Interviews and Surveys
Our interviews and surveys with operators, channel specialists, functional leaders, and managers across Belgium, the Netherlands, and Luxembourg test outlet economics, delivery mix, pricing, and chain-independence assumptions. Responses fill country gaps, check secondary turnover trends, and help triangulate the final Benelux model when official data use different classifications.
Distribution of primary research fieldwork respondents
| Company type | Respondent position |
|---|---|
| Top tier: 30% | CXOs: 15% |
| Mid tier: 50% | Functional/Unit leaders: 30% |
| Smaller Players: 20% | Managers: 55% |
Market-Sizing & Forecasting
Sizing starts with a top-down build where national consumption and tourism demand indicators are used to reconstruct the addressable eating-out spend for Belgium, the Netherlands, and Luxembourg, and then mapped to foodservice channels. After the first total is formed, we corroborate it with selective bottom-up checks, such as sampled operator revenue bands, outlet count by format, and average check assumptions, to keep the totals realistic.
Key inputs in the model include outlet density and openings, average ticket size and menu price progression, transaction and footfall direction (where publicly indicated), tourism nights and inbound flows, and cost-side signals that often move pricing (energy and key food input trends). Forecasting is built using scenario-based projections supported by a simple multivariate regression, where drivers like real income direction, tourism volumes, and price inflation are varied and then aligned with what primary experts expect by channel. If bottom-up checks are thin for a smaller format or geography, the gap is handled through proxy ratios and then reviewed again during validation.
Data Validation & Update Cycle
Model outputs are triangulated against independent signals such as macro consumption totals, tourism recovery pace, and observed pricing direction from trade commentary, and then the largest variances are flagged for review. Anomaly checks are completed at country and Benelux total level, followed by an internal multi-step analyst review so assumptions, units, and currency conversions stay consistent.
If a late-stage variance appears, we re-contact relevant respondents and re-run the sensitivity around the driver that caused the change. Reports are refreshed annually, and interim updates are made when material events occur, such as tax changes, sharp inflation moves, or major channel disruptions. Right before delivery, the analyst performs a final pass so clients receive the latest updated view.
Mordor Intelligence's Benelux Foodservice Market Size Versus Other Published Estimates
Published market values for Benelux foodservice can vary because the scope line is drawn differently, and because price and traffic assumptions do not move the same way across models. Timing also matters, since some studies lock a base year early, while others roll forward using inflation-heavy adjustments.
By tracking outlet-level revenue mapping and refreshing currency conversion timing, Mordor Intelligence keeps the estimate tied to foodservice-only sales in Belgium, the Netherlands, and Luxembourg, instead of mixing in adjacent retail food spend. In addition, we treat delivery and takeout as part of foodservice where the operator is a foodservice outlet, which can be handled differently in narrower channel definitions.
Benchmark comparison
| Source | Market Size | Gaps in Research Methodology |
|---|---|---|
| Mordor Intelligence | USD 40.52 B (2025) | |
| Regional Consultancy A | USD 35.36 B (2025) | Uses a narrower capture of foodservice revenue, which often undercounts institutional and non-traditional formats, and it can apply conservative price uplift where inflation pass-through is uneven by outlet type. |
| Industry Publisher B | USD 46.67 B (2034) | Extends the forecast horizon and can embed a smoother growth curve, which may assume steadier tourism recovery and a higher long-run average check progression than what short-cycle operator guidance supports. |
The spread across sources mainly comes from what is counted as foodservice revenue, how delivery and institutional sales are treated, and how price growth is carried forward year to year. Our approach aims to keep each assumption traceable to a clear demand signal, and the totals are rechecked using practical channel and ticket-size logic so the numbers can be repeated and explained.
Key Questions Answered in the Report
How large is the Benelux foodservice market in 2026?
The Benelux foodservice market size reaches USD 42.84 billion in 2026, with a forecast to climb to USD 56.58 billion by 2031.
Which segment grows fastest through 2031?
100% home-delivery restaurants register the strongest pace, advancing at an 8.05% CAGR thanks to convenience-driven demand and efficient delivery operations.
Which country leads by revenue?
The Netherlands holds 57.30% of regional revenue in 2025, buoyed by tourism recovery and advanced digital infrastructure that lifts omnichannel sales.
What is the main cost pressure for operators?
Wage outlays, particularly in Belgium where Horeca wages rose 3.571% in January 2025, are rising faster than menu prices and compressing margins.