
Market Overview
| Study Period | 2020 - 2031 |
|---|---|
| Base Year Market Size (2025) | USD 8.40 Billion |
| Market Size (2026) | USD 8.89 Billion |
| Market Size (2031) | USD 11.78 Billion |
| Growth Rate (2026 - 2031) | 5.80 % |
| Fastest Growing Market | Asia Pacific |
| Largest Market | North America |
Major Players *Disclaimer: Major Players sorted in no particular order Image © Mordor Intelligence. Reuse requires attribution under CC BY 4.0. | |
Belgium Pharmaceutical Market Analysis by Mordor Intelligence
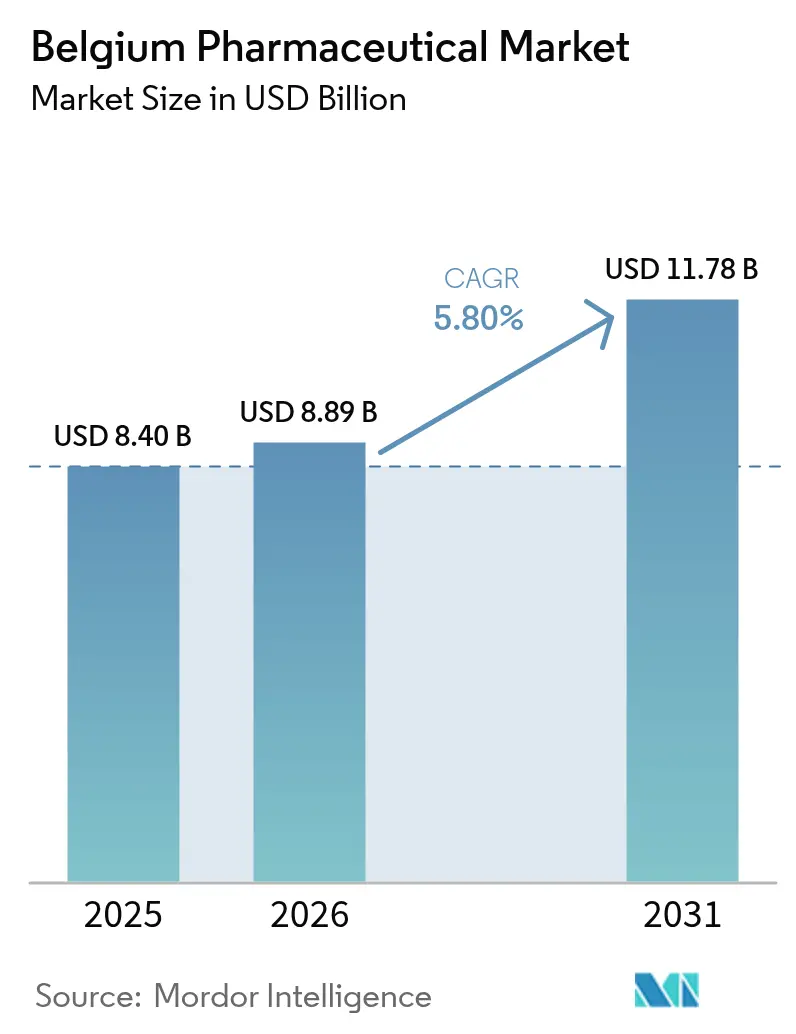
The Belgium Pharmaceutical Market size is expected to grow from USD 8.40 billion in 2025 to USD 8.89 billion in 2026 and is forecast to reach USD 11.78 billion by 2031 at 5.80% CAGR over 2026-2031.
Belgium’s export-led orientation, its EUR 79 billion shipment value in 2024, and R&D outlays equal to 19.3% of total EU pharmaceutical research collectively anchor a steady demand outlook. High per-capita health expenditure, a 100% national eHealth score, and policy support for fast-track reimbursement programs continue to lower barriers to access for breakthrough therapies. Mandatory post-exclusivity price cuts curb unit values but encourage large volumes by ensuring affordability, while manufacturer rebates under Managed Entry Agreements shift part of the budget burden away from public payers. Multinational subsidiaries dominate specialty segments yet growing online pharmacy penetration and a visible pipeline of biologics and advanced therapies signal widening opportunities for newer entrants.
Key Report Takeaways
- By therapeutic class, the cardiovascular system segment held 14.18% of the Belgium pharmaceutical market share in 2025, while dermatologicals are projected to expand at a 7.54% CAGR through 2031.
- By drug type, prescription medicines accounted for 86.85% of the Belgium pharmaceutical market size in 2025; the over-the-counter category records the fastest 7.21% CAGR to 2031.
- By molecule type, small molecules represented 67.43% of the Belgium pharmaceutical market size in 2025, whereas biologics post the highest 6.78% CAGR between 2026-2031.
- By distribution channel, hospital pharmacies captured 45.73% of 2025 revenue, and online pharmacies are set to rise at a 7.65% CAGR through 2031.
Note: Market size and forecast figures in this report are generated using Mordor Intelligence’s proprietary estimation framework, updated with the latest available data and insights as of 2026.
Belgium Pharmaceutical Market Trends and Insights
Drivers Impact Analysis*
| Driver | ( ~ ) % Impact on CAGR Forecast | Geographic Relevance | Impact Timeline |
|---|---|---|---|
| Rising Health Expenditure Per Capita | +1.2% | National, concentrated in Brussels-Capital, Flemish and Walloon Brabant | Medium term (2-4 years) |
| High Burden of Chronic Diseases | +1.5% | National, aging clusters across Flanders and Wallonia | Long term (≥ 4 years) |
| Robust Biopharma Export Infrastructure | +1.0% | National, export hubs in Antwerp and Brussels Airport pharma corridor | Long term (≥ 4 years) |
| Government R&D Tax Incentives | +0.8% | National, strongest pull in biotech clusters around Leuven and Ghent | Medium term (2-4 years) |
| Digital Prescription and E-Pharmacy Adoption | +0.9% | National, early uptake in urban centers | Short term (≤ 2 years) |
| EU Critical Medicines Act Supply Resilience Programs | +0.7% | National, aligned with EU-wide rollout | Medium term (2-4 years) |
| Source: Mordor Intelligence | |||
Rising Health Expenditure Per Capita
Belgium’s per-capita health spend reached USD 6,022, outperforming the EU-14 average and freeing budget space for high-cost biologics. Public pharmaceutical outlays are forecast to rise from 8% of GDP in 2022 to 8.9% by 2027, translating into a 36.6% nominal increase. The 2026 federal budget earmarked EUR 25 million for the Early and Equitable Fast Access program, cutting reimbursement timelines for oncology and rare-disease drugs. Industry payrolls of 44,738 direct staff plus 140,835 across the value chain amplify tax receipts and voter interest in sector stability. Retail drug spending per capita sits 6% below the EU mean, indicating untapped volume potential as the population ages and discretionary income grows.
High Burden of Chronic Diseases
Cancer and circulatory disorders still account for roughly half of national mortality, coupled with an 82.6-year life expectancy. Mature cardiovascular categories face generic erosion, yet the obesity-linked surge in GLP-1 demand offers a new growth arc. Dermatological biologics for psoriasis and atopic dermatitis are outpacing systemic corticosteroids, lifting the segment’s growth curve for 2026-2031. Belgium’s 16% obesity prevalence accelerates uptake of oral GLP-1 candidates such as orforglipron once Lilly’s EUR 2.6 billion Netherlands plant goes live in 2027. Persistent supply constraints through 2025 create latent demand that is unlocked by capacity additions.
Digital Prescription and E-Pharmacy Adoption
A 100% eHealth indicator score and 91.8% e-prescription penetration lay the rails for seamless online fulfilment[1]. Belgium’s digital health turnover hit EUR 754.53 million in 2025 and should reach EUR 991.91 million by 2029 at a 7.09% CAGR. The upcoming EU Health Data Space and Digital Identity Wallet will support cross-border e-prescription redemption by 2027, pressuring domestic brick-and-mortar pharmacies to integrate home-delivery models. Current restrictions on the online sale of prescription medicines, shared with 18 other EU states, are expected to be softened under the Pharmaceutical Strategy for Europe. Over-the-counter lines, already web-enabled, benefit first from consumer preference shifts born during the pandemic.
EU Critical Medicines Act Supply Resilience Programs
Belgium registered 36 critical-impact shortage alerts in 2022—56% linked to immunoglobulins—highlighting dependence on a narrow manufacturing base. The EU Critical Medicines Act now compels diversified sourcing, strategic stockpiles and faster parallel-import clearances. Although Belgium exported EUR 79 billion worth of drugs in 2024, domestic inventories remain strained whenever global API flows falter. A January 2025 coalition pact placed shortages and biosimilar incentives high on the legislative agenda, while the EMA’s European Shortages Monitoring Platform allows earlier intervention when supply signals flash red.
Restraints Impact Analysis*
| Restraint | (~) % Impact on CAGR Forecast | Geographic Relevance | Impact Timeline |
|---|---|---|---|
| Mandatory Post-Exclusivity Price Cuts | -0.8% | National, all reimbursed products | Short term (≤ 2 years) |
| Lengthy Reimbursement Timelines | -0.7% | National, affects innovative therapies | Medium term (2-4 years) |
| Hospital Financing Model Disincentivizing Biosimilar Uptake | -0.6% | National, public hospital networks | Medium term (2-4 years) |
| Increasing Sustainability Compliance Costs | -0.4% | National, energy-intensive plants in Flanders | Long term (≥ 4 years) |
| Source: Mordor Intelligence | |||
Mandatory Post-Exclusivity Price Cuts
Belgium slashes originator prices by up to 38% once generic or biosimilar competition appears, compressing margin runways and discouraging smaller line extensions[2]. The 2026 budget further trims hospital invoice reimbursement to 78% and imposes EUR 1-2 patient co-pays, squeezing value-chain profits. Managed Entry Agreements, worth EUR 1.6 billion in 2019 rebates, cap upside whenever sales overshoot negotiated ceilings. Protracted reimbursement reviews—578 days on an EU average—plus reference pricing lower differentiation payoffs for formulation tweaks or adherence programs.
Hospital Financing Model Disincentivizing Biosimilar Uptake
Hospitals earn a fixed margin on invoiced drug costs, prompting them to favor costlier brands over cheaper biosimilars because revenue scales with unit price. The 2026 reimbursement cut compounds pressure yet leaves the perverse incentive intact. Despite a 2023 Royal Decree mandating competitive tenders, biosimilar penetration trails EU norms, confirming that tendering alone cannot offset structural financing biases. With hospital pharmacies holding 45.73% share of national purchases, any meaningful shift toward biosimilars hinges on financing reform. Coalition documents list biosimilar incentives as a priority, but operative details remain sketchy.
*Our forecasts treat driver/restraint impacts as directional, not additive. The impact forecasts reflect baseline growth, mix effects, and variable interactions.
Segment Analysis
By ATC/Therapeutic Class: Dermatologicals Lead Growth Amid Cardiovascular Maturity
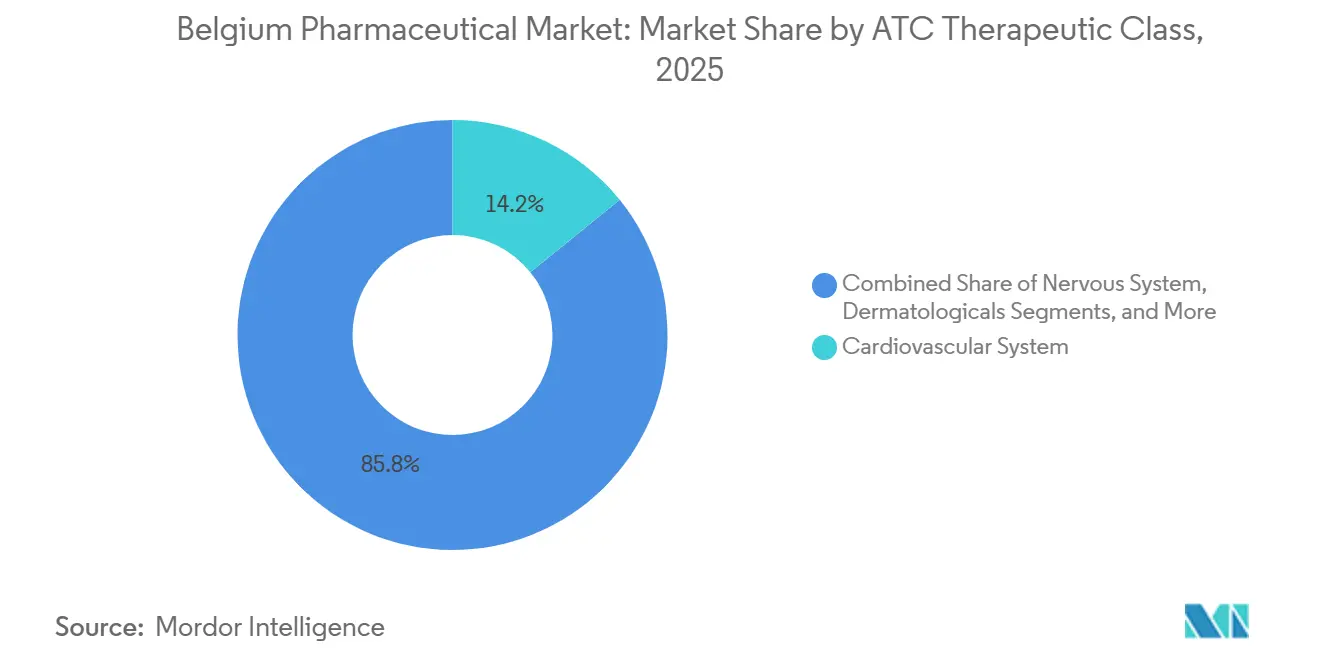
Cardiovascular agents delivered 14.18% of the Belgium pharmaceutical market share in 2025 but confront generic-driven price ceilings as statins and ACE inhibitors mature. Dermatological products are projected to grow at a 7.54% CAGR through 2031, driven by monoclonal antibodies that offer superior remission rates in psoriasis and atopic dermatitis. Nervous-system drugs sustain volume via Belgium’s early adoption of disease-modifying therapies for multiple sclerosis and Alzheimer’s. Respiratory biologics that suppress IL-5 or IL-4/IL-13 pathways reduce exacerbations, while blood-forming agents face commoditization from direct oral anticoagulants. Insurance-backed fast-access funds tilt market mix in favor of oncology breakthroughs entering the residual “other” bucket.
Aging demographics and higher disposable incomes expand demand for osteoporosis, benign prostatic hyperplasia, and rheumatoid arthritis interventions. Patent filings totaling 417 in 2024 signal continued therapeutic diversification. GLP-1 therapies address metabolic conditions linked to the nation’s 16% obesity rate, with capacity expansion in neighboring the Netherlands set to clear supply bottlenecks beyond 2027. Belgium's pharmaceutical industry invests more in R&D toward immunology and rare diseases, fields with fewer entrenched generics.

By Drug Type: Prescription Dominance Persists as OTC Self-Care Accelerates
Prescription lines represented 86.85% of total 2025 value, reinforcing Belgium pharmaceutical market size dominance in specialty areas such as oncology and neurology. Branded molecules endure post-exclusivity reductions yet command volume in protected niches, while generics leverage automatic substitution rules to serve primary-care staples. Over-the-counter remedies expand at 7.21% CAGR as consumers retain self-care habits formed during pandemic mobility curbs.
Digital prescription ubiquity gives online pharmacies a friction-less path to scale, although regulatory gates still block remote dispensing of Rx products. European harmonization efforts suggest broader e-dispensing rights within this decade. Managed Entry rebates ensure public budgets stay on-course even when specialty volumes grow, permitting a balanced mix of high-value prescriptions and value-priced generics.
By Molecule Type: Biologics Surge as Small Molecules Retain Volume Base
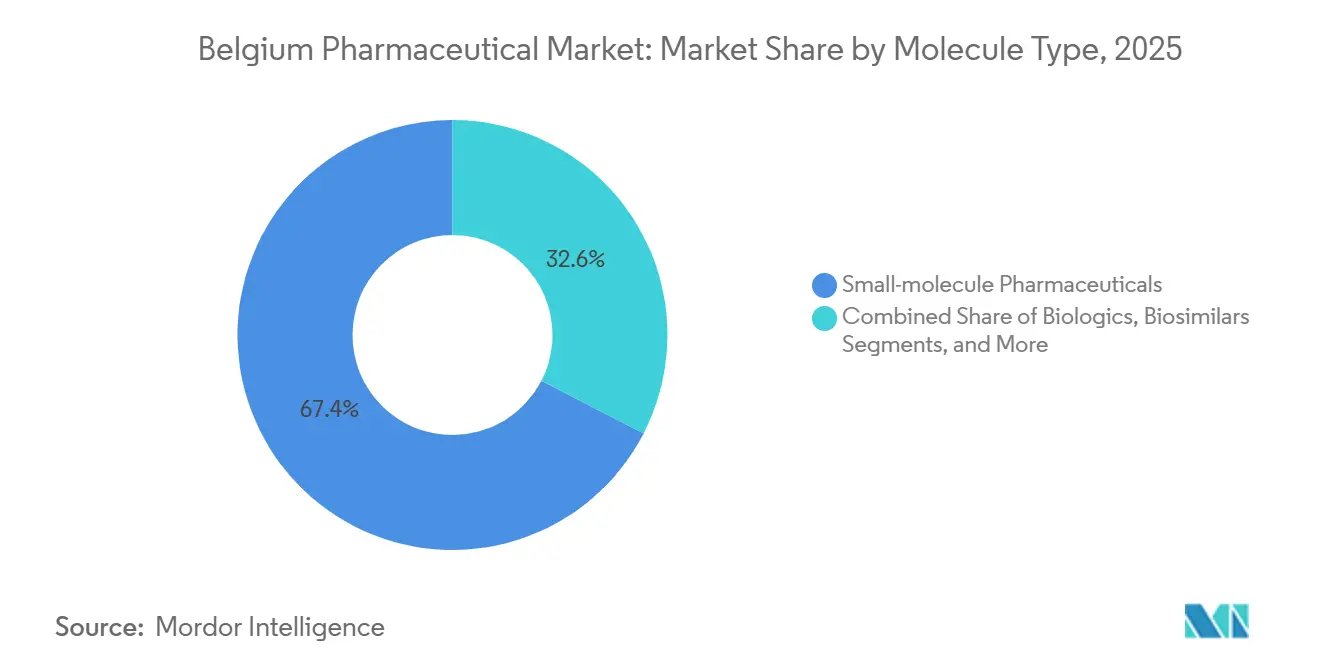
Small molecules still anchor two-thirds of Belgium pharmaceutical market size thanks to oral convenience and optimized production footprints. Biologics, however, secure a 6.78% CAGR by answering unmet needs in oncology, immunology and ophthalmology. Biosimilar rollout remains lukewarm because hospital mark-up formulas reward originator usage, yet policy drafts call for financing realignment.
Advanced therapy medicinal products gain traction under fast-track reimbursement but reveal a manufacturing gap at home. GSK’s EUR 150 million vaccine expansion in Wavre and Lilly’s oral GLP-1 facility across the border illustrate the region’s pull for high-value plants. Rising R&D budgets increasingly favor cell, gene and RNA modalities, repositioning Belgium as a potential European launchpad once local capacity gaps close.
By Distribution Channel: Online Pharmacies Disrupt as Hospitals Retain Procurement Power
Hospital outlets held 45.73% of the 2025 turnover, dispensing most oncology and complex biologic regimens. The 2026 shift to a 78% reimbursement ceiling forces sharper tender strategies and may accelerate cross-hospital purchasing alliances. Online pharmacies, aided by 91.8% e-prescription usage, post a 7.65% CAGR through 2031 and will extend reach once EU Digital Identity wallets allow cross-border fills.
Retail pharmacists, roughly 2,000 nationwide, weather thinner margins because Belgium bans supermarket drug sales, preserving a professional, advice-centric model. The European Commission’s harmonization agenda foreshadows moderated restrictions on mail-order prescriptions, opening another lane for growth.
Regulatory Landscape
Belgium regulates human medicines through the Federal Agency for Medicines and Health Products (FAMHP), which covers authorization, pharmacovigilance, and oversight of manufacturing and wholesale distribution across the product life cycle. In 2026, policy emphasis sharpened on access and affordability, including the Early and Equitable Fast Access (EEFA) pathway for innovative therapies addressing unmet need, funded in the 2026 budget (EUR 25 million). A Royal Decree dated 14 February 2026 set procedures and timelines for EEFA, linking reimbursement acceleration with tighter budget control instruments such as Managed Entry Agreements.
Supply security and market conduct requirements also tightened through 2026, reflecting ongoing medicine shortage concerns and EU-aligned resilience initiatives (including the EMA European Shortages Monitoring Platform). Belgium also updated rules affecting parallel distribution and parallel import via a Royal Decree adopted in December 2025 and entering into force in January 2026, adding harmonized digital submission processes. Looking outward, FAMHP has flagged preparations for upcoming EU pharmaceutical reform elements (such as electronic product information) as Belgium continues national transposition steps.
Value Chain Analysis
Belgium’s pharmaceutical value chain runs from R&D and clinical development through finished-dose manufacturing, quality release, and high-throughput distribution into hospital, retail, and online channels. Research intensity is supported by large multinational and local footprints (including UCB as a major domestic R&D spender), while advanced modalities increasingly raise upstream processing requirements. Regulatory gating is formal, with manufacturing and distribution activities requiring authorization under the Royal Decree of 14/12/2006, reinforcing GMP/GDP compliance across the chain.
Logistics is a structural advantage, with the Port of Antwerp-Bruges and Liege Airport forming key nodes for temperature-controlled and time-sensitive life-science flows, supporting both exports and domestic supply. At the same time, shortage management and operational transparency are becoming more data-driven as Belgium formalizes stock visibility tools (piloted in 2024) and steps up enforcement of service obligations for full-line wholesalers through thematic inspections. Industry bodies pointed to competitiveness headwinds in 2025 figures released in April 2026 (including a sector job decline and lower exports), pushing energy and operating costs, supply resilience, and plant-level sustainability compliance higher on value-chain priorities.
Competitive Landscape
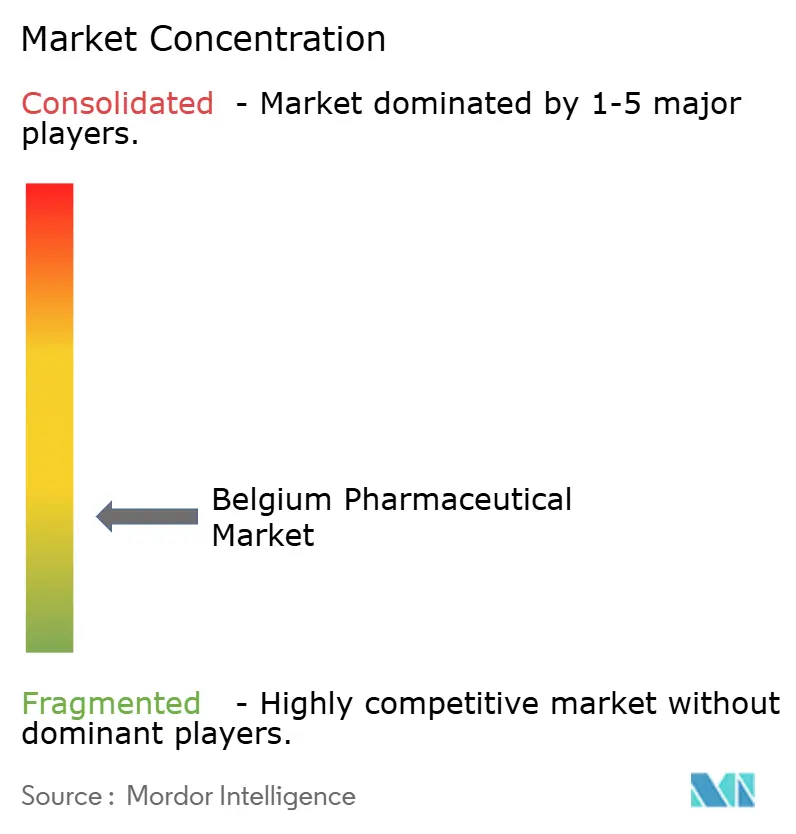
Belgium pharmaceutical market competition centers on multinational subsidiaries, with Pfizer, Janssen, GSK, Novartis and AbbVie sharing scale with homegrown UCB, which alone absorbs 41% of national R&D spend. Strategy revolves around launching specialty biologics able to weather 38% post-patent price drops through clear clinical differentiation. Viatris and Zentiva chase hospital tenders for biosimilars but progress stalls against financing incentives that still reward originator price points.
Digital tools reshape selling models as e-prescription infrastructure enables direct-to-patient support programs, loyalty apps and data-driven adherence services. Divergent manufacturing bets sharpen contrasts: Pfizer shutters its Puurs site and cuts 1,200 roles, while GSK deploys EUR 150 million into Wavre and Lilly commits EUR 2.6 billion to a Netherlandic oral-solid plant. Belgium’s 417 patent filings in 2024 confirm fertile IP output, yet supply resilience dominates boardroom agendas after immunoglobulin shortages revealed logistical weak spots. Commercial alliances now blend R&D co-funding with risk-sharing reimbursement models to accelerate time-to-value.
Belgium Pharmaceutical Industry Leaders
-
AstraZeneca plc
-
AbbVie Inc.
-
Bayer AG
-
GlaxoSmithKline plc
-
Boehringer Ingelheim International GmbH
- *Disclaimer: Major Players sorted in no particular order
Market Opportunities and Future Outlook
A visible opportunity set sits at the intersection of faster access mechanisms and specialty innovation, where Belgium’s EEFA pathway (implemented from January 2026, with procedures formalized by the 14 February 2026 Royal Decree) creates a clearer route for oncology and rare-disease therapies addressing unmet need. This is reinforced by Belgium’s high digital readiness for patient access and dispensing workflows (100% eHealth score and 91.8% e-prescription penetration) and by near-term EU interoperability initiatives (EU Health Data Space and Digital Identity Wallet) that support cross-border e-prescription redemption.
Manufacturing and platform investment also underpin whitespace in advanced modalities and high-value biologics. In 2026, UCB inaugurated a EUR 200 million gene therapy facility in Braine-l’Alleud, and GSK announced a EUR 150 million clinical laboratory investment in Rixensart to consolidate clinical laboratory activities linked to vaccine development, highlighting continued capex concentration in Belgium’s biopharma clusters. Supply resilience programs create additional openings for compliant manufacturers, distributors, and digital tooling providers as Belgium tightens shortage monitoring and stock reporting. Cost-containment levers, including mandatory post-exclusivity price cuts and the 2026 hospital reimbursement ceiling change, increase the premium for differentiated outcomes evidence, risk-sharing arrangements, and efficient channel strategies.
Recent Industry Developments
- July 2026: Besins Healthcare completed the acquisition of UniD Manufacturing in Seraing, strengthening its long-acting drug delivery capabilities through a Belgian CDMO footprint. The move concentrates specialized manufacturing know-how locally and supports customers seeking sustained-release formulations and differentiated delivery technologies.
- June 2026: GSK announced a EUR 150 million investment in a clinical laboratory in Rixensart, Walloon Brabant, consolidating clinical laboratory activities to support vaccine development programs. The project adds local capacity for development and testing work, reinforcing Belgium’s role in the regional biopharma R&D and manufacturing ecosystem.
- December 2025: Belgium confirmed its participation in FAST-EU, an EU initiative aimed at streamlining and accelerating multinational clinical trial approvals. The step strengthens Belgium’s positioning in cross-border clinical development by reducing process friction for sponsors running multi-country studies.
Research Methodology Framework and Report Scope
Market Definition and Coverage
For this study, the Belgium pharmaceutical market covers human prescription and over-the-counter finished medicines, including small molecules and biologics, that are manufactured in or imported into Belgium and commercially invoiced in the country at ex-factory values.
Scope exclusions: Veterinary medicines, stand-alone active pharmaceutical ingredients meant for export, medical devices, and food supplements are excluded.
Segmentation Overview
- By ATC / Therapeutic Class
- Alimentary Tract & Metabolism
- Blood & Blood-Forming Organs
- Cardiovascular System
- Dermatologicals
- Genito-Urinary System
- Systemic Hormonal Preparations
- Nervous System
- Musculoskeletal System
- Respiratory System
- Other Therapeutic Classes
- By Drug Type
- Prescription Drugs
- Branded
- Generics
- OTC Drugs
- Prescription Drugs
- By Molecule Type
- Small-Molecule Pharmaceuticals
- Biologics
- Biosimilars
- Advanced Therapy Medicinal Products (ATMPs)
- By Distribution Channel
- Hospital Pharmacies
- Retail Pharmacies
- Online Pharmacies
Data Sources, Market Sizing, and Validation
Desk Research
Desk work starts by mapping how medicines flow in Belgium, from manufacturing and imports to invoicing and use, since that affects what can be counted cleanly at ex-factory values. We review public statistics and policy notes to understand demand drivers, the price framework, and reimbursement changes that can shift volumes between retail and hospital settings.
Sources used include public and official references such as Belgium's national statistics office, Eurostat, the European Medicines Agency, the OECD health statistics series, and World Bank population and macro indicators. We also use company annual reports, investor presentations, and government gazettes for relevant policy updates, plus association publications from the Belgian biopharmaceutical ecosystem. Where needed, paid subscriptions are used for company financials and intelligence, news and financials, and patent databases to cross-check timelines around launches and loss of exclusivity. The sources above are illustrative rather than exhaustive, and additional public documents were also reviewed to collect data, validate assumptions, and clarify open questions.
Primary Interviews and Surveys
Primary work is used to pressure-test the pricing logic and the timing of market events that desk sources may not explain well, particularly when translating ex-factory invoiced values versus retail spending. We speak with a mix of manufacturers, distributors, hospital and retail channel stakeholders, and payer or policy-informed experts, then re-check key assumptions across Belgium's main demand centers and cross-border supply touchpoints.
Distribution of primary research fieldwork respondents
| Company type | Respondent position |
|---|---|
| Top tier: 34% | CXOs: 17% |
| Mid tier: 44% | Functional/Unit leaders: 26% |
| Smaller Players: 22% | Managers: 57% |
Market-Sizing & Forecasting
The sizing model starts from a top-down reconstruction tied to Belgium's medicine demand pool, where consumption and supply signals are translated into an ex-factory value view. In practice, historical spend and volume indicators are aligned with key policy dates, then adjusted for channel mix so hospital and retail movements are not double-counted.
To keep the totals realistic, selective bottom-up checks are used, such as sampled price per pack multiplied by estimated packs, sanity checks around major therapy groups, and distributor and supplier sense checks on growth rates. Core inputs include the pace of new product launches and uptake, loss of exclusivity and generic penetration, inflation and exchange-rate timing for non-euro priced references, reimbursement and tender cycles that shape realized prices, and shifts between hospital-only and retail dispensing. Forecasting relies on scenario analysis supported by expert views, with base, faster uptake, and slower reimbursement timing cases run before choosing a single central forecast. Where gaps appear in bottom-up views, for example limited visibility on smaller brands, the model fills them using category-level growth patterns that were validated in interviews.
Data Validation & Update Cycle
Validation is done in steps so errors are caught early, then revisited again before sign-off. Model outputs are compared with independent signals such as trade and production direction, policy-led pricing moves, and the expected impact of patent cliffs, and then any unusual jumps are investigated until a clear explanation is documented.
Before publishing, an analyst review checks currency conversions, year alignment, and whether the pricing basis stays consistent with the ex-factory scope definition. The report is refreshed annually, and interim updates are triggered when material events occur, such as major reimbursement changes, meaningful launch activity, or sharp macro shifts. Right before delivery, a fresh pass is done so clients receive the latest updated view.
Mordor Intelligence's Belgium Pharmaceutical Market Estimate Compared With Other Published Estimates
Published market values for Belgium pharmaceuticals can differ across sources, even when they appear to cover the same end market. The gaps usually come from what is counted in scope, which price level is used, and how the base year is converted and refreshed when currency timing changes.
A practical difference is that ex-factory invoiced values, retail pharmacy sales, and broader healthcare product baskets are not interchangeable, so mixing them creates spread. When price erosion after loss of exclusivity is applied using a flat percentage, or when reimbursement timing is not reflected in the year sales are recorded, results can be pushed up or down. With annual refresh checks on exchange-rate timing and ASP progression, and with follow-up validation calls on major price-step events, the 2025 figure stays aligned to invoiced ex-factory sales as modeled by Mordor Intelligence.
Benchmark comparison
| Source | Market Size | Gaps in Research Methodology |
|---|---|---|
| Mordor Intelligence | USD 8.40 B (2025) | |
| Trade Body A | USD 7.96 B (2022) | Uses an older base year and a broader health-sector framing, and the value is not consistently expressed as ex-factory invoiced sales within Belgium. |
| Industry Blog B | USD 7.02 B (2028) | Forward value appears to be a revenue style series with limited transparency on price basis, and it may blend prescription and consumer health without a clear ex-factory invoicing basis. |
The table shows that year choice and price basis explain most of the spread, rather than a single demand driver. Once scope is kept to human finished medicines invoiced in Belgium and prices are treated consistently across years, the market size is easier to trace back to clear steps and checkable inputs.
Key Questions Answered in the Report
How large will Belgium's prescription segment be by 2031?
Prescription drugs, holding 86.85% of 2025 revenue, are projected to follow a 5.8% market CAGR, placing their 2031 value near USD 10.2 billion within the Belgium pharmaceutical market size.
Which therapeutic class is forecast to grow fastest to 2031?
Dermatologicals lead with a 7.54% CAGR as biologic treatments for psoriasis and atopic dermatitis gain reimbursement traction.
What drives online-pharmacy growth in Belgium?
A 91.8% e-prescription rate, a 100% eHealth indicator score and forthcoming EU cross-border e-prescription rules support a 7.65% CAGR for online channels.
Why do biosimilars gain ground slowly?
Hospital financing ties revenue to drug prices, so institutions favor higher-priced originators, muting biosimilar adoption until reimbursement reform occurs.
How big is BelgiumÕs pharmaceutical export surplus?
The sector generated a EUR 16.6 billion trade surplus in 2024, reflecting its role as a high-value production and export hub.
Which policy most eases patient access to innovative drugs?
The Early and Equitable Fast Access program, funded with EUR 25 million in the 2026 budget, cuts reimbursement timelines for breakthrough therapies.