
Beauty Camera Apps Market Size and Share
Market Overview
| Study Period | 2020 - 2031 |
|---|---|
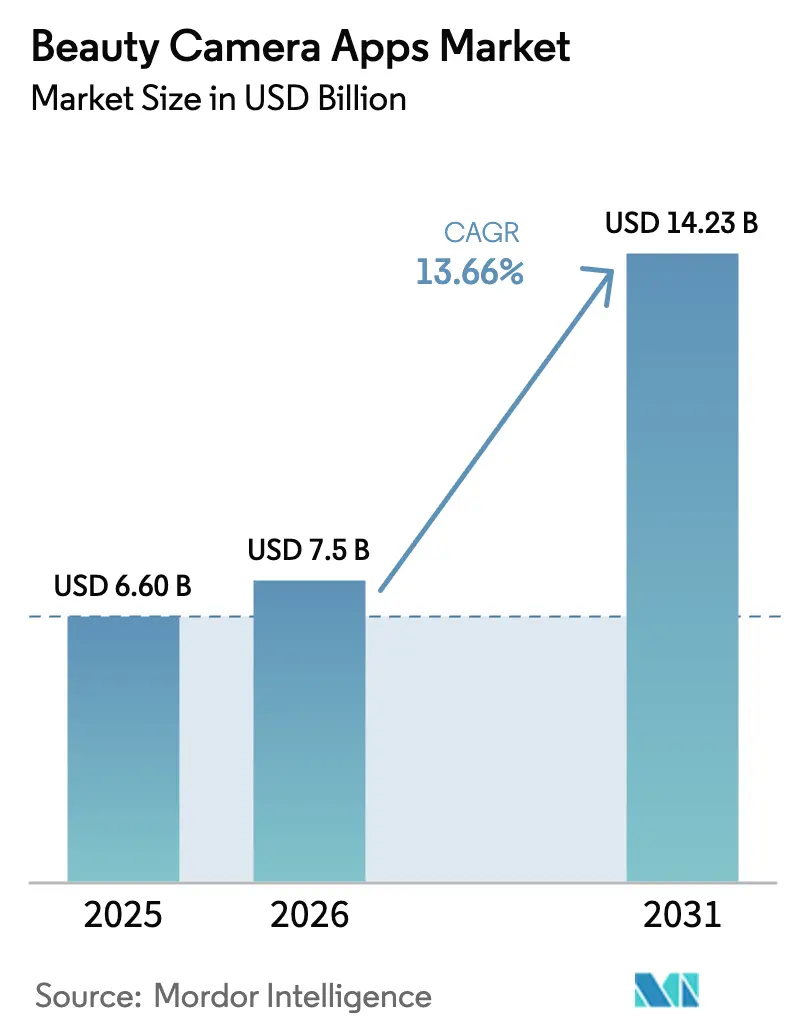
| Market Size (2026) | USD 7.5 Billion |
| Market Size (2031) | USD 14.23 Billion |
| Growth Rate (2026 - 2031) | 13.66% CAGR |
| Fastest Growing Market | Asia Pacific |
| Largest Market | Asia Pacific |
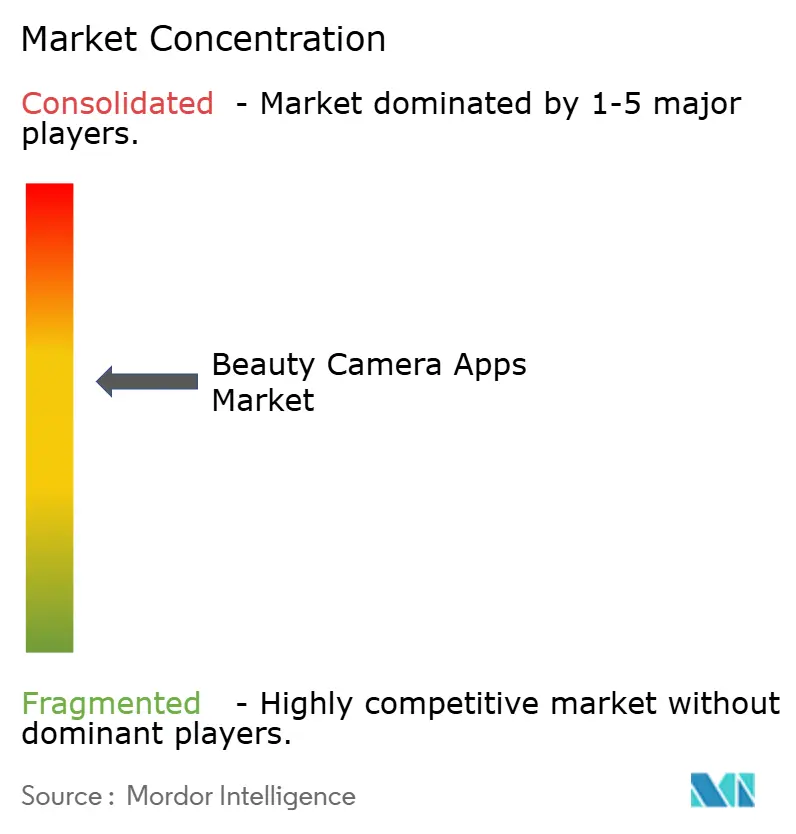
| Market Concentration | Medium |
Major Players *Disclaimer: Major Players sorted in no particular order Image © Mordor Intelligence. Reuse requires attribution under CC BY 4.0. | |
Beauty Camera Apps Market Analysis by Mordor Intelligence
beauty camera apps market size in 2026 is estimated at USD 7.5 billion, growing from 2025 value of USD 6.6 billion with 2031 projections showing USD 14.23 billion, growing at 13.66% CAGR over 2026-2031. Edge-AI deployment, the viral momentum of short-form video platforms, and a widening creator economy underpin this double-digit trajectory. OEM pre-installation agreements, such as those with Meitu apps aboard Samsung Galaxy and vivo handsets, lower user-acquisition costs and cement brand stickiness. The Asia-Pacific region remains the growth engine, buoyed by China’s sophisticated beauty-tech ecosystem, while privacy-focused monetization models gain traction in North America and Europe as GDPR and CPRA compliance become non-negotiable.
Key Report Takeaways
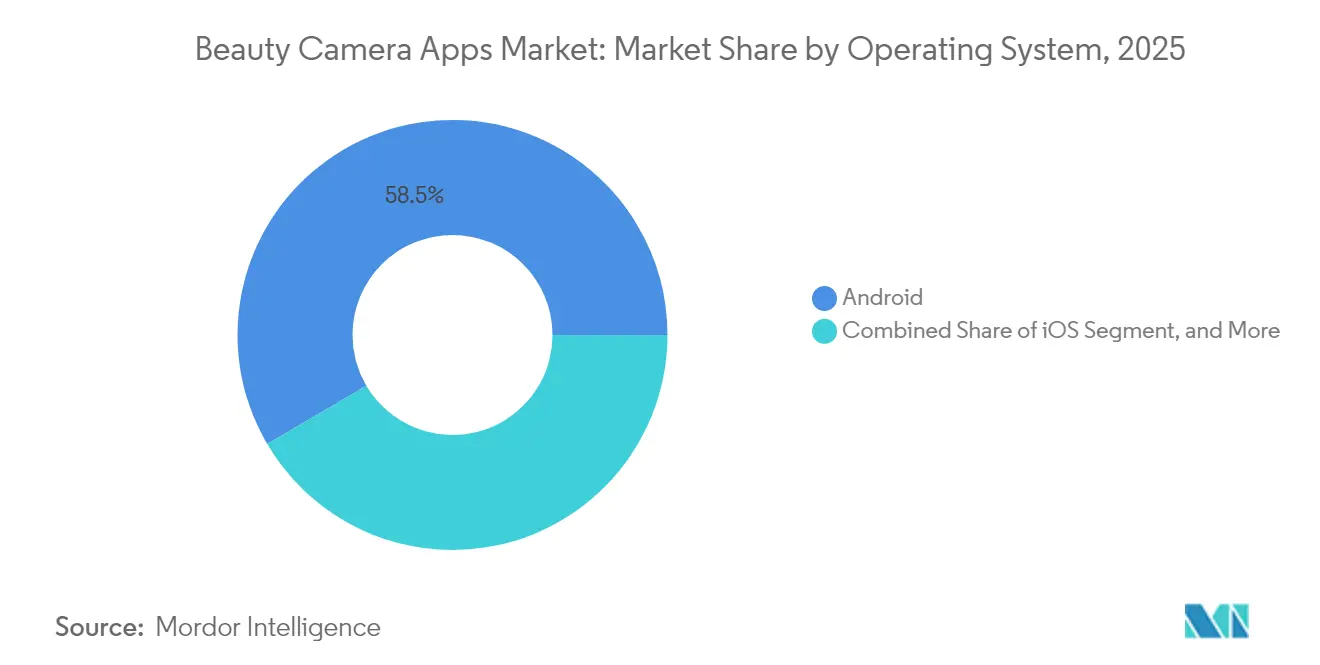
- By operating system, Android maintained 58.47% of the beauty camera apps market share in 2025, while iOS adoption is projected to rise at a 14.72% CAGR through 2031.
- By device, smartphones and tablets commanded a 61.58% share of the beauty camera apps market size in 2025; PC-based solutions are projected to grow at a 14.08% CAGR through 2031.
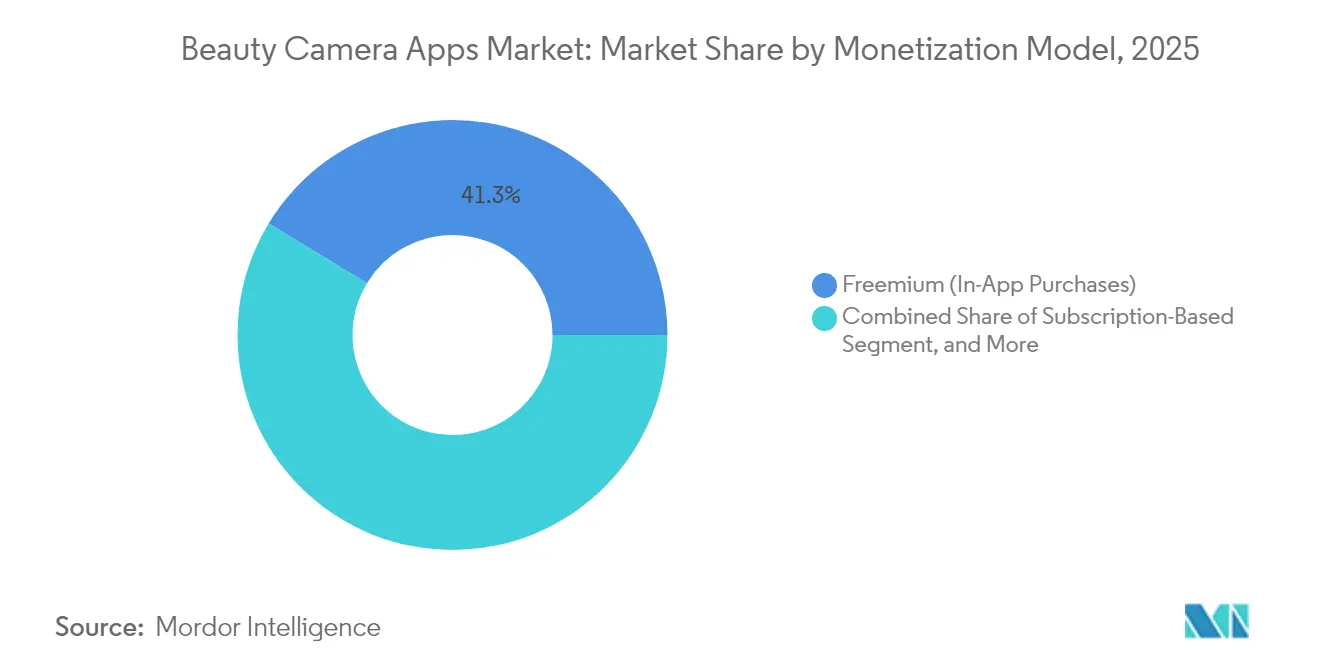
- By monetization model, freemium in-app purchases captured 41.32% of the revenue in 2025, whereas subscriptions exhibited the fastest expansion at a 13.96% CAGR to 2031.
- By use case, photo beautification led with a 28.12% market share of beauty camera apps in 2025, whereas video beautification is advancing at a 15.06% CAGR through 2031.
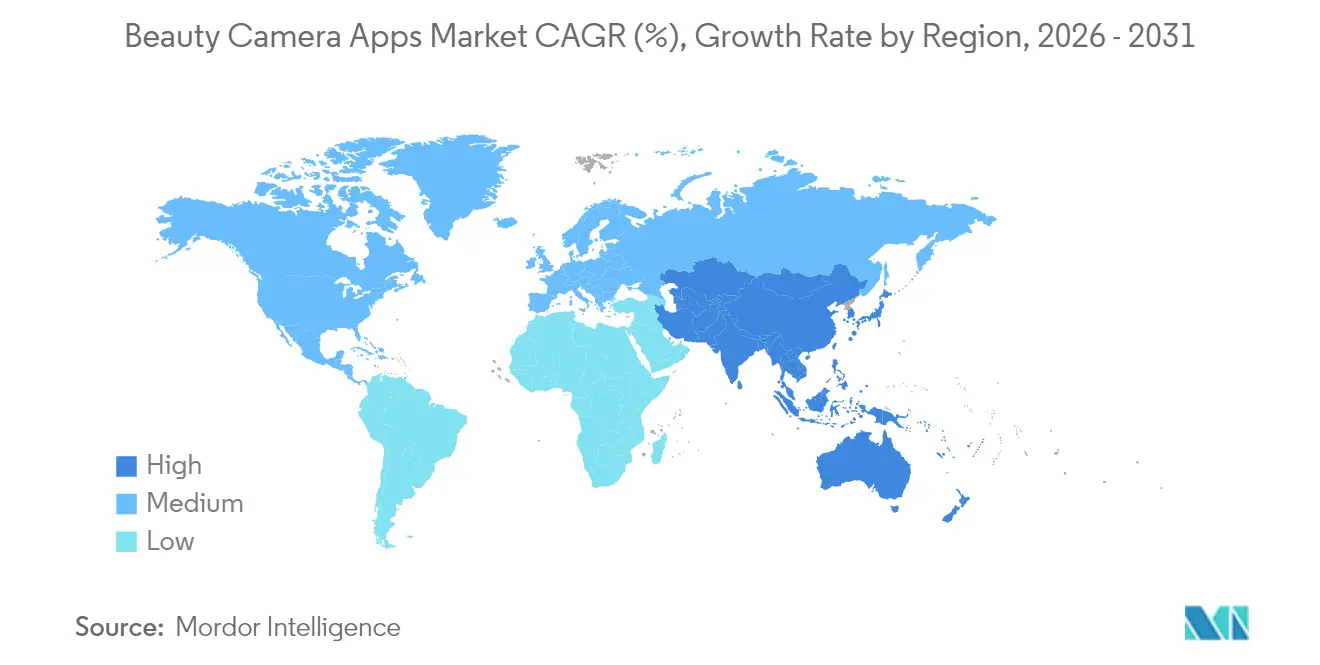
- By geography, the Asia-Pacific region held a 31.34% revenue share in 2025 and is forecast to post a 15.22% CAGR, outpacing all other regions.
Note: Market size and forecast figures in this report are generated using Mordor Intelligence’s proprietary estimation framework, updated with the latest available data and insights as of 2026.
Global Beauty Camera Apps Market Trends and Insights
Drivers Impact Analysis*
| DRIVER | (~) % IMPACT ON CAGR FORECAST | GEOGRAPHIC RELEVANCE | IMPACT TIMELINE |
|---|---|---|---|
| Low-cost high-resolution mobile cameras | +2.8% | Global (emerging markets lead) | Medium term (2-4 years) |
| Viral social-media “glow-up” challenges | +2.1% | North America, Europe, Asia-Pacific | Short term (≤2 years) |
| OEM pre-installation partnerships | +3.2% | Asia-Pacific core, global spill-over | Long term (≥4 years) |
| Edge-AI real-time beautification | +3.7% | Developed markets first | Medium term (2-4 years) |
| Rising creator-economy monetization needs | +2.4% | North America and Asia-Pacific, expanding globally | Short term (≤ 2 years) |
| Expansion of 5G video-centric usage patterns | +2.9% | Developed markets initially, global expansion | Long term (≥ 4 years) |
| Source: Mordor Intelligence | |||
Edge-AI Enabling Real-Time Beautification
Edge processing enables sub-50 ms rendering of filters, eliminating latency and privacy risks associated with cloud uploads. Tencent’s RTC SDK and BytePlus libraries now support dynamic skin smoothing, nose reshaping, and lighting correction on-device, thanks to neural processing units within flagship chips[1]Tencent Cloud Documentation, “Real-Time Communication SDK,” tencentcloud.com . Brands can iterate new effect libraries without server load, preserving battery life while unlocking premium subscription tiers anchored around AI-powered edits.
OEM Pre-Installation Partnerships
Meitu’s default placement on Samsung Galaxy and vivo devices puts the app in front of millions at activation, thereby shortening the payback periods for research and development, as well as marketing.[2]Samsung Newsroom, “Galaxy Camera Partnerships,” samsung.com SenseTime’s vivo integration demonstrates how real-time AI beauty is now a baseline functionality, especially across Asian markets where a “camera-ready” aesthetic is culturally normalized. OEM bundles also guarantee hardware-level optimization, ensuring buttery-smooth 60 fps AR filters.
Rising Creator-Economy Monetization Needs
As the creator economy continues to grow, there is an increasing demand for flexible editing suites that help maintain brand consistency across multiple platforms. Tezza's subscription model, which offers exclusive presets tailored to individual user needs, underscores the willingness of users to invest in tools that enable them to achieve unique and professional visual aesthetics. Similarly, Perfect Corp's YouCam Video integrates beauty filters with advanced cinematic color grading capabilities, allowing influencers to create high-quality, visually appealing reels without relying on traditional desktop software.
Viral Social-Media “Glow-Up” Challenges
With 2.3 billion views, TikTok's #GlowUp hashtag has encouraged passive viewers to transition into active content creators by utilizing the same filters that drive these trends.[3]TikTok Trends, “Viral Challenge Analytics,” tiktok.com Similarly, Snap's open Lens ecosystem has facilitated the creation of 250,000 user-generated AR filters, which have contributed to daily engagement rates exceeding 75%. This widespread adoption underscores the pivotal role of user-generated content in driving organic growth, reducing reliance on paid acquisitions, and facilitating the expansion of global user bases.
Restraints Impact Analysis*
| RESTRAINT | (~) % IMPACT ON CAGR FORECAST | GEOGRAPHIC RELEVANCE | IMPACT TIMELINE |
|---|---|---|---|
| Privacy regulations (GDPR, CPRA) | −1.8% | Europe, California | Medium term (2-4 years) |
| Deep-fake and body-image backlash | −1.2% | Global (developed markets) | Short term (≤2 years) |
| OS-level in-built editing tools cannibalization | -2.1% | Global, accelerated in iOS ecosystem | Long term (≥ 4 years) |
| Monetization saturation / subscription fatigue | -1.6% | Developed markets primarily, emerging market spillover | Medium term (2-4 years) |
| Source: Mordor Intelligence | |||
Deep-Fake and Body-Image Backlash
Research published in the Journal of Behavioral Addictions highlights a connection between heavy social media use and increased body dysmorphia in individuals aged 13 to 25. The study highlights that excessive reliance on beautification tools can distort self-perception, resulting in negative psychological impacts, particularly among younger users. In response, Instagram has removed its “plastic-surgery” filters, and TikTok has started flagging altered clips to limit extreme edits. To maintain user trust and dodge regulatory oversight, developers are urged to shift towards “authenticity” settings, implementing voluntary caps on distortion intensity.
Monetization Saturation and Subscription Fatigue
U.S. consumers hold an average of 3.2 paid app plans, driving beauty apps into fierce wallet-share battles with entertainment and productivity subscriptions. Harvard Business Review data show that subscription users engage 4.7 times more than freemium users, yet churn spikes when incremental value wanes. Bundled services, cloud storage, and AI advisors are emerging as antidotes to fatigue, but require continuous feature delivery cycles, squeezing smaller developers.
*Our forecasts treat driver/restraint impacts as directional, not additive. The impact forecasts reflect baseline growth, mix effects, and variable interactions.
Segment Analysis
By Operating System: iOS Commands Premium ARPU
Driven by Apple's Neural Engine, which processes a staggering 600 billion operations per second, the beauty camera apps market for iOS users is projected to expand at a robust CAGR of 14.72% through 2031. While Android holds a dominant 58.47% share in units sold, the higher spending power of iOS users contributes to an increase in the average revenue per user, balancing the market dynamics. Developers are utilizing Metal APIs, which enable real-time 4K video beautification and provide opportunities for subscription-based revenue models.
On the other hand, Android's open architecture facilitates deeper sensor-level integrations and supports experimental AR overlays. However, this flexibility results in increased QA expenses due to hardware fragmentation. Furthermore, Google's native portrait enhancements reduce the differentiation of third-party applications, encouraging Android-focused apps to explore community-driven filter marketplaces as an alternative strategy.


By Device: PC Adoption Rises with Hybrid Workflows
Driven by the demands of livestreaming, video conferencing, and professional post-production, desktop installations are witnessing a robust 14.08% CAGR. While the market share of beauty camera apps on PCs is still modest, creators are increasingly gravitating towards larger screens for detailed color grading and batch exports. For instance, the OBS Studio plug-in integrates skin-tone correction in real-time streams, showcasing the growing cross-platform collaborations. These collaborations encourage vendors to align mobile captures with cloud-processed desktop edits, enabling seamless workflows.
As remote work continues to persist, the use of “virtual makeup” in Zoom meetings highlights its expanding relevance, broadening the target audience to include professionals and other users beyond social media enthusiasts.
By Monetization Model: Subscriptions Outpace Freemium
In 2025, freemium models with in-app purchases command a 41.32% market share, capitalizing on the allure of "free" downloads while generating revenue through premium filter packs and advanced features. Yet, subscription-based models are on a rapid ascent, boasting a 13.96% CAGR, as developers chase stable revenue and enhanced customer lifetime values. Perfect Corp's YouCam Perfect is a case in point: its subscription revenue jumped from 45% in 2022 to 68% in 2024, underscoring this industry pivot. Meanwhile, ad-supported models grapple with iOS privacy shifts that dampen targeted advertising, and one-time paid apps find it tough to compete with their feature-laden freemium counterparts.
The subscription model thrives by financing ongoing AI enhancements and regular content refreshes, keeping users hooked. Insights from behavioral economics reveal that subscribers engage with apps 4.7 times more frequently than their freemium counterparts, fostering a cycle of heightened engagement and loyalty. Yet, as consumers grow wary of recurring charges, a phenomenon dubbed "subscription fatigue" emerges. This trend compels developers to showcase undeniable value, often through exclusive content and premium features, to justify the ongoing expense.
By Use Case: Video Beautification Accelerates
In 2025, photo beautification commands a dominant 28.12% market share, underscoring its foundational role in the beauty camera app landscape. Meanwhile, video beautification is on a rapid ascent, boasting a 15.06% CAGR. This surge is largely attributed to TikTok's influence on content creation trends and the creator economy's push for high-quality video content. Notably, real-time video processing demands far greater computational power than its static photo counterpart, presenting a lucrative avenue for developers adept at fine-tuning algorithms to suit mobile hardware limitations.
As augmented reality (AR) capabilities on smartphones evolve, AR filters and stickers are emerging as a significant growth avenue. Snap's Lens Studio has spawned over 250,000 community-driven AR experiences, and ByteDance's Effect House enhances TikTok's expanding filter repertoire. Features that integrate social-sharing have transitioned from being unique selling points to essential expectations, with users now anticipating effortless sharing across platforms. Furthermore, content creators are gravitating towards professional editing tools, seeking advanced features like color grading and lighting adjustments, which were once the domain of desktop software.
Geography Analysis
The Asia-Pacific region generated 31.34% of the revenue in 2025 and is projected to compound at a 15.22% rate through 2031, reflecting the cultural acceptance of virtual beautification and the abundance of local innovators, such as Meitu and Snow. China’s 5G infrastructure and super-app ecosystems accelerate AR adoption, while India’s declining smartphone ASP expands reach among Gen-Z users who drive filter virality.
North America records high ARPU but slower user growth; privacy-compliant, on-device processing, and CPRA adherence shape product roadmaps. Partnerships with cosmetics retailers Ulta’s AR Shopping Lens via Snap, fuse beauty commerce and social engagement, nurturing incremental revenue streams beyond ads.
Europe’s GDPR oversight limits biometric data retention, but affluent users in Germany and the Nordics subscribe to premium suites that promise data minimization. Localization to diverse skin tones and a multilingual UI elevate adoption in France, Italy, and Spain, although the region’s proportion of the beauty camera apps market size lags behind the Asia-Pacific region due to stricter ad-targeting policies.

Regulatory Landscape
Beauty camera apps increasingly sit at the intersection of privacy, biometric processing, and AI transparency rules. In Europe, GDPR constraints on biometric identifiers and data minimization shape product design decisions such as on-device processing and reduced retention of face templates. The EU AI Act adds new obligations for manipulated or AI-generated content, including disclosure requirements under Article 50, which applies from August 2, 2026. These rules raise compliance stakes for real-time beautification, face reshaping, and synthetic media features that can qualify as manipulated content.
In the United States, California privacy compliance under CCPA/CPRA and state-by-state consumer privacy laws increases operational complexity. Illinois BIPA remains a notable enforcement lever for face-related data practices, reinforced by reported settlement activity tied to biometric collection without adequate consent. Parallel policy attention on nonconsensual imagery and likeness rights, including the TAKE IT DOWN Act and proposed federal approaches such as the NO FAKES Act, elevates content governance requirements for apps that enable face alteration, sharing, and reposting workflows.
Value Chain Analysis
The beauty camera apps value chain starts with core algorithm and content infrastructure, including proprietary AI/AR models, effect libraries, and SDKs owned or distributed by platforms such as Perfect Corp. (YouCam), Meitu, Lightricks (Facetune), and Snap (Lens ecosystem). Upstream inputs include smartphone camera hardware capabilities (sensors, NPUs/GPUs), OS-level APIs, and creator toolchains that support capture, rendering, and export performance, particularly for video beautification and AR overlays.
Midstream activities include data operations and model iteration (training pipelines, QA across device fragmentation, and performance optimization for low-latency on-device rendering), along with distribution through app stores and OEM pre-installation arrangements that reduce acquisition costs. Downstream monetization uses freemium in-app purchases, consumer subscriptions, and enterprise SaaS or white-label deployments that embed virtual try-on and beauty effects into retailer and brand experiences. This extends the chain beyond consumers to cosmetics brands, e-commerce platforms, and creator ecosystems that need consistent cross-platform output.
Competitive Landscape
The market is moderately fragmented. Perfect Corp extends B2B white-label modules that embed virtual try-on within L’Oréal and Estée Lauder e-commerce portals, diversifying revenue beyond direct-to-consumer apps. Meitu leverages Chinese social commerce linkages to monetize through influencer storefronts, translating to USD 892 million revenue with 23.6% YoY growth in 2024.
Snap Inc. positions Snapchat as an AR platform, driving user retention via gamified lenses and a creator revenue-share model that rewards popular filter designers. ByteDance’s CapCut merges video editing and beautification, reflecting user preference for single-suite workflows. Adobe’s Lightroom Mobile infuses AI skin-smoothing to defend its professional creator base against mobile-first upstarts.
Emerging disruptors such as Lightricks (Facetune), Camera360, and LINE Camera pursue niche plays in men’s grooming, low-light optimization, and beauty filters for video calls, respectively. Meanwhile, blockchain-based authenticity tags by Reface address concerns about deep-fakes. First-mover compliance with evolving privacy norms is becoming a decisive differentiator.
Beauty Camera Apps Industry Leaders
Perfect Corp.
Meitu Inc.
Snap Inc.
Lightricks Ltd.
CyberLink Corp.
- *Disclaimer: Major Players sorted in no particular order

Market Opportunities and Future Outlook
A major opportunity is compliance-led product differentiation, as disclosure, consent, and data-minimization requirements move into feature roadmaps. The EU AI Act Article 50 disclosure obligations effective August 2, 2026, alongside GDPR and CPRA pressures, creates room for on-device beautification, transparent labeling of altered media, and privacy-preserving personalization that avoids persistent face-template storage. Apps that operationalize these controls without compromising sub-50 ms rendering performance can compete on trust as well as visual quality.
Enterprise SaaS and embedded commerce flows also remain an expansion lane, supported by existing commercial activity from vendors selling AI/AR modules to brands and retailers. Perfect Corp reported USD 60.2 million in 2024 revenue, with subscription revenue for AI and AR technology rising to USD 14.9 million in Q2 2025 (15.6% growth), which points to continued willingness to pay for packaged capabilities beyond consumer apps. On the consumer side, subscription-first monetization keeps showing traction in large-scale pay bases, including Lightricks reporting over 6.6 million monthly paying users and reorganizing in February 2026 to accelerate AI-premium growth. This supports opportunity for higher-value tiers tied to generative AI creation, creator workflow tools, and video-first beautification aligned to short-form content production.
Recent Industry Developments
- June 2026: Snap Inc. introduced SPECS augmented reality glasses at Augmented World Expo 2026. The launch extends beauty capture capabilities by integrating AR hardware with software workflows, enabling standalone beauty capture and editing in mobile wearables.
- May 2026: Perfect Corp. reported unaudited FQ1/FY2025-2025 results (Three Months and Full Year Ended December 31, 2025). The update provides signals on liquidity and strategic direction for a major beauty-capture platform.
- May 2026: Meitu Inc. reported 17.9 million global paying subscribers in Q1 2026 (YoY +30.2%). The subscriber growth supports monetization and user engagement metrics for creator ecosystems in beauty apps.


Research Methodology Framework and Report Scope
Market Definition and Coverage
For this methodology, the beauty camera apps market means mobile and desktop applications that apply beauty enhancement features to photos or videos, including face retouching, makeup looks, and AR effects. The market value is measured as revenue earned from app monetization.
Scope exclusions: We exclude general camera apps where beauty features are not a core use case, and we also exclude smartphone camera hardware sales.
Segmentation Overview
- By Operating System
- Android
- iOS
- Other Operating Systems
- By Device
- Smartphone / Tablet
- PC
- By Monetization Model
- Freemium (In-App Purchases)
- Subscription-Based
- Ad-Supported
- One-Time Paid
- By Use Case
- Photo Beautification
- Video Beautification
- AR Filters and Stickers
- Social-Sharing Integrated
- Professional Editing
- By Geography
- North America
- United States
- Canada
- Mexico
- South America
- Brazil
- Argentina
- Rest of South America
- Europe
- Germany
- United Kingdom
- France
- Italy
- Spain
- Russia
- Rest of Europe
- Asia-Pacific
- China
- Japan
- India
- South Korea
- South-East Asia
- Rest of Asia-Pacific
- Middle East and Africa
- Middle East
- Saudi Arabia
- United Arab Emirates
- Rest of Middle East
- Africa
- South Africa
- Egypt
- Rest of Africa
- Middle East
- North America
Data Sources, Market Sizing, and Validation
Desk Research
Desk research was used to set market boundaries, review user and creator behavior, and form initial assumptions on monetization and feature adoption. We referred to public sources such as the US Federal Trade Commission guidance on digital advertising practices, EU GDPR materials from official EU portals, and OECD digital economy statistics to keep privacy and data-use assumptions grounded.
To anchor demand indicators, we also reviewed sources such as ITU connectivity data, World Bank digital adoption indicators, and open publications from mobile industry associations on smartphone usage and app economy trends. Company filings, investor presentations, reputable press coverage, and app store public descriptions were then used to map typical revenue levers such as subscriptions, in-app purchases, and ad-supported usage. Where needed, we used approved paid databases for company financials and news, and for patent searches linked to AR, face tracking, and image processing. These desk sources are not exhaustive, and many additional references were used across the research process for data collection, validation, and clarification.
Primary Interviews and Surveys
Primary work focused on interviews and structured surveys with app publishers, mobile ad and monetization specialists, creator economy advisors, and marketing practitioners who run paid user acquisition and retention programs. Because this is a global market, we covered demand patterns across Asia-Pacific, EMEA, and the Americas, which helped validate assumptions on AR feature usage, willingness to pay for premium filters, and how privacy rules can translate into ad yield outcomes.
Distribution of primary research fieldwork respondents
| Company type | Respondent position | Region |
|---|---|---|
| Top tier: 34% | CXOs: 13% | APAC: 47% |
| Mid tier: 51% | Functional/Unit leaders: 36% | EMEA: 32% |
| Smaller Players: 15% | Managers: 51% | Americas: 21% |
Market-Sizing & Forecasting
The sizing starts with a top-down build where we reconstruct the app economy revenue pool by geography, then narrow it using penetration rates for beauty-focused creation and editing behavior across key operating systems and devices. We corroborate the results using selective bottom-up approximations, where sampled publisher revenues, observed monetization mixes, and channel checks on typical price points are used to validate totals and adjust outliers.
Model inputs include, for example, smartphone and internet user trends, the share of users engaging in short-form video creation, subscription take-up for premium effects, average in-app purchase intensity for filters and add-ons, and advertising monetization assumptions under privacy changes. Because growth is sensitive to feature cycles, we also tracked the pace of AR filter refreshes, on-device processing adoption, and regional differences in creator-led demand. Where a company-level revenue split is not disclosed, gaps are handled by applying peer-group benchmarks for monetization mix and by using conservative adoption ramps validated in primary discussions.
For forecasting, we relied mainly on scenario analysis, since regulation, platform policy, and consumer tastes can shift quickly. Scenarios were anchored to expert views on the direction of subscription pricing, ad yield trends, and the expected rollout of new real-time beautification capabilities, and then blended into a central case for the final forecast.
Data Validation & Update Cycle
Validation uses multiple checks so the final numbers remain consistent with how the market behaves in practice. We compare modeled outputs against independent signals such as consumer app usage direction, known monetization patterns for freemium apps, and visible shifts in privacy and ad targeting rules. Any anomalies are reviewed prior to sign-off.
If a large variance appears, we re-check the assumptions, re-run sensitivity tests on the most influential inputs, and re-contact select experts when needed. Reports are refreshed annually, with interim updates triggered by material events such as policy changes, platform rule changes, or major monetization shifts. Before delivery, a fresh analyst pass is completed so clients receive the latest updated view.
Mordor Intelligence's Beauty Camera Apps Market Sizing Compared With Other Published Estimates
Published market sizes for beauty camera apps can differ even when the topic seems the same, mainly because each publisher defines the boundary slightly differently and applies different revenue recognition logic. Timing also matters because app monetization can change quickly with platform policy updates and new feature releases.
By tracking subscription and in-app purchase price points, ad-supported yield assumptions, and region-level creator adoption signals, Mordor Intelligence sets the 2026 market scope to include only beauty-focused camera and editing app revenues, rather than bundling broader photo tools or adjacent influencer services. Differences typically come down to whether AR filters are counted only inside these apps, how freemium revenue is annualized, and whether the forecast is built around an aggressive creator economy scenario or a more conservative privacy-first scenario.
Benchmark comparison
| Source | Market Size | Gaps in Research Methodology |
|---|---|---|
| Mordor Intelligence | USD 7.5 B (2026) | |
| Trade Journal A | USD 4.47 B (2026) | This estimate appears to use a narrower monetization lens that under-weights in-app purchases and assumes lower premium feature attachment, which can reduce the revenue pool in high-AR usage markets. |
| Industry Blog B | USD 4.32 B (2025) | This figure is anchored to an earlier base year and may apply simplified growth carry-forwards from selfie-app usage, without fully normalizing currency timing and the subscription shift that has accelerated in recent app updates. |
The spread across the table mostly reflects what gets counted as monetizable beauty enhancement, how freemium revenue is scaled, and which year the assumptions were last refreshed. Our approach keeps the value tied to repeatable inputs like user engagement signals, monetization mix, and region-level adoption checks, which makes the final total easier to trace and re-test.


Key Questions Answered in the Report
What is the size of the beauty camera apps market in 2026?
The beauty camera apps market size reached USD 7.5 billion in 2026 and is projected to hit USD 14.23 billion by 2031.
Which operating system generates the most revenue for developers?
IOS users spend 3.2 times more on in-app purchases than Android users, despite Android having a larger user base.
What is driving the shift toward video beautification features?
TikTok-led demand for polished short-form clips, along with the 1,200% higher shareability of video over static images, is propelling a 15.06% CAGR in video beautification.
Why are OEM pre-installation deals important?
Bundling beauty apps on devices like Samsung Galaxy provides instant user access, cuts marketing costs, and ensures hardware-level optimization of real-time filters.
How are privacy regulations affecting app design?
GDPR and CPRA impose strict biometric data controls, pushing developers to emphasize on-device processing and transparent data practices to avoid penalties.
Are subscriptions or freemium models growing faster?
Subscriptions are expanding at a 13.96% CAGR as developers seek predictable revenue, though they must combat subscription fatigue with continuous feature updates.
Page last updated on:






