
Bean-to-Bar Chocolate Market Size and Share
Market Overview
| Study Period | 2021 - 2031 |
|---|---|
| Market Size (2026) | USD 4.65 Billion |
| Market Size (2031) | USD 6.56 Billion |
| Growth Rate (2026 - 2031) | 7.14 % |
| Fastest Growing Market | Asia-Pacific |
| Largest Market | Europe |
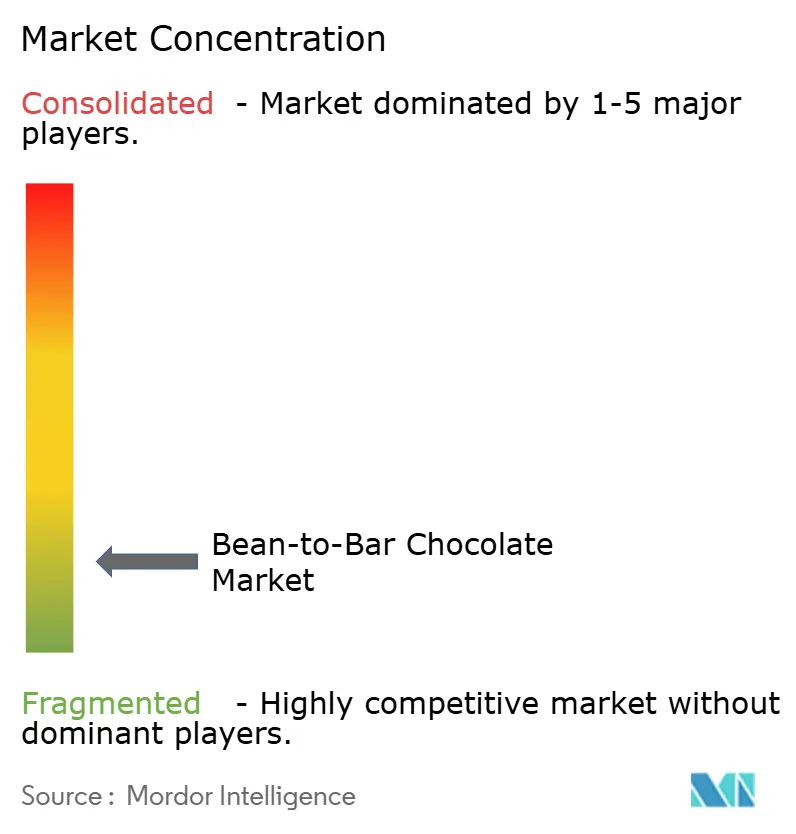
| Market Concentration | Low |
Major Players *Disclaimer: Major Players sorted in no particular order Image © Mordor Intelligence. Reuse requires attribution under CC BY 4.0. | |
Bean-to-Bar Chocolate Market Analysis by Mordor Intelligence
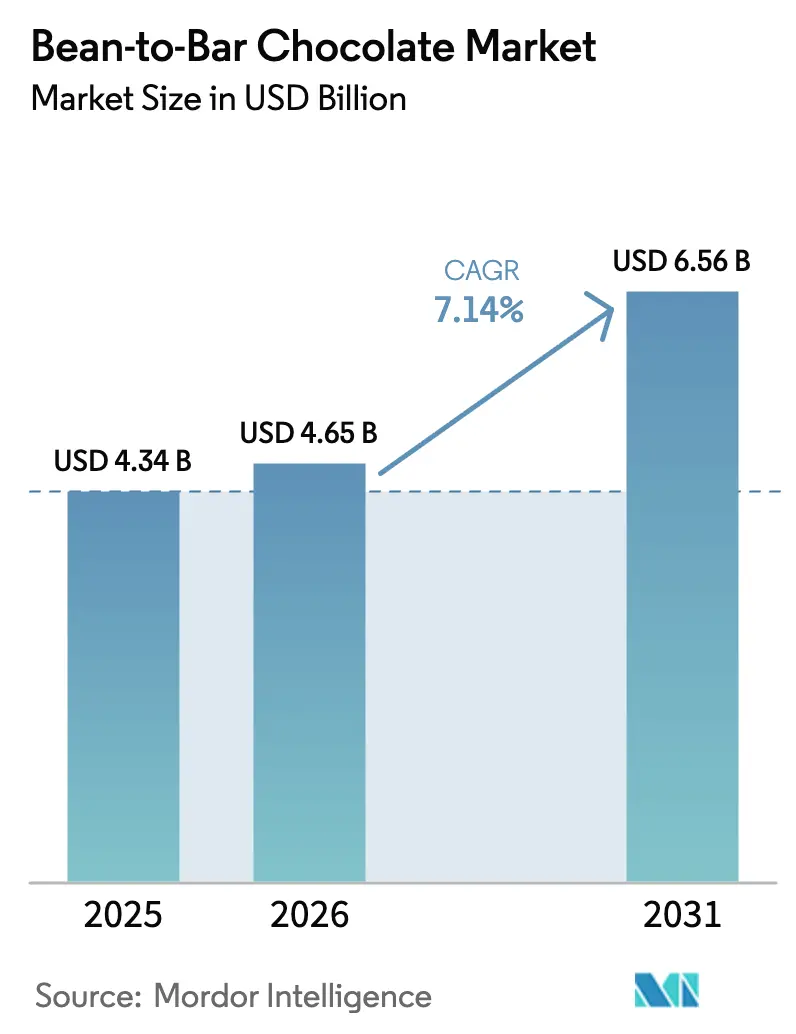
The Bean-to-Bar chocolate market size was valued at USD 4.34 billion in 2025 and estimated to grow from USD 4.65 billion in 2026 to reach USD 6.56 billion by 2031, at a CAGR of 7.14% during the forecast period (2026-2031). Consumers are increasingly gravitating towards transparent supply chains, ethical sourcing, and premium flavor profiles, which distinctly set artisanal makers apart from commodity producers. These preferences reflect a growing demand for products that align with personal values, such as sustainability and quality. Despite rising cocoa prices, growth in the market remains robust as buyers view single-origin bars as affordable luxuries that fulfill dual motives of wellness and indulgence. This trend highlights the willingness of consumers to pay a premium for products that offer both superior taste and ethical assurance. A strong e-commerce backbone has further facilitated access to these premium offerings, while innovative flavor developments continue to attract a broader audience. Additionally, Europe's stringent sustainability regulations are shaping purchasing decisions, encouraging brands to adopt environmentally responsible practices that reinforce their premium positioning. Competitive strategies in the market are increasingly centered on direct-trade models, which not only ensure consistent bean quality but also help stabilize margins in the face of price volatility, thereby strengthening the overall value proposition for both producers and consumers.
Key Report Takeaways
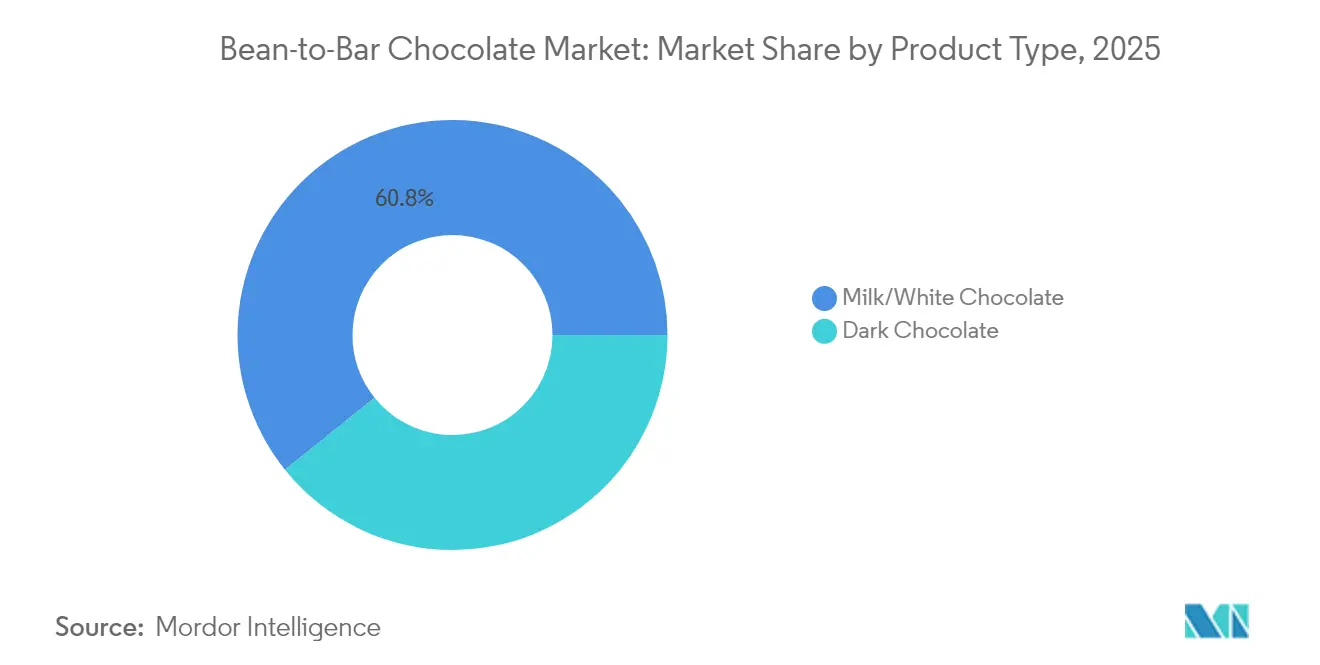
- By product type, Milk/White Chocolate held 60.78% of the Bean-to-Bar chocolate market share in 2025, while Dark Milk Chocolate is forecast to expand at a 7.28% CAGR through 2031.
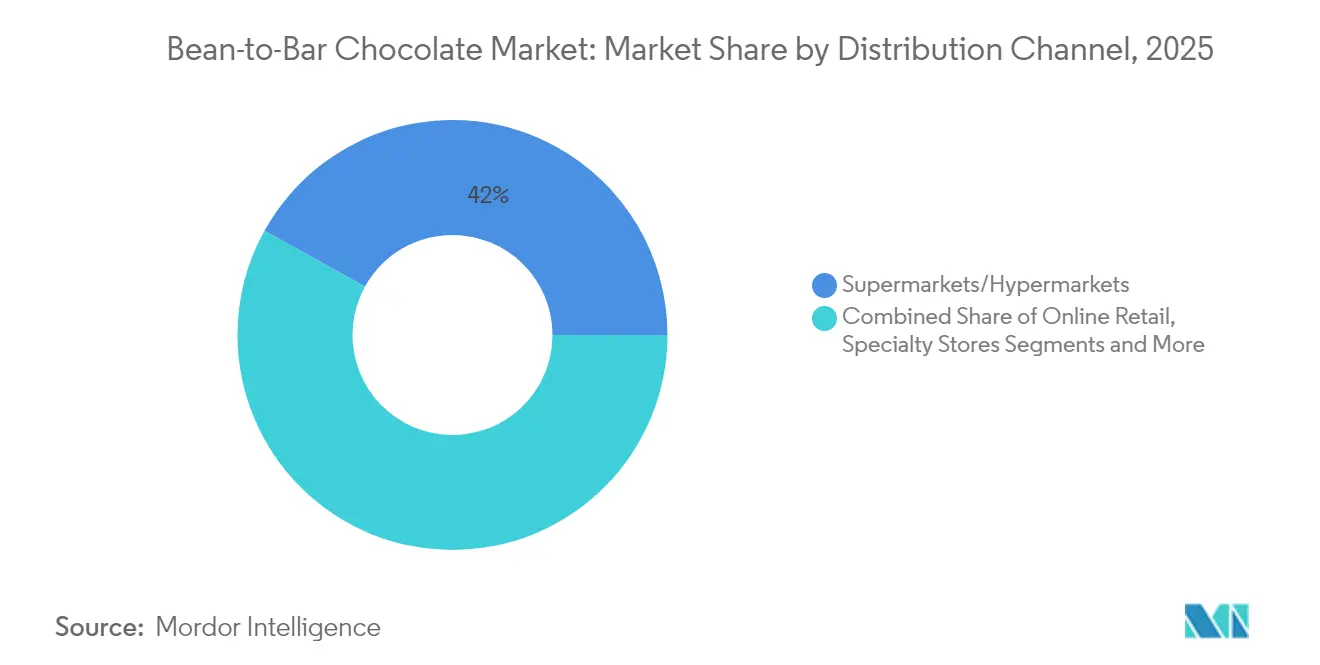
- By distribution channel, Supermarkets/Hypermarkets commanded 41.95% of the Bean-to-Bar chocolate market size in 2025, and Online Retail records the fastest 7.78% CAGR to 2031.
- By geography, Europe captured 31.02% revenue share in 2025; Asia-Pacific advances at a 7.32% CAGR over the same period.
Note: Market size and forecast figures in this report are generated using Mordor Intelligence’s proprietary estimation framework, updated with the latest available data and insights as of 2026.
Global Bean-to-Bar Chocolate Market Trends and Insights
Drivers Impact Analysis*
| Driver | (~) % Impact on CAGR Forecast | Geographic Relevance | Impact Timeline |
|---|---|---|---|
| Growing preference for dark, high-cocoa chocolate | +1.2% | Global, with stronger adoption in Europe and North America | Medium term (2-4 years) |
| Premiumisation trend in confectionery and gifting | +1.8% | Europe, North America, Asia-Pacific urban centers | Long term (≥ 4 years) |
| E-commerce expansion for micro-brands | +1.5% | Global, with acceleration in Asia-Pacific and North America | Short term (≤ 2 years) |
| Demand for ethical and traceable sourcing | +1.1% | Europe, North America, with emerging influence in Asia-Pacific | Medium term (2-4 years) |
| Emergence of cocoa-free fermentation technologies | +0.4% | Europe, North America (early adoption markets) | Long term (≥ 4 years) |
| Corporate sustainability in gifting programs | +0.6% | Global, with concentration in developed markets | Medium term (2-4 years) |
| Source: Mordor Intelligence | |||
Growing preference for dark, high-cocoa chocolate
Health-conscious consumers are increasingly associating higher cocoa content with antioxidant benefits and reduced sugar intake, which is accelerating the migration toward dark chocolate varieties and driving market premiumization. The National Confectioners Association has reported a significant rise in fine chocolate consumption, with younger, urban demographics actively driving this shift. This growing demand is enabling bean-to-bar producers to command premium margins on single-origin, high-percentage cacao bars. European specialty cocoa markets are expected to grow annually by 8.7% through 2028, with single-origin chocolates gaining strong traction among discerning consumers who value unique offerings [1]. This shift in consumer preference is also allowing smaller producers to differentiate themselves by emphasizing terroir expression and crafting unique flavor profiles that mass-market milk chocolate cannot replicate. Additionally, FDA regulations under 21 CFR 163.123 mandate a minimum of 15% chocolate liquor content for sweet chocolate, providing a clear regulatory framework to uphold quality standards.
Premiumisation trend in confectionery and gifting
The premiumisation trend is a significant driver in the Bean-to-Bar Chocolate Market. Consumers are increasingly seeking high-quality, artisanal products that offer unique flavors and superior ingredients. This shift reflects a change in purchasing behavior, where individuals prioritize value and experience, even in everyday treats. Premium chocolate brands are capitalizing on this demand by offering products that balance luxury and affordability, appealing to a broader audience. The emphasis on unique flavors, sustainable sourcing, and artisanal craftsmanship further enhances the appeal of premium chocolates as an accessible luxury option. Additionally, the gifting culture has amplified the demand for premium confectionery, as consumers prefer to present items that reflect sophistication and exclusivity. Supporting this trend, Jordbruksverket reported that Sweden's per capita consumption of chocolate and confectionery increased to 16.4 kg in 2023, up from 15.8 kg in 2021 [2]. This rise in consumption highlights the growing demand for chocolate products, including premium offerings, as consumers increasingly view chocolate as a means of affordable indulgence. The data underscores the expanding market potential for premium chocolate, driven by evolving consumer preferences for products that combine quality, taste, and an element of luxury.
E-commerce expansion for micro-brands
Micro-brands are expanding their reach through e-commerce, which is emerging as a significant driver in the Bean-to-Bar Chocolate Market. Digital commerce platforms eliminate traditional retail barriers, enabling micro-chocolate brands to reach global audiences without significant capital investment in physical distribution networks. Chinese e-commerce platforms like JD.com and Taobao facilitate market entry for international artisanal brands, with the Chinese chocolate market showing strong growth momentum despite foreign brand dominance. This direct-to-consumer approach allows micro-brands to showcase their unique offerings, such as premium-quality, ethically sourced, and artisanal chocolates, to a broader audience. This channel expansion allows producers to maintain higher margins by eliminating intermediary markups while building direct customer relationships that support premium pricing. The model particularly benefits single-origin and limited-edition products that traditional retailers might not stock due to inventory constraints or unfamiliar flavor profiles. Additionally, the convenience of online shopping and the ability to target niche consumer segments through digital marketing strategies are further fueling the growth of micro-brands in the e-commerce space.
Demand for ethical and traceable sourcing
The increasing consumer preference for ethically sourced and traceable products is a significant driver in the Bean-to-Bar Chocolate Market. Consumers are becoming more conscious of the environmental and social impact of their purchases, leading to a higher demand for transparency in the supply chain. Ethical sourcing ensures that cocoa farmers receive fair compensation and work under humane conditions, while traceability allows consumers to verify the origins and production processes of the chocolate they consume. This trend is compelling manufacturers to adopt sustainable practices and provide detailed information about their sourcing and production methods. As a result, companies focusing on ethical and traceable sourcing are gaining a competitive edge in the market. Furthermore, regulatory bodies and certifications, such as Fair Trade and Rainforest Alliance, are playing a pivotal role in promoting ethical sourcing practices. These certifications not only assure consumers of the product's authenticity but also encourage manufacturers to adhere to stringent ethical standards.
Restraints Impact Analysis*
| Restraint | (~) % Impact on CAGR Forecast | Geographic Relevance | Impact Timeline |
|---|---|---|---|
| Volatile cocoa prices and sensitivity to consumer pricing | -2.1% | Global, with acute impact in price-sensitive emerging markets | Short term (≤ 2 years) |
| Costs associated with forced-labour compliance | -0.8% | Europe, North America (strict regulatory enforcement) | Medium term (2-4 years) |
| Limitations of artisanal production scale | -1.2% | Global, particularly affecting micro-producers | Long term (≥ 4 years) |
| High failure rate for start-ups among micro-makers | -0.7% | North America, Europe (high concentration of new entrants) | Medium term (2-4 years) |
| Source: Mordor Intelligence | |||
Volatile cocoa prices and sensitivity to consumer pricing
Unprecedented cocoa price volatility poses the most significant threat to the stability of the Bean-to-Bar Chocolate Market. Prices fluctuated from USD 2,000 per ton in 2023 to peaks exceeding USD 12,000 in 2024, before declining by over 30% in early 2025[3]. This extreme volatility, driven by factors such as supply chain disruptions, weather conditions, geopolitical issues, and speculative trading in commodity markets, directly impacts production costs. Such fluctuations create uncertainty for manufacturers, making it challenging to plan long-term strategies and manage budgets effectively. Additionally, the rising costs are often passed on to consumers, which can lead to reduced demand, especially among price-sensitive segments. The premium nature of bean-to-bar chocolate further amplifies this issue, as consumers may opt for more affordable alternatives during periods of economic uncertainty. Such market dynamics make it difficult for manufacturers to maintain consistent profit margins while ensuring competitive pricing and catering to evolving consumer preferences.
Limitations of artisanal production scale
The limitations of artisanal production scale act as a significant restraint in the Bean-to-Bar Chocolate Market. Artisanal producers often operate on a small scale, which restricts their ability to meet growing consumer demand. This limited production capacity can lead to supply shortages, especially during peak demand periods. Additionally, the high costs associated with small-scale production, including sourcing premium-quality cocoa beans and maintaining traditional manufacturing processes, further constrain their scalability. These producers also face challenges in achieving economies of scale, which larger industrial manufacturers can leverage to reduce costs and improve profit margins. Furthermore, the lack of advanced machinery and technology in artisanal setups often results in longer production times and higher labor costs, impacting overall efficiency. As the market continues to grow, these limitations may hinder the ability of artisanal producers to compete effectively with larger players, thereby affecting their market share and growth potential. Moreover, artisanal producers frequently encounter difficulties in establishing a robust supply chain for high-quality cocoa beans, as they often rely on smallholder farmers who may face their own production constraints. This dependency can lead to inconsistencies in raw material availability and quality, further complicating production processes.
*Our forecasts treat driver/restraint impacts as directional, not additive. The impact forecasts reflect baseline growth, mix effects, and variable interactions.
Segment Analysis
By Product Type: Dark Chocolate Drives Premium Migration
Milk and white chocolate continue to dominate the bean-to-bar chocolate market, collectively maintaining the largest market share at 60.78% in 2025. The popularity of these chocolate varieties can be attributed to their widespread appeal and milder, sweeter taste profiles, which resonate strongly with a broad segment of consumers. These products are often favored for their creamy texture and versatility in both confectionery and cooking applications, making them staples in households and commercial establishments alike. The enduring popularity of milk and white chocolate also reflects their accessibility, as they are commonly available across varied price points and retail formats, ensuring broad market penetration. Brand loyalty and established consumer preferences continue to reinforce the dominance of these segments, especially in established markets. As a result, milk and white chocolates remain central to the revenue streams of leading bean-to-bar chocolate manufacturers.
In contrast, dark milk chocolate has emerged as the fastest-growing segment within the bean-to-bar chocolate market, projected to achieve a compound annual growth rate (CAGR) of 7.28% through 2031. This rapid growth reflects a shift in consumer attitudes toward more sophisticated and health-conscious chocolate options. Dark milk chocolate bridges the gap between traditional milk chocolate and rich dark chocolate, appealing to consumers who seek complex flavors with moderate sweetness and enhanced cacao content. The rise of this segment is fueled by increasing awareness of the potential health benefits associated with higher cocoa content, including antioxidant properties and reduced sugar intake. Artisanal chocolate makers are responding with innovative dark milk chocolate products that highlight single-origin cacao and unique production techniques. As consumers become more discerning and adventurous, the dark milk chocolate segment is poised to capture an expanding share of the premium and specialty chocolate market.

By Distribution Channel: Digital Commerce Transforms Access
Supermarkets and hypermarkets continue to be the dominant distribution channels in the bean-to-bar chocolate market, maintaining a substantial market share of 41.95% in 2025. Their strength lies in their wide accessibility, established infrastructure, and unparalleled reach to diverse consumer segments. These large-format retailers offer consumers the convenience of one-stop shopping, enabling them to access a broad range of premium and artisanal chocolates alongside everyday grocery items. In addition, supermarkets often provide ample shelf space and prominent visibility for bean-to-bar chocolate brands, enhancing both impulse and planned purchases. Their ability to run targeted promotions, offer discounts, and partner with chocolate manufacturers for in-store engagement further cements their importance in the market. As a result, supermarkets and hypermarkets continue to be the primary revenue channels for bean-to-bar chocolate producers and play a decisive role in market penetration.
Meanwhile, online retail is achieving the highest growth rate among all distribution channels, with an impressive CAGR of 7.78% through 2031. This rapid expansion reflects evolving consumer shopping behaviors that increasingly prioritize convenience, product variety, and direct engagement with brands. The digital marketplace allows consumers to explore a global assortment of bean-to-bar chocolates, including limited-edition or single-origin bars that may not be widely available in physical stores. Online platforms provide an ideal setting for small-scale chocolatiers and artisanal brands to share their stories and establish direct connections, fostering brand loyalty through personalized experiences. The rise of online retail is bolstered by advancements in e-commerce technologies, efficient delivery networks, and the growing popularity of direct-to-consumer sales models. As these trends intensify, online retail stands out as the fastest-growing channel, driving substantial transformation within the bean-to-bar chocolate market landscape.
Geography Analysis
In 2025, Europe solidifies its dominance in the Bean-to-Bar Chocolate market, holding a 31.02% share. This is largely due to the continent's discerning consumers and stringent sustainability regulations, which favor artisanal producers with transparent supply chains. The region's long-standing tradition of chocolate consumption, coupled with increasing awareness of ethical sourcing, has created a fertile ground for the growth of the bean-to-bar segment. The United Kingdom spearheads regional consumption, bolstered by rising imports of specialty cocoa and a surge in craft chocolate manufacturers catering to the refined local palate. The growing number of small-scale producers in the UK reflects a broader trend across Europe, where consumers are increasingly drawn to high-quality, handcrafted products. European consumers show a pronounced preference for organic and single-origin products, often paying a premium for those that emphasize environmental and social responsibility. Additionally, the region's regulatory environment, which prioritizes sustainability and transparency, has encouraged producers to adopt practices that align with these values, further strengthening the market.
Asia-Pacific is on a rapid ascent, projected to grow at a 7.32% CAGR through 2031, fueled by swift economic progress and a shift in consumer preferences towards premium, health-focused products. The region's expanding middle class, particularly in countries like China, India, and Japan, is driving demand for high-quality chocolate products. Rising disposable incomes and increased exposure to global food trends have led to a growing appreciation for artisanal and premium chocolates. Health-conscious consumers in the region are also gravitating toward products with natural ingredients and lower sugar content, creating opportunities for bean-to-bar producers to cater to these preferences. Furthermore, the region's younger demographic, with its openness to experimenting with new flavors and formats, is contributing to the market's rapid growth. The increasing presence of international and local players investing in the region further underscores its potential as a key growth driver in the global bean-to-bar chocolate market.
North America boasts a well-established craft chocolate infrastructure, bolstered by consumer education. This region is home to around 480 global specialty chocolate makers. The United States stands out with its robust consumption, thanks to direct-trade ties with cacao producers in Central and South America. These relationships foster transparent sourcing narratives, appealing to the region's conscious consumers. Meanwhile, Canada and Mexico play pivotal roles in regional growth, both in consumption and production. Notably, Mexico's rich cacao heritage lends authenticity to its bean-to-bar ventures. South America is carving a niche with its tree-to-bar operations, allowing cacao-producing nations to enhance their value chain margins through local processing and subsequent international export. In the Middle East and Africa, burgeoning economic development and urbanization are birthing new consumer segments. However, certain nations grapple with political instability and infrastructure challenges, tempering their growth potential.

Regulatory Landscape
Bean-to-bar chocolate operates within broader cocoa and chocolate food standards that cover composition and labeling, alongside growing sustainability and due-diligence expectations for traceable sourcing. In the United States, FDA standards of identity in 21 CFR Part 163 define cocoa products and set expectations for what can be labeled as chocolate, with FDA Compliance Policy Guidance (CPG) Sec. 515.800 addressing labeling products that purport to be chocolate or chocolate-flavored.
In Europe, EU Directive 2000/36/EC harmonizes composition and labeling rules for cocoa and chocolate products, which affects formulations and claims for premium bars sold across member states. Separately, the EU Deforestation Regulation (EUDR) (Regulation (EU) 2023/1115) introduces plot-level traceability and due diligence for commodities including cocoa. Regulation (EU) 2025/2650 amends the EUDR timeline, postponing application to 30 December 2026 for medium/large operators and 30 June 2027 for micro/small operators, shaping compliance roadmaps for both bean-to-bar brands and upstream partners.
Value Chain Analysis
The bean-to-bar value chain begins at origin with smallholder farmers and cooperatives producing flavor-grade cacao, where fermentation and drying practices materially influence final taste. Many bean-to-bar makers emphasize direct trade relationships to secure consistent quality and origin narratives, then move into specialty logistics, warehousing, and importing of cocoa beans into consumption markets. At the maker stage, core processing typically includes sorting, roasting, cracking and winnowing, grinding/refining, conching, tempering, molding, and packaging, with quality control and sensory evaluation acting as value-adding steps.
Downstream, distribution spans specialty and gourmet retail, supermarkets/hypermarkets for selected premium lines, and direct-to-consumer channels enabled by e-commerce. Traceability and documentation are becoming more embedded across the chain, particularly for EU-bound cocoa and chocolate, where EUDR requirements require operators to maintain geolocation-linked due diligence and supplier records. Industry transparency infrastructure also supports sourcing decisions, including support from bodies such as the International Cocoa Organization (ICCO), which maintains cocoa market statistics that feed procurement planning and risk management for micro-makers and larger specialty players.
Competitive Landscape
The Bean-to-Bar Chocolate market demonstrates moderate fragmentation, with a concentration score of 2. This score reflects the coexistence of well-established artisanal brands and emerging micro-producers. These players compete primarily through differentiation strategies rather than leveraging scale advantages. The market's competitive dynamics are shaped by the unique value propositions offered by these producers, which cater to a growing consumer demand for high-quality, ethically sourced, and premium chocolate products. Established artisanal brands in the market focus on maintaining their reputation by emphasizing craftsmanship, quality, and authenticity.
These companies often invest in direct-sourcing relationships with cocoa farmers, ensuring traceability and sustainability throughout the supply chain. By fostering such relationships, they not only secure high-quality raw materials but also build a compelling transparency narrative that resonates with ethically conscious consumers. This approach enables them to justify premium pricing and maintain a competitive edge over mass-market chocolate manufacturers. Additionally, these brands leverage their expertise in chocolate-making techniques and their ability to tell a compelling brand story, further solidifying their position in the market.
Emerging micro-producers, on the other hand, bring innovation and creativity to the market. These smaller players often experiment with unique flavors, limited-edition offerings, and locally sourced ingredients to differentiate themselves. Their agility allows them to quickly adapt to changing consumer preferences and trends. Despite their smaller scale, these producers leverage storytelling and branding to create a strong emotional connection with their target audience. Together, the established brands and micro-producers contribute to the dynamic and evolving nature of the Bean-to-Bar Chocolate market, driving competition and innovation within the industry.
Bean-to-Bar Chocolate Industry Leaders
-
Goodnow Farms
-
Maui Kuʻia Estate Chocolate
-
Raaka Chocolate Ltd
-
Salgado Chocolates
-
Askinosie Chocolate
- *Disclaimer: Major Players sorted in no particular order
Market Opportunities and Future Outlook
Compliance-driven traceability creates room for tools and service models that simplify origin documentation for small and mid-sized bean-to-bar players selling into Europe. With the EUDR application shifted to 30 December 2026 for medium/large operators and 30 June 2027 for micro/small operators under Regulation (EU) 2025/2650, exporters, importers, and specialty brands have a defined window to formalize geolocation capture, supplier onboarding, and due-diligence workflows. This supports demand for auditable sourcing programs that fit premium positioning.
Vertical integration and diversified origin sourcing also emerge as practical ways to manage quality and supply volatility in a premium category when cocoa prices swing sharply. Named bean-to-bar brands already use differentiated origin narratives and farm-linked models. For example, Maui Kuʻia Estate Chocolate highlights cacao origins through its estate-linked approach, while Goodnow Farms emphasizes cocoa sourcing transparency. These approaches translate into opportunities around single-origin portfolio expansion, regenerative or farm-resilience storytelling, and direct-to-consumer experiences that deepen brand loyalty while reducing exposure to intermediary markups.
Recent Industry Developments
- April 2026: Maui Kuʻia Estate Chocolate introduced a new Farm and Feast Experience built around its cacao farm tour format, pairing on-site farm engagement with dining in Lahaina. The focus is on experiential, direct-to-consumer touchpoints that help bean-to-bar brands communicate origin, craft, and pricing rationale in a high-involvement setting.
- January 2026: Maui Kuʻia Estate Chocolate launched a 65% dark chocolate product infused with locally grown Maui Lion's Mane mushroom. This extends product differentiation through functional and culinary ingredient innovation, supporting premiumization beyond single-origin messaging.
- June 2024: Raaka Chocolate reintroduced a collection of six limited-edition bars under its First Nibs series with unusual flavor pairings such as porcini mushroom and cranberry pink peppercorn. Limited runs like these reinforce the category's craft credentials and help micro-producers maintain consumer engagement through novelty and seasonal rotation.
Research Methodology Framework and Report Scope
Market Definition and Coverage
This market covers chocolate products that are positioned and sold as bean to bar. Makers manage key steps from sourcing cocoa beans through roasting, grinding, and molding, and revenue is counted at the point of sale across retail and foodservice.
Scope exclusions: We exclude cocoa beans, cocoa liquor, cocoa butter, cocoa powder, and industrial chocolate made for further processing unless it is sold as a finished bean-to-bar product.
Segmentation Overview
- By Product Type
- Dark Chocolate
- Milk/White Chocolate
- By Distribution Channel
- Supermarkets/Hypermarkets
- Specialty and Gourmet Stores
- Online Retail
- Other Distribution Channels
- By Geography
- North America
- United States
- Canada
- Mexico
- Rest of North America
- Europe
- Germany
- United Kingdom
- France
- Italy
- Spain
- Netherlands
- Sweden
- Poland
- Belgium
- Rest of Europe
- Asia-Pacific
- China
- India
- Japan
- Australia
- South Korea
- Rest of Asia-Pacific
- South America
- Brazil
- Argentina
- Rest of South America
- Middle East and Africa
- United Arab Emirates
- South Africa
- Saudi Arabia
- Rest of Middle East and Africa
- North America
Data Sources, Market Sizing, and Validation
Desk Research
Desk research starts with building a clear demand picture for premium and craft chocolate, then narrowing it to the bean to bar portion using observable signals. We used public sources such as UN Comtrade trade statistics (HS 1806), USDA and ICCO cocoa supply indicators, and FAOSTAT agriculture series to understand cocoa availability and price pressure that feeds into chocolate retail pricing.
To ground the downstream view, we also reviewed sources such as USITC data for key importing markets, Eurostat trade and consumption indicators, and consumer price inflation series from central banks or national statistics offices to separate value growth from pure volume shifts. Company annual reports, investor decks, retailer announcements, and credible press were used to identify product positioning, pack sizes, and typical pricing ladders for craft bars. Where needed, paid subscriptions for company financial intelligence, news and financials, patent databases, and import or export shipment-level records were referenced to fill gaps around distribution reach and product claims. These desk sources are not exhaustive, and we checked additional public documents to cross-check figures and clarify assumptions.
Primary Interviews and Surveys
Primary work was used to translate the premium chocolate universe into a practical bean to bar demand pool, and then to test our price and channel assumptions. We spoke with manufacturers, specialty retail and distributors, and informed observers such as category buyers and industry advisors, covering the major consuming regions so regional channel mix and pricing differences were not averaged away.
Distribution of primary research fieldwork respondents
| Company type | Respondent position | Region |
|---|---|---|
| Top tier: 28% | CXOs: 15% | APAC: 41% |
| Mid tier: 57% | Functional/Unit leaders: 29% | EMEA: 34% |
| Smaller Players: 15% | Managers: 56% | Americas: 25% |
Market-Sizing & Forecasting
Sizing uses a top-down and bottom-up approach. We reconstruct premium chocolate demand by region using trade, consumption, and price series, then filter by the share that is marketed and purchased as bean to bar. For the bottom-up cross-check, we built selective roll ups from sampled brand and store pricing, typical pack sizes, and estimated throughput across specialty channels, then adjusted totals when the top-down view looked too optimistic or too thin.
In this market, a few inputs drive sensitivity, so we handled them carefully and refreshed them during the build. These include cocoa price and availability signals (which influence retail price points and promotional depth), premium chocolate penetration in modern trade versus specialty stores, average selling price progression for craft bars by pack size, online versus offline channel mix, and the pace of new craft maker launches and distribution expansion. Where direct volume data is limited, we filled gaps using channel proxies such as the number of specialty doors carrying bean to bar ranges, normalized basket prices, and regional premiumization trends shared by interviewees.
Forecasting was run using scenario analysis, since cocoa cost cycles and consumer trade-down risk can change the value trajectory even when category interest holds up. The base case assumes steady premiumization and gradual channel expansion. Upside and downside cases were built around cocoa price pass-through timing, discretionary spending sensitivity, and the speed of online shelf growth, using signals discussed in expert interviews.
Data Validation & Update Cycle
Validation happens in layers so a weak input does not steer the final number. Model outputs are compared against independent signals such as cocoa grind trends, HS 1806 value movement, and observed retail price bands for craft bars, and outliers are rechecked before sign-off.
If a region shows growth that does not match its trade, pricing, or channel expansion indicators, we revisit assumptions and re-contact sources to confirm what changed, for example a sudden distribution win or a cocoa cost spike. Reports are refreshed annually, with interim updates when a material event shifts prices, supply, or consumer demand. Before delivery, the analyst team performs a fresh pass on key inputs so the numbers reflect the latest available signals.
Mordor Intelligence's Bean to Bar Chocolate Market Size Compared Against Other Published Estimates
Published values for bean to bar chocolate can vary because the category label is used loosely, and not every publisher draws the line in the same place across channels and product positioning. Differences typically come from what gets counted as bean to bar, which geographies are covered, and how cocoa-related price changes are converted into market value.
A main gap comes from whether premium artisanal chocolate that is not strictly controlled from bean sourcing through making is included. In Mordor Intelligence's model, we count only products explicitly positioned and sold as bean to bar across the tracked channels, which keeps adjacent craft and premium chocolate from inflating totals.
Benchmark comparison
| Source | Market Size | Gaps in Research Methodology |
|---|---|---|
| Mordor Intelligence | USD 4.65 B (2026) | |
| Trade Journal A | USD 1.80 B (2025) | Uses a narrower interpretation closer to craft chocolate makers only, and often misses mainstream retail presence, while also applying simplified pricing that does not fully reflect cocoa-driven ASP changes. |
| Industry Portal B | USD 24.02 B (2025) | Appears to bundle a wider premium chocolate universe into bean to bar, which can pull in conventional premium bars and broader confectionery value without a clear verification step for bean-to-bar positioning. |
The spread in the table is largely explained by how strictly the label is applied and how price and channel coverage are handled. By keeping scope tied to observable product positioning and validating price ladders and channel mix through interviews, the estimate stays traceable to repeatable steps rather than broad premium chocolate assumptions.
Key Questions Answered in the Report
What is the current value of the Bean-to-Bar chocolate market?
The Bean-to-Bar chocolate market size is USD 4.65 billion in 2026.
How fast is the market expected to grow through 2031?
It is forecast to post a 7.14% CAGR and reach USD 6.56 billion by 2031.
Which region is expanding quickest?
Asia-Pacific records the fastest 7.32% CAGR due to rising incomes and premiumization.
Which product segment is gaining momentum?
Dark Milk Chocolate leads growth with a 7.28% CAGR as consumers shift toward higher cocoa content.
How are cocoa-price swings affecting producers?
Volatile prices squeeze margins for small makers, causing some to reduce volumes or exit despite stable demand.