
Battery Testing And Inspection Equipment Market Size and Share
Market Overview
| Study Period | 2021 - 2031 |
|---|---|
| Market Size (2026) | USD 632.75 Million |
| Market Size (2031) | USD 864.02 Million |
| Growth Rate (2026 - 2031) | 6.43% CAGR |
| Fastest Growing Market | Asia-Pacific |
| Largest Market | Asia-Pacific |
| Market Concentration | Medium |
Major Players *Disclaimer: Major Players sorted in no particular order Image © Mordor Intelligence. Reuse requires attribution under CC BY 4.0. | |
Battery Testing And Inspection Equipment Market Analysis by Mordor Intelligence
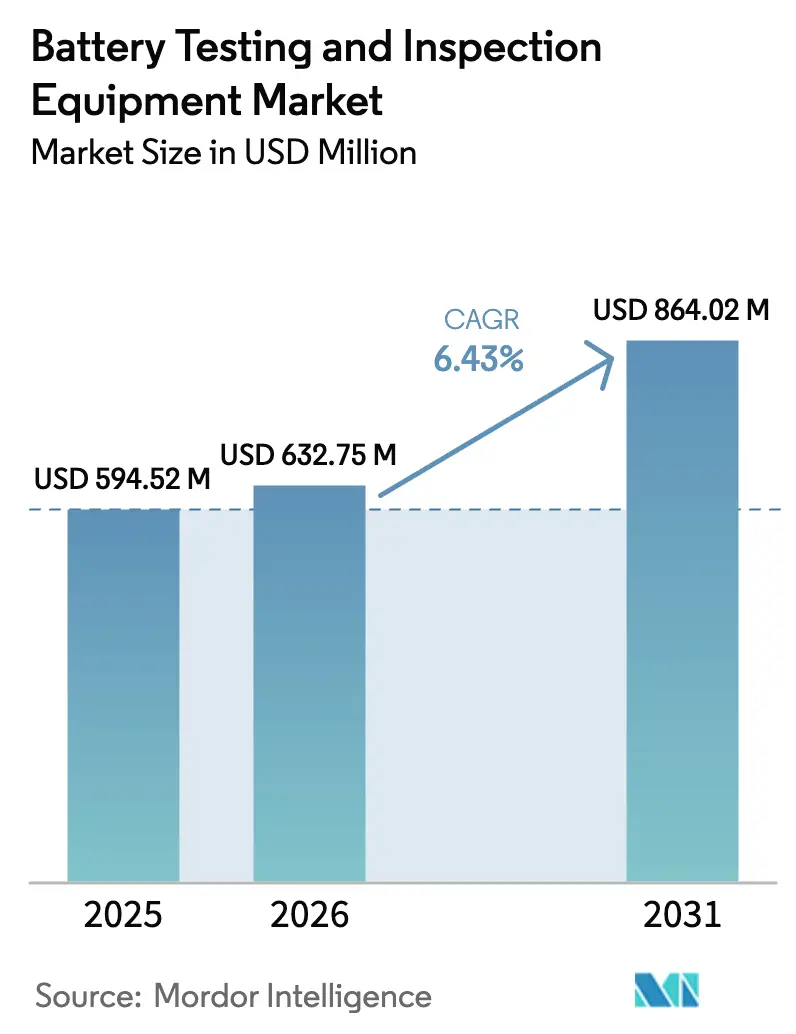
The Battery testing & inspection equipment market size is expected to grow from USD 594.52 million in 2025 to USD 632.75 million in 2026 and is forecast to reach USD 864.02 million by 2031 at 6.43% CAGR over 2026-2031. The upward trajectory of the Battery testing & inspection equipment market reflects converging safety regulations, the scale-up of gigafactories, and the rapid commercialization of next-generation chemistries. UNECE R100 Rev. 4, FMVSS 305a, and China’s GB38031-2025 collectively extend testing scope from cell abuse to full-pack thermal-propagation analysis, creating demand for multi-parameter platforms that combine electrical, mechanical, and environmental stress testing.[1]United Nations, “Battery Testing in Accordance with UN Regulation 100 Rev. 3,” revivebatts.com Asia-Pacific leads procurement as regional firms bring more than 250 GWh of fresh capacity online between 2025-2027, while Europe’s battery-passport mandate shifts customer preferences toward testers with embedded traceability functions.[2]Battery Pass consortium, “Content Guidance for the EU Battery Passport,” thebatterypass.euSystem vendors differentiate by integrating electrochemical-impedance-spectroscopy (EIS) modules derived from automotive BMS technology, transforming test labs into data-rich hubs that feed real-time health metrics back to design teams.
Key Report Takeaways
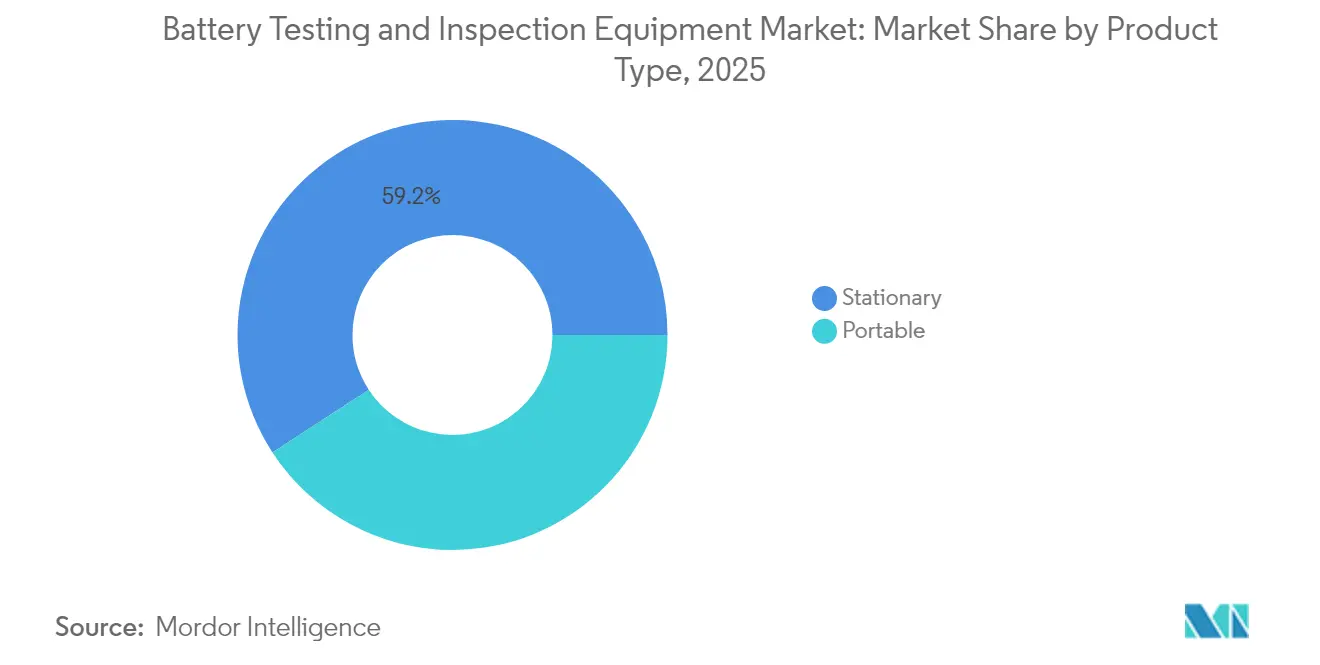
- By product type, stationary systems retained 59.20% revenue share of the Battery testing & inspection equipment market in 2025, while portable platforms are forecast to expand at an 8.35% CAGR to 2031.
- By application, pack-level testers captured 45.40% of the Battery testing & inspection equipment market size in 2025 and are projected to grow at 7.18% CAGR.
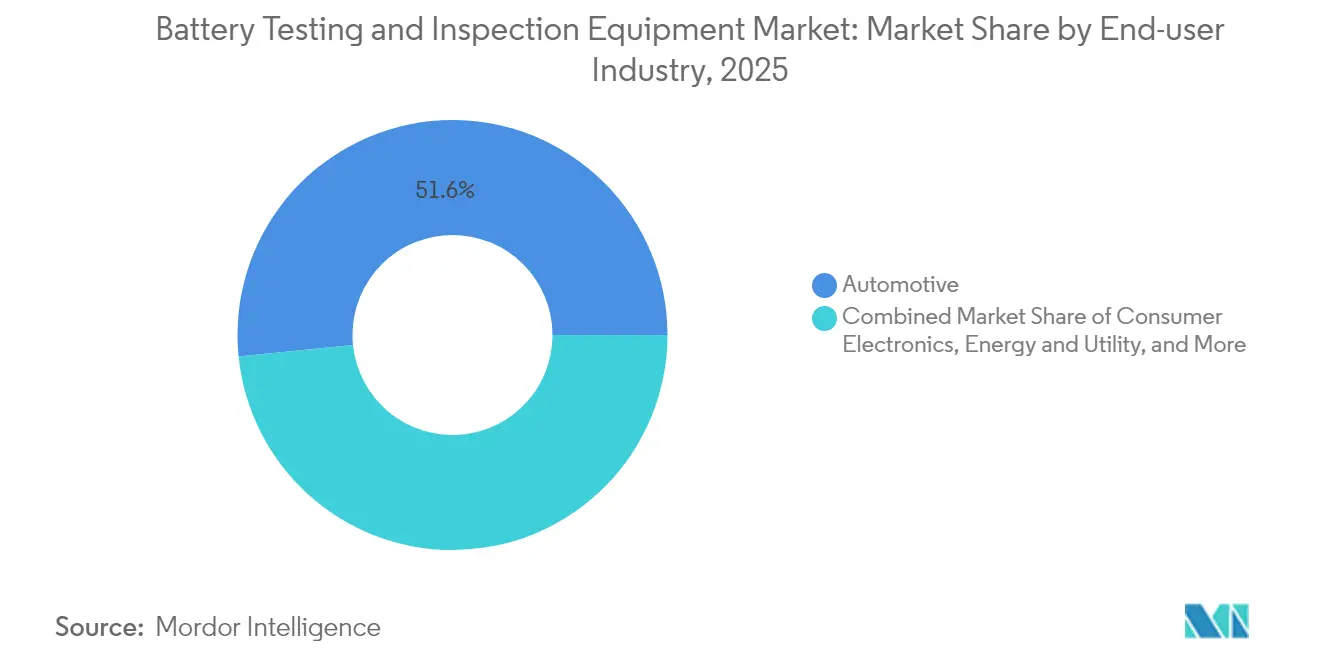
- By end-user, the automotive sector held 51.60% Battery testing & inspection equipment market share in 2025, whereas the energy-and-utility segment records the fastest 7.05% CAGR through 2031.
- By chemistry, lithium-ion commanded 80.30% share of the Battery testing & inspection equipment market size in 2025; solid-state testers deliver the highest 7.29% CAGR.
- By geography, Asia-Pacific led with 44.80% revenue share in 2025; North America is strengthening capacity behind new FMVSS 305a rules at a robust pace.
- BioLogic, Hioki and National Instruments together accounted for 18% share of global installed channels in 2024, underscoring an unconcentrated playing field.
Note: Market size and forecast figures in this report are generated using Mordor Intelligence’s proprietary estimation framework, updated with the latest available data and insights as of 2026.
Global Battery Testing And Inspection Equipment Market Trends and Insights
Drivers Impact Analysis*
| Driver | (~) % Impact on CAGR Forecast | Geographic Relevance | Impact Timeline |
|---|---|---|---|
| EV crash-safe regulations tighten (UNECE-R100 Rev. 4) | +1.2% | Global with EU & North America lead | Medium term (2-4 years) |
| Surge in gigafactory commissioning (≥250 GWh 2025-27) | +1.8% | APAC core, spill-over to NA & EU | Short term (≤ 2 years) |
| Adoption of “battery passport” in EU | +0.9% | Primarily EU | Medium term (2-4 years) |
| Embedded EIS analytics in testers | +1.1% | Worldwide, automotive first mover | Long term (≥ 4 years) |
| Solid-state pilot lines need high-voltage rigs | +0.7% | APAC & North America | Long term (≥ 4 years) |
| Second-life mandates require pack screening | +0.6% | EU & North America | Medium term (2-4 years) |
| Source: Mordor Intelligence | |||
EV crash-safe regulations tighten (UNECE-R100 Rev. 4)
Global roll-out of UNECE-R100 Rev. 4 obliges every electric-vehicle battery to pass thermal-shock, mechanical deformation, and fire-exposure protocols, elevating hardware specifications across the Battery testing & inspection equipment market. Test benches must log simultaneous voltage, temperature, and pressure signals under sub-second synchronization, prompting labs to invest in high-speed DAQ systems with optical-fiber networking. The rule pushes buyers toward turnkey rigs that incorporate thermal-propagation chambers, thereby converting single-purpose cycler budgets into multi-discipline capital projects
Surge in gigafactory commissioning (≥250 GWh added 2025-27)
Proliferation of gigafactories accelerates volume purchasing of channel-dense cyclers that validate thousands of cells in parallel. BMW’s Wackersdorf center, a EUR 100 million (USD 109 million) flagship, demonstrates how automakers internalize testing to compress design-to-launch cycles.[3]BMW Group, “Green light for Wackersdorf battery testing centre,” press.bmwgroup.comVendors supplying modular, rack-mountable cyclers gain a logistical edge as facility managers replicate identical blocks line after line.
Adoption of “battery passport” in EU 2024/2025
The passport forces each production lot to carry traceable performance, carbon-footprint and recycled-content data, migrating compliance tasks from spreadsheets to tester firmware. Instruments that auto-export secure JSON files to blockchain ledgers become procurement favorites among European OEMs.
Integration of embedded EIS analytics in testers
EIS modules shrink into plug-in cards, letting pack cyclers deliver impedance spectra every cycle without halting the charge-discharge loop. Real-time detection of lithium plating or SEI build-up shifts maintenance from reactive pack recalls to predictive interventions.
Restraints Impact Analysis*
| Restraint | (~) % Impact on CAGR Forecast | Geographic Relevance | Impact Timeline |
|---|---|---|---|
| High-current cycler cap-ex inflation (Cu & Si costs) | -0.8% | Global with NA & EU acute | Short term (≤ 2 years) |
| Restricted lab talent & safety-certified facilities | -0.5% | North America & Europe | Medium term (2-4 years) |
| Source: Mordor Intelligence | |||
High-current cycler cap-ex inflation (Cu & Si costs)
Copper busbars and silicon carbide MOSFETs, critical to 1,000-A testers, face 2025 commodity spikes, inflating unit prices. Some U.S. labs postpone upgrades, raising utilization rates on legacy racks. Vendors respond with leasing models that spread cap-ex pain over five-year OPEX horizons.
Restricted lab talent & safety-certified facilities
Battery test chambers handling runaway events above 3 MJ require ISO 17025 accreditation and fire-suppression retrofits that smaller firms struggle to fund. The resulting scarcity of certified slots slows validation timelines for start-ups, marginally curbing orders for additional equipment in North America and Europe.
*Our forecasts treat driver/restraint impacts as directional, not additive. The impact forecasts reflect baseline growth, mix effects, and variable interactions.
Segment Analysis
By Product Type: Stationary dominance with portable acceleration
Stationary systems generated 59.20% of 2025 revenue within the Battery testing & inspection equipment market, a lead upheld by stringent abuse-test protocols that demand inert-gas chambers and explosion vents. Portable testers, though small, post an 8.35% CAGR as utilities deploy field-grade analyzers to screen repurposed EV packs on site. Portable rigs often piggyback on standard 19-inch rack controllers so spare parts stay common across both fleets. Stationary lines migrate toward robot-loaded trays to offset labor scarcity, a shift that magnifies software integration expenditures above hardware costs.
In the second half of the decade, the Battery testing & inspection equipment market size for portable units is projected to top USD 389.6 million, reflecting new inspection mandates for residential-storage packs. Automation vendors partner with cycler OEMs to embed robotic arms that swap trays every 10 minutes, trimming cycle-time variance across shifts. Stationary labs, in contrast, focus on high-current headroom; 1 MW DC channels enable simultaneous testing of eight 130 kWh bus packs, aligning with FMVSS 305a soak-test requirements.


By Application Type: Pack-level validation leads integration push
Pack testers held a 45.40% share of the Battery testing & inspection equipment market size in 2025, as automakers prioritize end-system integrity over isolated cell metrics. Heat-shrink ovens, crush plates, and vibration tables integrate into single lines so engineers run mechanical and electrical tests without repalletizing. Module-level rigs remain relevant for mid-stream quality gates inside gigafactories, while cell cyclers underpin supplier qualification.
Pack-level dominance intensifies as regulators demand whole-pack safety data for type approval. Embedded EIS sensors in harness wiring shortcut diagnostics during endurance cycles, raising ASPs per channel. Module testers evolve into hybrid rigs that toggle between CC-CV cycling and 30 Hz impedance sweeps, thereby extending utility into R&D labs seeking flexible assets.
By End-user Industry: Automotive leads while grid storage surges
Automotive OEMs purchased more than half of all channels shipped in 2025, locking down 51.60% Battery testing & inspection equipment market share. Their demand profile emphasizes fast-ramp construction schedules and 24/7 automation. Energy-and-utility buyers, however, post the briskest 7.05% CAGR. Long-duration storage finalists in U.S. Department of Energy solicitations must experimentally validate 6,000-cycle life at 100% depth of discharge, a test that ties up cyclers for 18 months.
Telecom back-up modules, medical-device packs, and aerospace batteries round out the customer mix, driving niche testers certified for RTCA DO-160 thermal-altitude profiles. Oil-and-gas robotics batteries create micro-opportunities for high-pressure submersible chambers.
By Battery Chemistry: Lithium-ion dominance with solid-state momentum
Lithium-ion retained 80.30% share in 2025, yet vendors already quote 850 V solid-state platforms for pilot lines slated to open in 2027. These units replace liquid-cooling loops with dielectric-fluid sprays to evacuate heat from densified ceramic stacks. Lead-acid persists in telecom UPS niches that require cold-crank metrics, while nickel-metal hydride rides on hybrid-bus retrofits in Japan.
The Battery testing & inspection equipment market anticipates dual-chemistry labs where software auto-detects cell type and switches compliance scripts. Fraunhofer ISI projects solid-state production at scale from 2030, and early validation contracts drive instrument revenue.
Geography Analysis
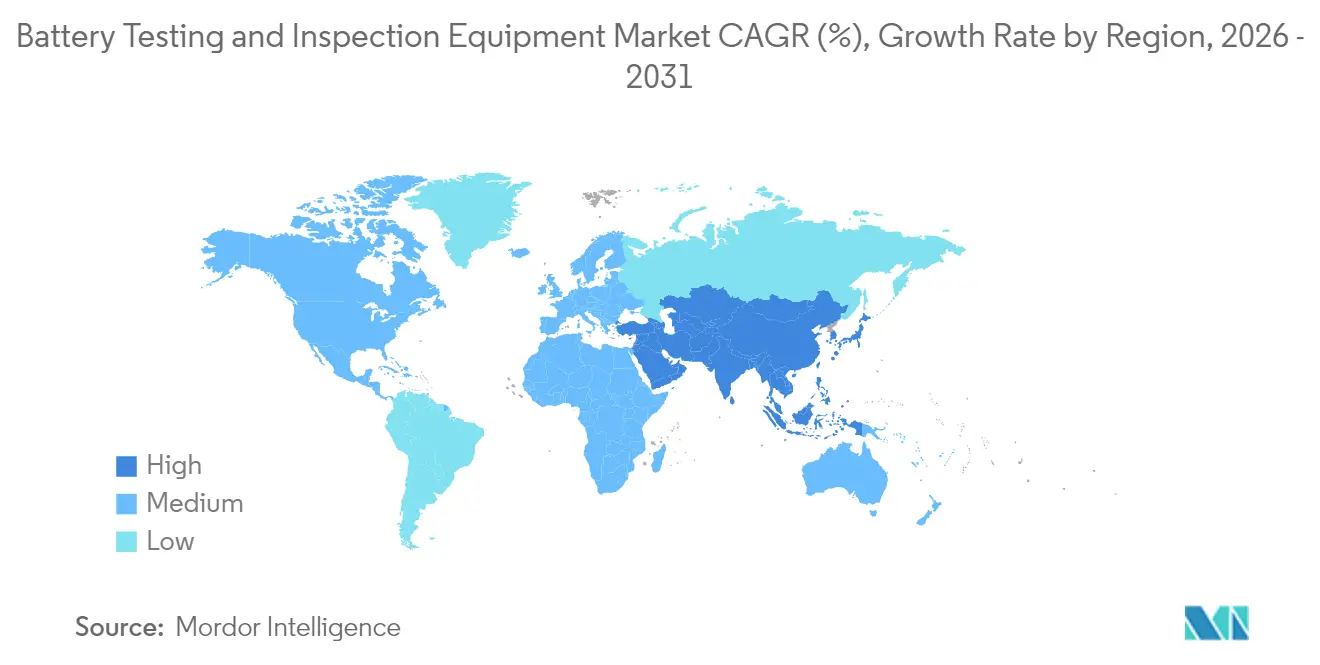
Asia-Pacific remains the epicenter of the Battery testing & inspection equipment market with a 44.80% share in 2025, driven by concentrated cell manufacturing clusters in China, South Korea, and Japan. Chinese integrators such as Xian Dao Intelligent deliver turnkey pack cyclers with 98% domestic parts content, aligning with Beijing’s localization push. Government subsidies in the Yangtze River Delta finance lab expansions inside regional innovation parks, accelerating orders for environmental chambers and high-speed DAQ boards. India’s PLI scheme for advanced-chemistry cells fosters a nascent market built around sub-100 kWh telecom and two-wheeler batteries, broadening the vendor base.
North America registers double-digit shipment growth as automakers localize supply chains to qualify for clean-vehicle tax credits. The Battery testing & inspection equipment market size for U.S. and Canadian buyers will reach USD 223.4 million by 2031, lifted by gigafactory hubs in the Southeast. UL Solutions’ Michigan laboratory serves as a regional reference site for FMVSS 305a readiness, and its open-access model lets Tier 2 suppliers verify modules without building in-house facilities. Canadian miners exploring sodium-ion cathodes partner with university labs to co-develop test scripts targeting sub-zero cycle life.
Europe concentrates on purchasing around compliance with Regulation (EU) 2023/1542. German OEMs demand instruments that auto-calculate carbon intensity per cycle and push encrypted data to cloud dashboards, turning testers into traceability nodes. The Battery testing & inspection equipment market share for EU-27 is expected to stay near 22.90% through 2031 as local manufacturers integrate solid-state pilot lines. Poland and Hungary emerge as cost-competitive lab-services hubs, offering third-party certification to smaller e-mobility start-ups.

Regulatory Landscape
Regulatory pressure is widening the testing scope from cell-level checks to full-pack validation. UNECE-R100 Rev. 4 and the EU Battery Regulation 2023/1542 support traceability, safety testing, and pack-level data capture, while FMVSS 305a was finalized in December 2024, raising the bar for system-level safety verification in the United States. ANSI/CAN/UL 9540A:2025 also formalizes thermal propagation test methodologies for stationary storage systems, extending compliance expectations into grid-scale deployments.
International harmonization is progressing with IEC 62660-3:2026, published May 27, 2026, which aligns safety testing across major regions and supports standardized data export for battery passport reporting. Cross-border requirements such as UN38.3 transport and IEC 62133/62619 for portable and stationary batteries continue to shape stringent test regimes and data integrity expectations throughout the supply chain.
Value Chain Analysis
The value chain starts with upstream inputs including power semiconductors, high-current DC power modules, precision sensors, and thermal management hardware. System integrators and OEMs then assemble cyclers, data acquisition (DAQ), safety interlocks, and environmental chambers into pack-test platforms. Software and metrology layers connect the hardware into scalable operations, including platforms such as Arbin MITS 11 that orchestrate parallel tasks and sub-second synchronization.
Downstream labs and OEM validation centers convert international standards into test plans, capturing results for secure datasets used in regulatory reporting and battery passport programs. Calibration and measurement improvements, including Hioki advances in 2026, plus embedded EIS analytics in testers, are used to increase fidelity and maintain cross-system traceability across the value chain.
Competitive Landscape
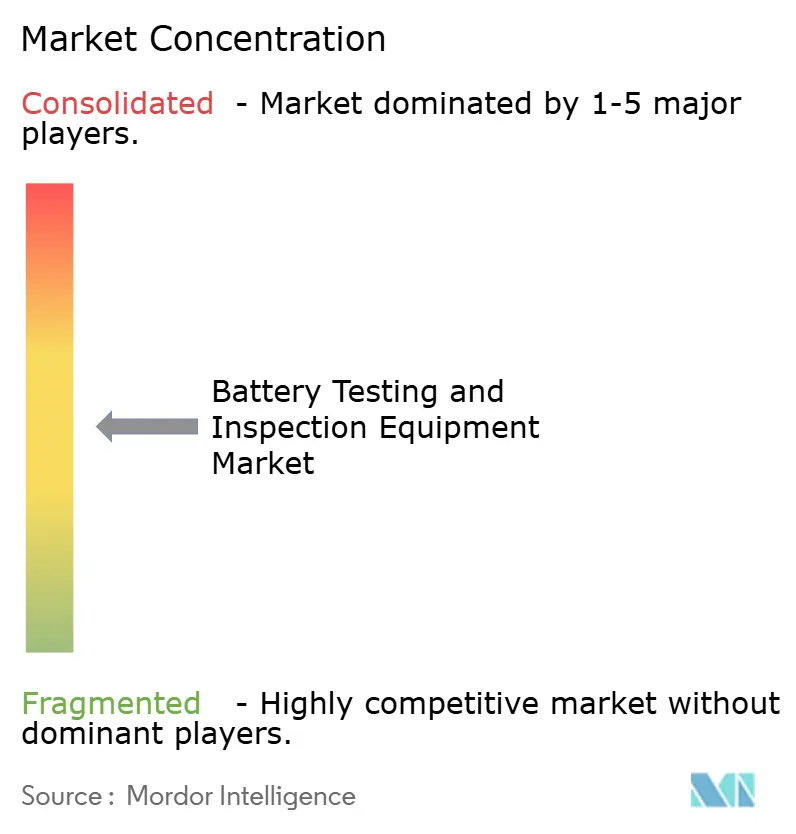
The Battery testing & inspection equipment market displays moderate fragmentation: the top five players command roughly 35% of installed global channel capacity. Multinationals such as BioLogic, Hioki, and Chroma pursue platform breadth, bundling cyclers with impedance analyzers and climate chambers in single purchase frameworks. BioLogic’s 2024 launch of the BCS-900 added 10 A/6 V modules optimized for research benches, yet its scalable backplane caters to high-volume pack lines, illustrating a multi-segment strategy. Hioki leverages proprietary four-terminal sensing to cut lead loss errors below 5 µΩ, appealing to solid-state developers who evaluate dendrite growth at high frequencies.
New entrants emphasize software as a differentiator. Californian start-up ReJoule embeds machine-learning models inside portable graders that predict SOH within 3 minutes, reducing screening costs for second-life operators. Asian robotics integrators bolt collaborative arms onto cyclers, automating pouch-cell insertion and thermocouple placement, thus lowering labor intensity. Strategic alliances grow: Chroma partners with AVL to co-market powertrain-test rigs, while National Instruments aligns its PXI instrumentation with power-rack OEMs, targeting open-architecture buyers.
Patent analysis highlights a shift toward on-board impedance measurement; Lithium Balance patents covering real-time EIS in BMS narrow options for latecomers. Suppliers respond by negotiating cross-licenses or investing in galvanostatic EIS alternatives. As solid-state pilot lines multiply, specialty vendors offering 10 kV isolation testers gain mindshare. Meanwhile, price competition intensifies in commodity cell-cycler SKUs, prompting tier-one brands to bundle condition-based maintenance services that lock in annuity revenue.
Battery Testing And Inspection Equipment Industry Leaders
Arbin Instruments
Hioki USA
Neware Battery Testers
Keysight Technologies
Chroma Systems Solutions, Inc.
- *Disclaimer: Major Players sorted in no particular order

Market Opportunities and Future Outlook
There is an opening for pack-to-system validation in high-voltage architectures, particularly where buyers need high-power validation up to 1,500 V and 1,500 A and integrated workflows that combine regenerative cycling, high-speed DAQ, and safety instrumentation within a single bench. This direction aligns with buyer attention on high-power battery testing platforms and turnkey, multi-parameter rigs.
EU and US policy dynamics are also tightening the requirements for battery passport capability and secure data export. As the EU Battery Regulation pushes traceability and carbon-footprint reporting, and IEC 62660-3:2026 harmonizes safety testing across major regions, gigafactory expansions and subsidy programs in North America and Europe are increasing demand for test platforms that can support embedded traceability, auditable data, and rapid configuration for new chemistries and pilot lines.
Recent Industry Developments
- June 2026: The launch provides direct EV safety testing capability for high-voltage packs. This accelerates safety-validation throughput for automotive applications and supports regulatory-grade testing workflows.
- June 2026: The new probes deliver high-frequency, large-current measurements for battery test rigs. This improves measurement precision in fast EIS testing on packs and cells and expands lab-to-line transferability.
- May 2026: Arbin Instruments launched a high-precision battery tester with an integrated environmental chamber designed for R&D and quality validation. The development supports end-to-end testing workflows and enables faster qualification of new chemistries and formats.


Research Methodology Framework and Report Scope
Market Definition and Coverage
This market covers equipment used to test and inspect batteries across development, production, and quality stages, including systems that check electrical performance, safety behavior, and visible or internal defects before batteries move to end use.
Scope exclusions: This sizing excludes outsourced testing and inspection services, general lab consumables, and broader factory automation hardware that is not purpose-built for battery test or inspection tasks.
Segmentation Overview
- By Product Type
- Portable
- Stationary
- By Application Type
- Cell Testing Equipment
- Module Testing Equipment
- Pack Testing Equipment
- By End-user Industry
- Automotive
- Consumer Electronics
- Energy and Utility
- Telecom and Data Communication
- Healthcare
- Aerospace and Defence
- Oil and Gas
- Factory Automation and Industrial Equipment
- By Battery Chemistry
- Lithium-ion
- Lead-acid
- Nickel-based
- Solid-state / Next-Gen
- By Geography
- North America
- United States
- Canada
- Mexico
- South America
- Brazil
- Argentina
- Rest of South America
- Europe
- United Kingdom
- Germany
- France
- Italy
- Spain
- Russia
- Rest of Europe
- APAC
- China
- Japan
- South Korea
- India
- Australia
- Rest of APAC
- Middle East and Africa
- GCC
- South Africa
- Rest of Middle East and Africa
- North America
Data Sources, Market Sizing, and Validation
Desk Research
Desk work starts by grounding demand in public signals that are stable over time, which helps keep the model anchored. We reviewed battery safety and compliance references and related technical publications, and we also used public statistics for industry output where available. Helpful sources include UN and UNECE regulatory documentation for battery transport and safety, NHTSA rulemaking and notices in the US, standards and technical updates published by IEEE and SAE, and customs and trade statistics from UN Comtrade for relevant equipment movements.
On the supply side, we used company filings, annual reports, and investor decks to understand product mix and where revenue is coming from, followed by press releases and association websites for capacity expansion cues. Paid subscriptions were used selectively for company financials and intelligence, patent database checks, and shipment level import and export views when public data did not get granular enough. The sources mentioned here are illustrative rather than exhaustive, and additional public and paid references were also used to collect data, validate it, and clear up open questions.
Primary Interviews and Surveys
Primary work was used to pressure-test what desk research could not confirm cleanly, especially how equipment categories are bundled, typical pricing movement, and what share of demand is tied to new lines versus upgrades. We spoke with a mix of equipment suppliers, integrators, component specialists, and end users running battery R&D labs and manufacturing sites, and then the feedback was used to align definitions and reality-check the final model across major regions.
Distribution of primary research fieldwork respondents
| Company type | Respondent position | Region |
|---|---|---|
| Top tier: 31% | CXOs: 13% | APAC: 40% |
| Mid tier: 50% | Functional/Unit leaders: 33% | EMEA: 33% |
| Smaller Players: 19% | Managers: 54% | Americas: 27% |
Market-Sizing & Forecasting
Sizing starts with a top-down build where battery production expansion and compliance-driven testing needs are translated into equipment demand pools, and then mapped to the types of testing and inspection required across the battery life cycle. Once that structure is set, selective bottom-up checks are used to keep totals realistic, such as sampled supplier revenue splits, typical system pricing multiplied by observed installation volumes, and channel conversations on backlog patterns.
Key inputs used in the model include the pace of battery cell and pack capacity additions, the mix shift toward higher energy chemistries that often need longer validation, and the tightening of safety and thermal-propagation testing expectations that changes how much equipment is purchased per line. We also track utilization patterns between lab scale and production scale, typical replacement cycles for chambers and cyclers, and the degree to which inspection is embedded in-line versus handled at dedicated stations. When product revenue is bundled, gaps are handled by splitting totals using interview-validated allocation keys and then cross-checking against what end users describe as must-have test coverage.
For forecasting, scenario analysis is applied to a base case that ties equipment spending to capacity rollout timing and regulation-led test coverage, followed by a sensitivity pass on pricing and lead times. Forecast assumptions are reviewed with industry specialists so the growth path reflects real commissioning cycles rather than smooth calendar-based growth.
Data Validation & Update Cycle
Validation is done through several checks so the model does not drift from real market signals. We compare outputs against independent indicators like battery capacity announcements, regulatory testing changes, and the observed cadence of new lab and factory commissioning, and then we investigate any large variances by geography or equipment type. Where something looks off, follow-up calls are triggered to re-check definitions, bundling practices, and the timing of major purchase orders.
Before sign-off, numbers are reviewed in steps by analysts to confirm arithmetic accuracy, assumption consistency, and that the story matches the data. Reports are refreshed annually, and interim updates are made when material events change demand or pricing. Right before delivery, a fresh review pass is completed so clients receive the latest updated view.
Mordor Intelligence's Battery Testing and Inspection Equipment Market Size Versus Other Published Estimates
Published market values for battery testing and inspection equipment can look different because the product scope is not always set the same way, and because some models treat lab-only systems and production-line systems as one pool. Differences also show up when one estimate ties demand mainly to EV production headlines, while another ties it to installed cell capacity and the required safety test coverage.
The main gap drivers here are whether adjacent items like outsourced testing services or broader lab infrastructure are counted, and how pricing is updated when high-spec chambers and multi-channel cyclers shift in mix. Another driver is timing, since the base year, currency conversion point, and whether mid-year regulatory changes are reflected can move the current-year number meaningfully.
Benchmark comparison
| Source | Market Size | Gaps in Research Methodology |
|---|---|---|
| Mordor Intelligence | USD 594.52 M (2025) | |
| Regional Consultancy A | USD 1.20 B (2024) | This figure appears to fold in outsourced testing and inspection services and broader lab infrastructure spend, and it also uses an earlier base year that can inflate the snapshot when later pricing normalization is not applied. |
| Trade Journal B | USD 634.31 M (2025) | This estimate seems to apply a simpler growth extension from a prior base and gives less clarity on whether inline inspection hardware is included, which can lift totals in years when new production lines are being commissioned. |
The spread in the table is mostly explained by what gets counted as equipment versus services, and whether inspection is limited to battery-specific stations or widened to general automation. By keeping outsourced testing services outside the market total and re-checking mix-driven pricing shifts for cyclers, chambers, and inspection rigs during updates, the published number stays tied to repeatable inputs, which is the method used by Mordor Intelligence.


Key Questions Answered in the Report
What is driving growth in the Battery testing & inspection equipment market?
Tighter global safety regulations, rapid gigafactory build-outs and the EU battery-passport mandate collectively lift demand for advanced multi-parameter test platforms.
Which region buys the most testing equipment today?
Asia-Pacific accounts for 44.80% of 2025 revenue thanks to China’s dominant cell-manufacturing base and aggressive storage deployments.
How fast is portable battery test equipment growing?
Portable systems log an 8.35% CAGR through 2031 as utilities and second-life operators need field-ready graders.
Why is pack-level testing gaining share?
Regulators require system-level safety validation, and OEMs want integrated thermal-propagation and BMS diagnostics, bringing pack testers to 45.40% market share in 2025.
Will solid-state batteries change equipment demand?
Yes, pilot lines need 10 kV isolation and ceramic-interface diagnostics, pushing vendors to launch new high-voltage cyclers and impedance analyzers.
How fragmented is the competitive landscape?
With the top five firms holding about 35% of global capacity, competition hinges on software and analytics capabilities rather than sheer scale.
Page last updated on:






