
Market Overview
| Study Period | 2020 - 2031 |
|---|---|
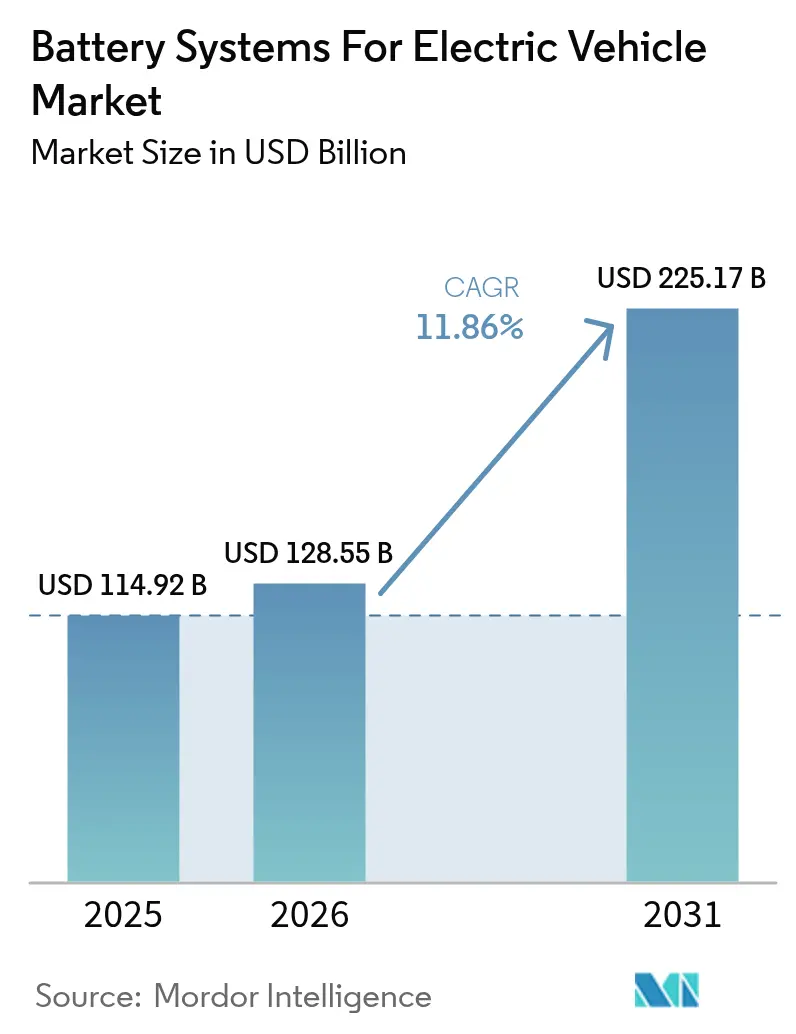
| Market Size (2026) | USD 128.55 Billion |
| Market Size (2031) | USD 225.17 Billion |
| Growth Rate (2026 - 2031) | 11.86 % |
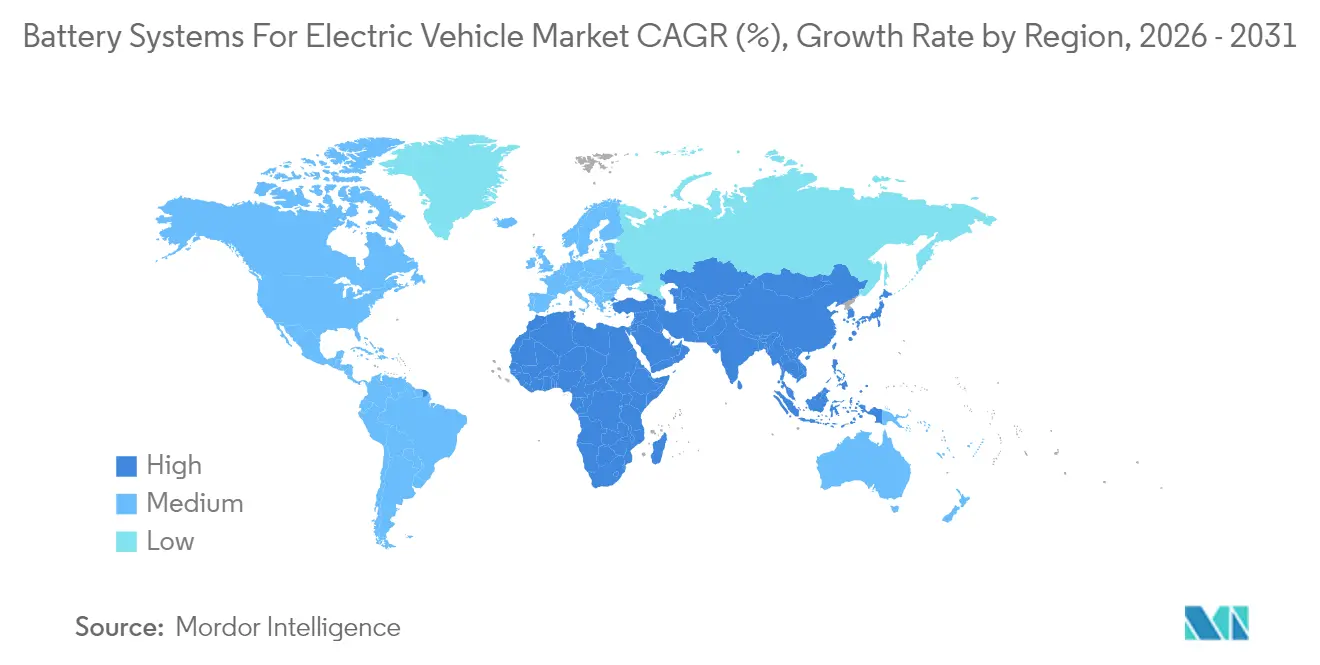
| Fastest Growing Market | Middle East and Africa |
| Largest Market | Asia Pacific |
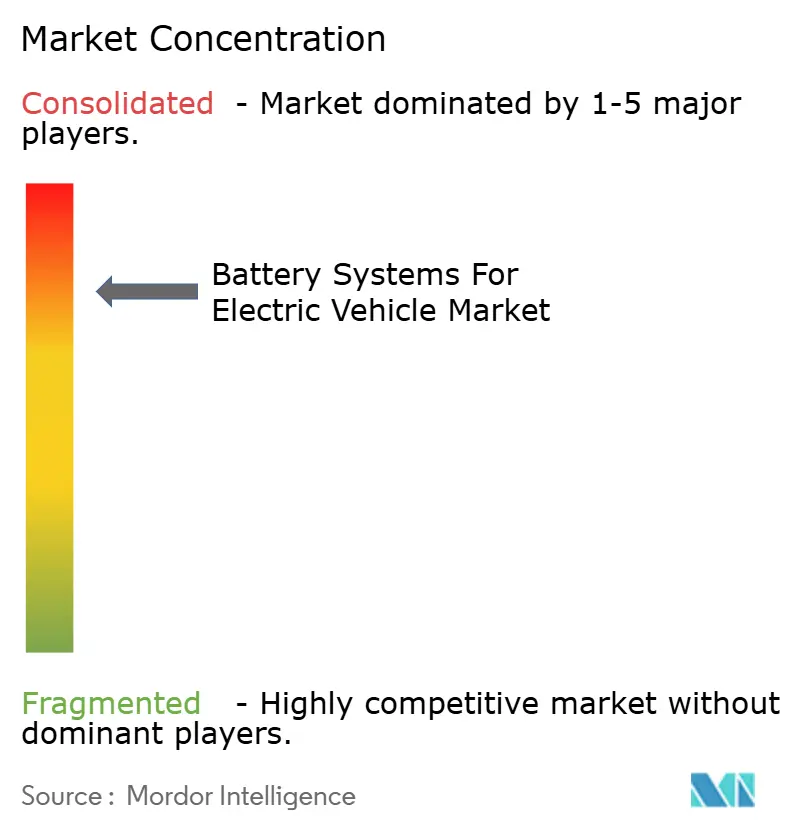
| Market Concentration | High |
Major Players *Disclaimer: Major Players sorted in no particular order Image © Mordor Intelligence. Reuse requires attribution under CC BY 4.0. | |
Battery Systems For Electric Vehicle Market Analysis by Mordor Intelligence
battery systems for electric vehicles market size in 2026 is estimated at USD 128.55 billion, growing from 2025 value of USD 114.92 billion with 2031 projections showing USD 225.17 billion, growing at 11.86% CAGR over 2026-2031. Incentive-driven adoption targets in North America and Europe, rapid cost declines in lithium-ion chemistry, and vertically integrated gigafactory roll-outs across Asia, North America, and Europe underpin this expansion. The market also benefits from solid-state breakthroughs that promise higher energy density and safety, while multi-chemistry packs combining lithium-ion with sodium-ion or ultracapacitors widen design flexibility. Competitive intensity remains high as Chinese producers use lithium iron phosphate cost advantages to win share, even as regulatory frameworks in the United States and the European Union tighten local-content demands. Supply-chain bifurcation, thermal-runaway recalls, and critical-mineral volatility temper the outlook but do not derail the secular growth trajectory.
Key Report Takeaways
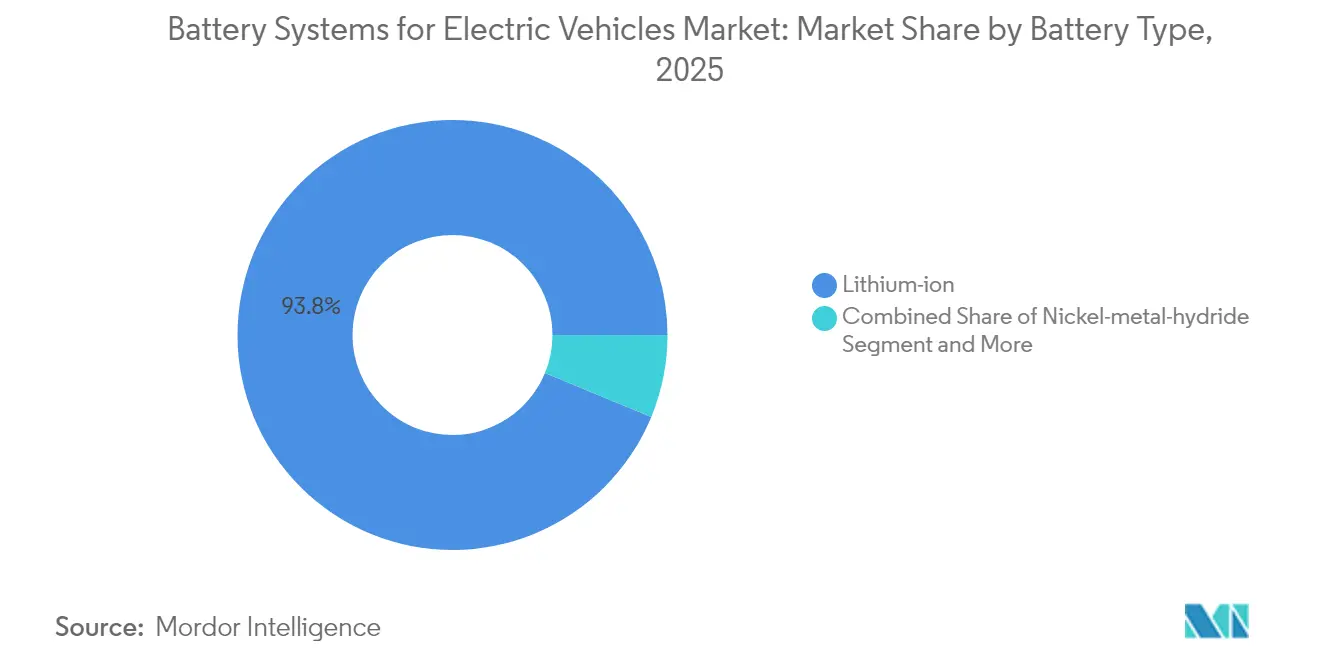
- By battery type, lithium-ion led with 93.78% of the battery systems for electric vehicles market share in 2025, while solid-state batteries are projected to grow at 37.85% CAGR through 2031.
- By battery chemistry, nickel manganese cobalt claimed 60.85% revenue share in 2025; sodium-ion is forecast to expand at a 41.90% CAGR to 2031.
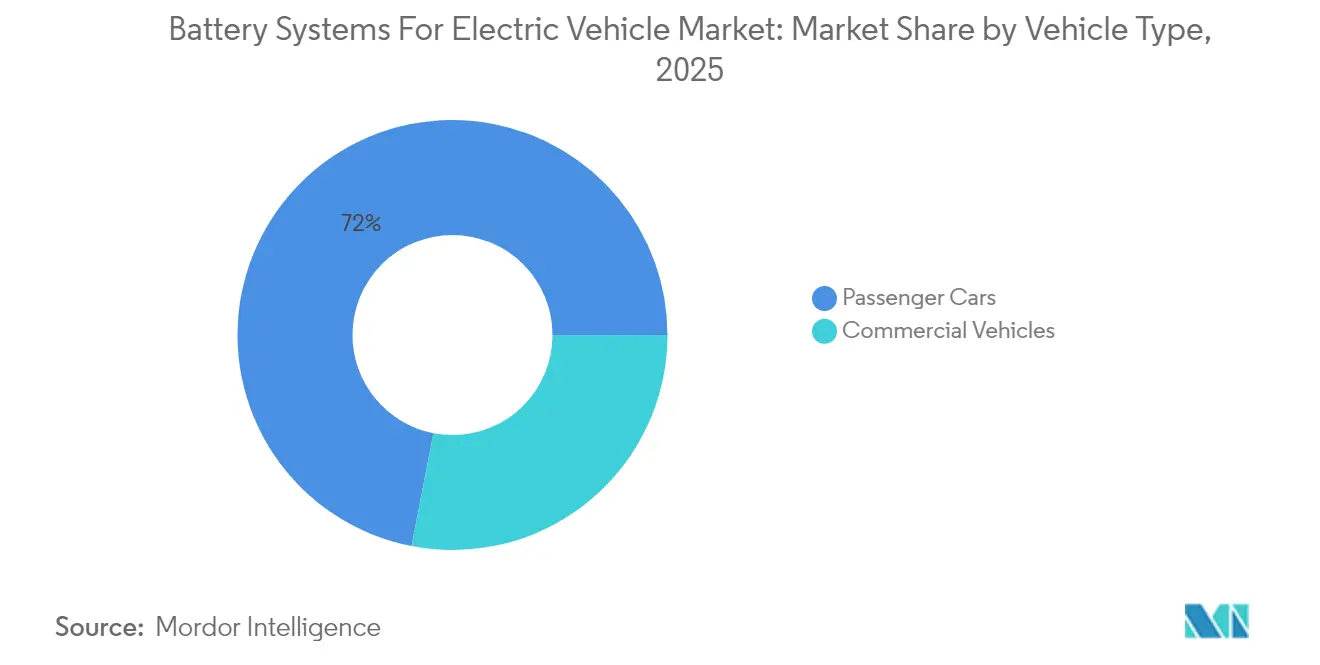
- By vehicle type, passenger cars held 71.95% of the battery systems for the electric vehicles market size in 2025, whereas commercial vehicles post the fastest 18.95% CAGR.
- By propulsion technology, battery electric vehicles dominated with 70.92% share in 2025; plug-in hybrids are set to advance at 13.72% CAGR to 2031.
- By geography, Asia-Pacific captured 63.74% of the battery systems for electric vehicles market in 2025, while the Middle East and Africa region records the highest 15.21% CAGR.
Note: Market size and forecast figures in this report are generated using Mordor Intelligence’s proprietary estimation framework, updated with the latest available data and insights as of 2026.
Market Trends and Insights
Drivers Impact Analysis of Battery Systems For Electric Vehicle Market*
| Driver | (~) % Impact on CAGR Forecast | Geographic Relevance | Impact Timeline |
|---|---|---|---|
| Government Incentives and Zero-Emission Mandates | +3.2% | Global, with strongest impact in North America & EU | Medium term (2-4 years) |
| Declining Li-Ion Costs and Energy Density Gains | +2.8% | Global | Long term (≥ 4 years) |
| OEM Giga-Factory Buildouts and Supply Pacts | +2.1% | North America, Europe, APAC core | Medium term (2-4 years) |
| Fast-Charging Network Expansion | +1.9% | Global, with early gains in China, California, Europe | Short term (≤ 2 years) |
| Vehicle-To-Grid Programs Monetizing Batteries | +1.1% | North America & EU, pilot programs in APAC | Long term (≥ 4 years) |
| Insurance Discounts Linked to Battery Health | +0.7% | North America & EU | Short term (≤ 2 years) |
| Source: Mordor Intelligence | |||
Government Incentives and Zero-Emission Mandates
Regulatory frameworks accelerate demand by anchoring minimum sales volumes for electric drivetrains. The United States offers tax credits up to USD 7,500 per qualifying vehicle and escalates domestic-content thresholds each year. California’s Advanced Clean Cars II rule obliges automakers to reach 22% zero-emission sales in 2025 and 100% by 2035[1]“Advanced Clean Cars II Regulation,” California Air Resources Board, arb.ca.gov. The United Kingdom mandates 80% electric sales by 2030, while Canada targets 100% by 2035. Because non-compliance triggers sizable penalties, most vehicle makers lock in multi-year battery offtake contracts, providing cell manufacturers with volume security and cash-flow visibility.
Declining Li-ion Costs and Energy Density Gains
Learning-curve effects and materials substitution continue to drive cost trajectories downward. Several top-tier cell makers aim to push pack costs below USD 60 per kWh by 2026, versus USD 118 per kWh in 2024. Energy density climbs through silicon-rich anodes that raise specific capacity by 25-50%, while lithium iron phosphate improves volumetric density with refined cathode coatings. Rapid cost declines widen the total addressable market into entry-level passenger cars, two-wheelers, and cost-sensitive commercial fleets.
OEM Giga-factory Build-outs and Supply Pacts
Automakers invest billions of dollars in regional gigafactories to de-risk logistics, meet local-content rules, and capture upstream margins. New North American facilities collectively add over 500 GWh by 2030, enough capacity for ten million mid-sized vehicles annually. European joint ventures follow, with Spanish, German, and Nordic plants combining to exceed 400 GWh. Localization shrinks transit time, cuts tariffs, and allows platform-specific cell customization.
Fast-charging Network Expansion
Public-private funding programs accelerate charger density, targeting universal coverage along highways and dense urban corridors. The United States pursues 500,000 chargers by 2030, while the European Union links national targets to the registered electric vehicle base[2]“Global EV Outlook 2024,” iea.org. China already has 2.6 million public charging points. As dwell times shrink to 10 minutes for 400 km range additions, cell designs integrate advanced thermal plates and high-C-rate electrolytes to preserve cycle life.
Restraints Impact Analysis of Battery Systems For Electric Vehicle Market*
| Restraint | (~) % Impact on CAGR Forecast | Geographic Relevance | Impact Timeline |
|---|---|---|---|
| Mineral Supply and Price Volatility | -2.3% | Global, with highest impact in China dependent regions | Long term (≥ 4 years) |
| Thermal-Runaway Recalls and Safety Perception | -1.8% | Global, with heightened sensitivity in developed markets | Medium term (2-4 years) |
| Trade Barriers and Local-Content Rules | -1.4% | North America & EU primarily, spillover to allied nations | Medium term (2-4 years) |
| Uncertain Recycling Economics for LFP / Na-Ion | -0.9% | Global, with early impact in markets with high recycling mandates | Long term (≥ 4 years) |
| Source: Mordor Intelligence | |||
Critical-Mineral Supply and Price Volatility
Concentration in upstream refining exposes manufacturers to geopolitical risk. China refines 80% of global lithium iron phosphate cathode material, while one country produces the majority of cobalt. Demand for lithium is expected to grow five-fold by 2030, yet mine approvals lag, forcing price swings that compress cell-maker margins. Diversification efforts require several years to materialize, extending dependence on dominant suppliers and undermining price visibility.
Thermal-Runaway Recalls and Safety Perception
High-profile battery fires prompt regulatory scrutiny and expensive recalls. Manufacturers bolster packs with ceramic separators, cell-to-pack firewalls, and advanced thermal management, yet consumer perception recovers slowly. Stricter retention standards demand that packs maintain 70% capacity for eight years, raising validation costs and prolonging development cycles.
*Our forecasts treat driver/restraint impacts as directional, not additive. The impact forecasts reflect baseline growth, mix effects, and variable interactions.
Battery Systems For Electric Vehicle Market Segment Analysis
By Battery Type:
Lithium-ion Dominance Faces Emerging ChallengesLithium-ion technology held 93.78% of the battery systems for electric vehicles market share in 2025 and remains the volume leader through 2031. Rapid pack-level innovation drives gravimetric densities toward 300 Wh/kg while trimming cost below USD 60 per kWh. The segment’s entrenched manufacturing ecosystem spans materials, cell formats, and recycling streams, reinforcing scale advantages and lowering entry barriers for new vehicle OEMs.
Solid-state cells record the highest 37.85% CAGR, propelled by ceramic separators that curb dendrite growth and cut capacity fade to 5% after 1,000 cycles. Their superior energy storage enables compact pack designs that free cabin space and trim curb weight, key factors in high-performance or extended-range models. Commercial readiness hinges on automated sintering and high-pressure lamination lines that slash production cost to parity with conventional lithium-ion by the late decade.


By Battery Chemistry:
NMC Leadership Challenged by LFP Cost AdvantagesNickel manganese cobalt chemistry accounted for 60.85% of the battery systems for the electric vehicles market size in 2025, anchoring its position in premium passenger cars and light trucks that demand maximum range. Continuous cobalt-content reduction and manganese-rich formulations cut exposure to price spikes and ethical sourcing concerns.
Lithium iron phosphate rises sharply on the back of robust safety, abundant raw material supply, and lower cost, attracting budget segments and heavy-duty commercial vehicles. Sodium-ion cells, growing at 41.90% CAGR, unlock cold-temperature operation down to −40 °C and tolerate frequent fast-charge cycles. Their near-zero lithium content buffers price risk and allows domestic resource utilization in regions lacking lithium reserves. Hybrid packs combining sodium-ion and lithium-ion optimize cost while maintaining performance, creating an architecture bridge toward full sodium-ion transition once density reaches 200 Wh/kg.
By Vehicle Type:
Commercial Vehicles Drive Fastest GrowthPassenger cars dominate revenue with a 71.95% share in 2025. Subsidies, expanding model line-ups, and falling battery prices make electric sedans and crossovers attainable to mass-market consumers. Charging infrastructure density in cities and along corridors removes range anxiety, cementing adoption trajectories.
Commercial vehicles register the fastest 18.95% CAGR as fleet operators exploit predictable duty cycles and total cost advantages. High daily utilization magnifies fuel savings, and dedicated depot charging eases infrastructure challenges. Electric last-mile vans, class-8 tractors with megawatt charging, and battery-swapping taxis find traction in markets where zero-emission zones and congestion fees penalize internal-combustion fleets. Purpose-built commercial packs favor long calendar life and robust thermal tolerance over headline range, spurring chemistry diversification into LFP and sodium-ion.
By Propulsion Technology:
BEV Dominance with PHEV ResurgenceBattery electric vehicles represented 70.92% of the battery systems for the electric vehicles market in 2025 and maintain lead status as regulations increasingly phase out internal-combustion engines. Dedicated BEV platforms optimize skateboard architectures, lowering the center of gravity and enabling advanced driver-assistance system integration.
Plug-in hybrids, growing at 13.72% CAGR, address infrastructure gaps and psychological range concerns in suburban and rural areas. A new generation of high-energy packs delivers up to 400 km electric-only range, reducing gasoline reliance while retaining long-distance flexibility. Fleet operators in Europe exploit taxation advantages linked to zero-emission mileage share, accelerating corporate PHEV uptake. Hybrid electric vehicles without plug-in capability gradually plateau as consumers transition toward plug-enabled models that maximize incentive eligibility.
Geography Analysis
APAC Battery Systems for Electric Vehicle Market
Asia-Pacific maintained 63.74% share of the battery systems for electric vehicles market in 2025, anchored by an integrated supply chain that stretches from mineral processing through cell assembly to vehicle manufacturing. China alone supports a significant growth through 2030 as domestic demand remains strong and exports surge, particularly to Southeast Asia and Latin America. Japan advances solid-state research while Korea pivots toward high-manganese chemistries to regain competitiveness. Government incentive alignment and coordinated infrastructure spending continue to reinforce the regional ecosystem.
North America and Europe Battery Systems for Electric Vehicle Market
North America registers the second-largest market, the Inflation Reduction Act channels USD 369 billion in clean-energy funding and sets escalating critical-mineral thresholds, creating a robust pipeline of new gigafactories and mid-stream refining projects. Similarly, Europe advances at 9.18% CAGR on the back of its Green Deal policies and the European Battery Alliance. Strategic autonomy drives localized cathode production and cell assembly funded by public-private joint ventures. Germany leads research partnerships that push silicon-rich anodes, whereas Spain and France focus on mass-market lithium iron phosphate.
MEA Battery Systems for Electric Vehicle Market
The Middle East & Africa region posts the highest regional growth at 15.21% CAGR. Saudi Arabia invests USD 6 billion in an integrated battery complex to diversify its economy and secure downstream automotive manufacturing. The United Arab Emirates targets 25% electric vehicle penetration by 2035, anchoring charging-corridor build-outs along inter-emirate highways. Early-stage projects in Ghana, Morocco, and Rwanda benefit from concessional finance and development-agency technical assistance, positioning the continent for localized two-wheeler and light-commercial electrification.

Regulatory Landscape
Regulation is tightening around traceability, sustainability, and durability for EV batteries across major markets. In the European Union, Regulation (EU) 2023/1542 introduces lifecycle requirements such as carbon-footprint declarations (for EV batteries above 2 kWh from February 2025) and mandates a Digital Battery Passport for EV batteries effective 18 February 2027, pushing pack makers and OEMs to build data systems covering materials provenance, performance, and end-of-life obligations.
In the United States, incentive eligibility and technical compliance increasingly shape sourcing and product design. The Treasury/IRS rules governing the Clean Vehicle Credit under Internal Revenue Code Section 30D tighten critical mineral and battery component sourcing requirements over time, while a transitional rule allows manufacturers to apply prior critical-mineral sourcing rules through 31 December 2026. Separately, EPA requirements in 40 CFR Part 86 set battery durability obligations beginning model year 2027 for vehicles 6,000 pounds or less, elevating validation, warranty risk management, and battery management system (BMS) calibration as compliance-critical activities.
Value Chain Analysis
The battery systems value chain spans upstream mining and refining of critical minerals, precursor and active material manufacturing (cathode active materials, anode materials, electrolytes, separators), cell manufacturing, module and pack assembly (including thermal systems and BMS), integration into vehicles, and downstream second-life and recycling. Key midstream steps remain geographically concentrated, with China holding a large share of anode and cathode production capacity, which keeps pricing and availability of processed materials central to cost and lead-time outcomes for global EV programs.
Localization and long-term offtake agreements are also changing how value is captured from cells through packs, particularly under local-content and incentive frameworks. The shift shows up in North American scale-up moves such as the Hyundai Motor Group and SK On joint venture starting initial production at Hyundai-SK Battery Manufacturing America in Georgia (July 2026), alongside upstream and midstream alignment to meet incentive sourcing thresholds (for example, LG Chem supplying cathode materials to Toyota Motor Engineering and Manufacturing North America). For many OEMs and tier-1 suppliers, pack assembly is moving closer to vehicle plants as cell-to-pack and cell-to-body architectures reduce parts count and help control costs, while recycling and second-life economics remain a key uncertainty for LFP and emerging sodium-ion pathways.
Competitive Landscape
High market concentration persists, with CATL leading the ground. Its scale advantage stems from vertical integration that covers mining partnerships, cell manufacturing, and battery-swapping networks. BYD leverages in-house vehicle production to optimize blade-battery formats, while Korean incumbents emphasize high-nickel chemistries and automotive-grade quality processes to defend premium niches. Japanese manufacturers focus on solid-state patents and ceramic separator expertise, lining up joint ventures with global OEMs to accelerate commercialization.
Technology differentiation shapes strategic positioning. Chinese suppliers expand lithium iron phosphate capacity to undercut price points in entry segments, whereas Western ventures prioritize cobalt-free high-manganese cathodes to meet regulatory sourcing thresholds. Intellectual property around solid-state electrolytes remains concentrated among a handful of players, limiting fast followers. Meanwhile, battery-as-a-service business models that decouple cell ownership from vehicles attract mobility-platform investment, setting the stage for recurring-revenue ecosystems.
Geopolitical headwinds now influence procurement strategy. Foreign-entity-of-concern rules in the United States restrict incentive eligibility for cells containing Chinese materials. European import tariffs and carbon-border adjustments may follow. Consequently, joint ventures, minority equity stakes, and long-term supply contracts diversify sourcing and hedge compliance risk.
Battery Systems For Electric Vehicle Industry Leaders
Panasonic Corporation
Samsung SDI Co Ltd
Contemporary Amperex Technology Co., Limited. (CATL)
BYD Co. Ltd.
LG Energy Solution Ltd.
- *Disclaimer: Major Players sorted in no particular order
Battery Systems For Electric Vehicle Market Companies Covered in this Report
- Contemporary Amperex Technology Co., Limited. (CATL)
- BYD Co. Ltd.
- LG Energy Solution Ltd.
- Panasonic Holdings Corporation
- Samsung SDI Co., Ltd.
- SK On Co., Ltd.
- AESC Group Ltd.
- CALB
- Gotion High-tech Co., Ltd.
- EVE Energy Co., Ltd.
- Farasis Energy Europe GmbH
- Northvolt AB
- ProLogium Technology Co., Ltd
- QuantumScape Battery, Inc.
- Solid Power Inc.
- StoreDot
- SES AI Corp.
- Hitachi Energy Ltd.
- Johnson Controls International plc
Read Analysis of Battery Systems For Electric Vehicle Companies

Market Opportunities and Future Outlook
Compliance-led redesign and data infrastructure stand out as a white-space area as the EU Battery Regulation (EU) 2023/1542 pushes carbon-footprint declarations (from February 2025 for EV batteries above 2 kWh) and a Digital Battery Passport requirement effective 18 February 2027. This is driving near-term demand for pack-level traceability, standardized sustainability reporting, and verification workflows connecting cell suppliers, cathode and anode producers, and OEMs, alongside engineering work to demonstrate performance and durability as the requirements phase in.
Regional manufacturing expansion and chemistry diversification are also creating opportunities across both supply and technology. Panasonic opened its De Soto, Kansas EV battery facility (April 2026) with a planned 32 GWh annual capacity, Tesla announced an additional USD 250 million investment to raise Giga Berlin battery cell capacity to 18 GWh per year (May 2026), and the European Commission established the Battery Booster Facility via Decision (EU) 2026/1283 (June 2026) to support EV battery cell manufacturing ramp-up. On the technology side, visible company programs around LFP, sodium-ion, and solid-state scale-up, including R&D hub investments such as Samsung SDI’s disclosed 25 trillion won investment across Ulsan and Cheonan in July 2026, support a multi-chemistry roadmap that ties cost pressure, safety requirements, and sourcing constraints to product segmentation across passenger and commercial vehicles.
Recent Industry Developments in Battery Systems For Electric Vehicle Market
- June 2026: Panasonic announced a USD 2.18 billion investment plan to expand battery capacity and repurpose production lines across Japan, the United States (including Kansas), and Mexico, targeting growing demand for stationary storage tied to AI data centers. The announcement points to cross-sector utilization of manufacturing assets and supply chains used for EV battery systems, which can affect equipment allocation and supplier priorities.
- April 2026: Samsung SDI signed a multi-year agreement to supply high-nickel NCM batteries for Mercedes-Benz next-generation electric vehicles. The contract supports Samsung SDI’s position in premium automotive applications where quality, durability validation, and localized supply considerations increasingly influence purchasing decisions.
- April 2025: CATL launched its Naxtra sodium-ion battery, highlighting 175 Wh/kg energy density and cold-temperature performance with 90% power retention at minus 40 C, positioned for mass-production readiness. The launch reinforced sodium-ion’s role as a complementary chemistry for cost and temperature resilience, supporting multi-chemistry pack architectures alongside lithium-ion.


Battery Systems For Electric Vehicle Market Report Scope and Research Methodology
Market Definition and Coverage
For this report, the market covers revenue generated from complete battery systems used in electric vehicles, where the system is counted as the integrated energy storage solution installed in the vehicle (including key electronics and thermal management needed to operate safely).
Scope exclusions: We exclude standalone raw materials and upstream cell manufacturing equipment, and we also exclude charging infrastructure and external energy storage used outside the vehicle.
Segments Covered in This Report
- By Battery Type
- Lithium-ion
- Nickel-metal-hydride
- Lead-acid
- Ultracapacitors
- Solid-state and others
- By Battery Chemistry
- NMC
- NCA
- LFP
- LMO
- Sodium-ion and emerging
- By Vehicle Type
- Passenger Cars
- Commercial Vehicles
- By Propulsion Technology
- Battery Electric Vehicle (BEV)
- Plug-in Hybrid Electric Vehicle (PHEV)
- Hybrid Electric Vehicle (HEV)
- By Geography
- North America
- United States
- Canada
- Rest of North America
- South America
- Brazil
- Argentina
- Rest of South America
- Europe
- Germany
- United Kingdom
- France
- Italy
- Spain
- Netherlands
- Russia
- Rest of Europe
- Asia-Pacific
- China
- Japan
- South Korea
- India
- Australia
- Thailand
- Middle East and Africa
- Saudi Arabia
- United Arab Emirates
- Turkey
- South Africa
- Egypt
- Rest of Middle East and Africa
- North America
Data Sources, Market Sizing, and Validation
Desk Research
Desk research was used to set the base structure of the model and to keep assumptions tied to widely visible indicators. We leaned on public sources such as International Energy Agency EV outlook tables, national transport and energy agencies, UN Comtrade trade statistics, and customs-level import export disclosures where available for battery components and packs.
To ground the sizing in market activity, we also reviewed company annual reports, investor presentations, and regulatory filings, then used industry association publications and reputable press coverage on capacity additions, gigafactory ramps, and model launches. In a few cases, paid subscriptions were used only to speed up company financial checks and to review patent activity trends for battery management and thermal designs, then those signals were cross-checked against public announcements. The desk sources listed here are illustrative, and we reviewed many other public and paid sources for data collection, validation, and clarification.
Primary Interviews and Surveys
Primary work focused on interviews and short surveys with battery system suppliers, EV OEM teams, component specialists (such as BMS and thermal), and distribution or sourcing managers who see pricing and supply changes early. The fieldwork was kept global so regional differences in EV production mix, localization, and policy timing could be captured, and the findings were used to confirm the gaps left by public data, especially around typical system content, price trends, and what is counted as a battery system versus a cell-only view.
Distribution of primary research fieldwork respondents
| Company type | Respondent position | Region |
|---|---|---|
| Top tier: 38% | CXOs: 13% | APAC: 50% |
| Mid tier: 47% | Functional/Unit leaders: 32% | EMEA: 29% |
| Smaller Players: 15% | Managers: 55% | Americas: 21% |
Market-Sizing & Forecasting
Sizing starts with a top-down build where EV production by region and powertrain mix is translated into a battery system demand pool, and then converted to value using system level average selling prices. Those totals are checked with selective bottom-up approximations, where supplier revenue disclosures, sampled ASP by kWh bands, and channel checks on pack and system pricing are used to validate the output and adjust for obvious gaps.
Inputs in the model include EV production and sales by vehicle type, average battery pack capacity by segment (kWh), chemistry mix shifts that change $/kWh, localization and import dependence signals from trade flows, and announced capacity ramps that can constrain near-term availability. Where direct data is missing for smaller regions or niche vehicle classes, we apply proxy logic using nearby markets with a similar vehicle mix, followed by expert review to keep the assumptions realistic.
For forecasting, we use scenario analysis to reflect different paths for EV adoption, price compression in $/kWh, and supply ramp timing, and then align the selected case to what primary respondents describe as the most likely near-term procurement reality. This keeps the forecast auditable and driven by a small set of observable market variables rather than overly complex math.
Data Validation & Update Cycle
The outputs are validated through triangulation across at least three angles: EV production signals, implied battery demand in kWh, and the price path used to convert volume into value. Large variances are flagged, rechecked at the assumption level, and reviewed by another analyst before sign-off to reduce the risk of a single-person bias affecting the final number.
The report is refreshed annually, and interim updates are made when there are material events such as major policy shifts, demand shocks, or large capacity additions that change supply and pricing. Before delivery, a final review pass is completed so the result reflects the latest public indicators and recent interview feedback.
Mordor Intelligence's Battery Systems for Electric Vehicle Market Size Versus Other Published Estimates
Published market sizes for EV battery systems often do not line up because the product boundary and the counting unit differ, and because price and volume assumptions can be applied at different points in the value chain. The year used for the base, the currency conversion timing, and the way price declines are modeled can also create visible spreads.
By tracking EV production mix and pack capacity, and then checking what is counted as a full battery system (not cells only) within Mordor Intelligence, the modeled value stays connected to installed demand and a transparent $/kWh path rather than broad revenue pools. Differences usually come from folding in adjacent scopes like raw battery materials, using aggressive or conservative price erosion curves, or applying a looser treatment of hybrid vehicles and replacement demand.
Benchmark comparison
| Source | Market Size | Gaps in Research Methodology |
|---|---|---|
| Mordor Intelligence | USD 128.55 B (2026) | |
| Industry Publisher A | USD 105.90 B (2024) | Uses an earlier base year and appears to apply a wider forecast window, and the scope can tilt toward pack level revenue without consistently separating full system content and installed vehicle demand in each region. |
| Global Consultancy B | USD 61.31 B (2024) | Positions the market as EV batteries more broadly, which can blend battery pack, cell, and vehicle battery revenue treatments, and the value outcome is sensitive to how $/kWh and vehicle type mix are defined in the base year. |
The table shows that the spread is mostly explained by scope boundary and the base year chosen, followed by how price per kWh is carried forward and tied to vehicle mix. When the demand pool is reconstructed from EV output and capacity, and the value step is applied in a repeatable way, the final market size is easier to audit and update as conditions change.


Key Questions Answered in the Report
Why is Asia-Pacific the largest regional contributor to the battery systems for electric vehicles market?
An integrated supply chain from mineral processing to vehicle assembly, coupled with aggressive purchase subsidies and infrastructure outlays, allows the region to command 63.74% of global revenue.
Which chemistry is gaining the fastest momentum after lithium-ion?
Sodium-ion exhibits the highest 41.90% CAGR thanks to low-cost raw materials and robust cold-temperature performance.
How will solid-state batteries influence market growth by 2031?
Solid-state cells grow at 37.85% CAGR, boosting energy density and safety; they are expected to capture material share once manufacturing cost approaches parity with lithium-ion packs.
What restrains the battery systems for electric vehicles industry despite strong demand?
Critical-mineral concentration, thermal-runaway recalls, and evolving trade barriers collectively impacts the forecast CAGR.
Which vehicle segment offers the most attractive growth opportunity?
Commercial vehicles lead with 18.95% CAGR because fleet operators derive rapid total-cost-of-ownership benefits and comply with zero-emission zone mandates.
Page last updated on:


 Your data is secure and never sold or shared.


