
Market Overview
| Study Period | 2021 - 2031 |
|---|---|
| Market Size (2026) | USD 30.05 Billion |
| Market Size (2031) | USD 50.36 Billion |
| Growth Rate (2026 - 2031) | 10.88 % |
| Fastest Growing Market | North America |
| Largest Market | Asia-Pacific |
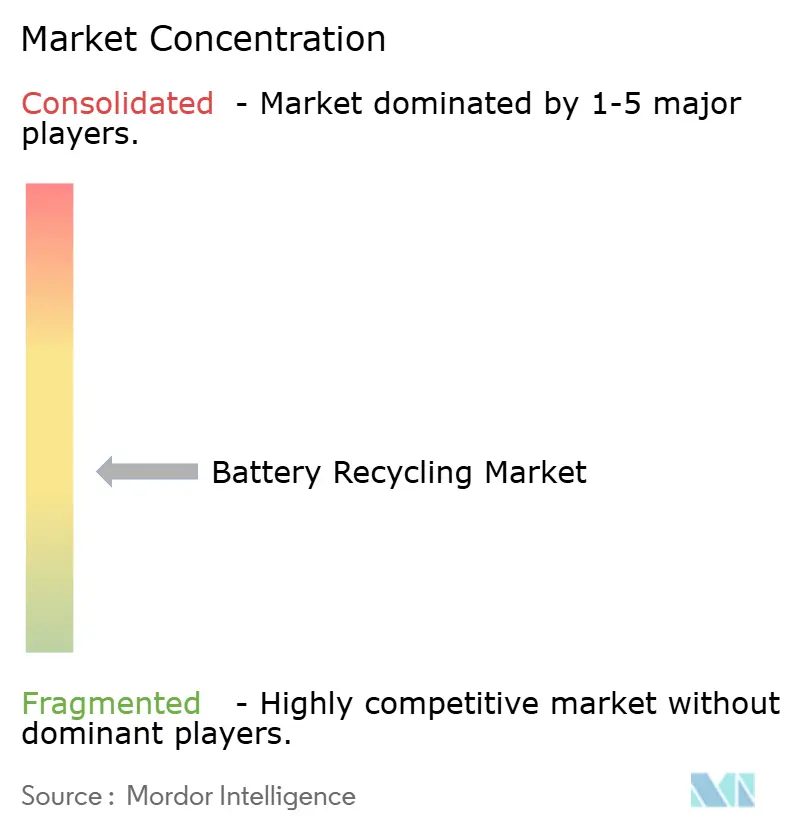
| Market Concentration | Medium |
Major Players *Disclaimer: Major Players sorted in no particular order Image © Mordor Intelligence. Reuse requires attribution under CC BY 4.0. | |
Battery Recycling Market Analysis by Mordor Intelligence
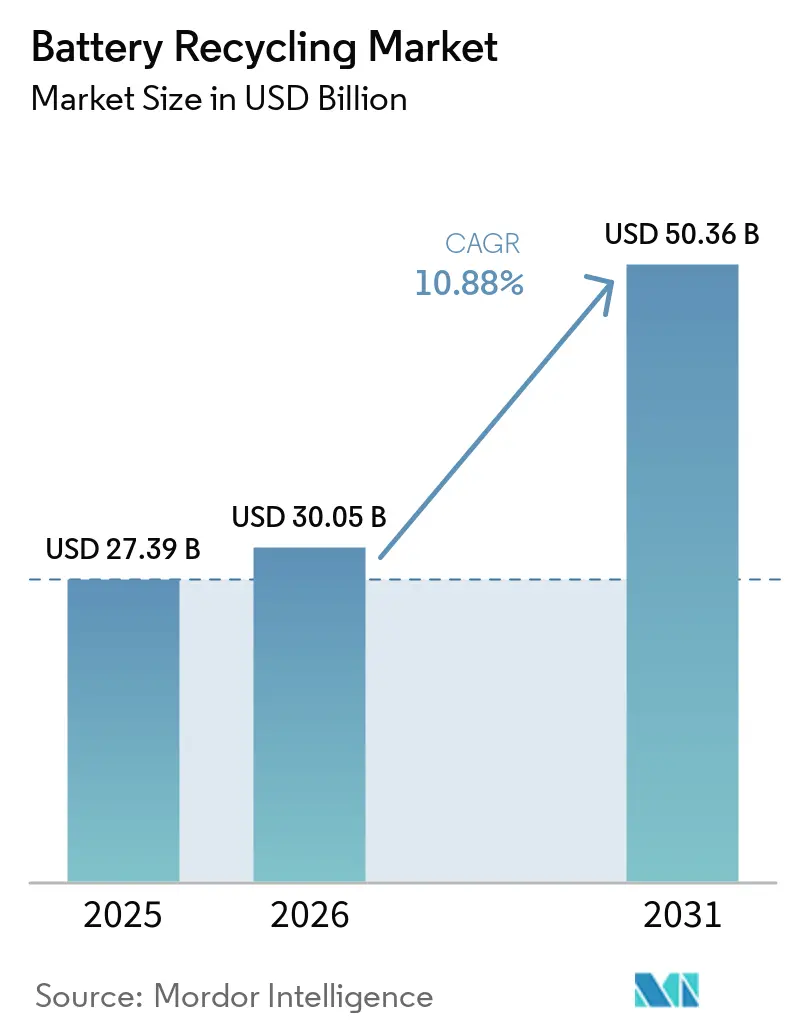
The Battery Recycling Market size is expected to grow from USD 27.39 billion in 2025 to USD 30.05 billion in 2026 and is forecast to reach USD 50.36 billion by 2031 at 10.88% CAGR over 2026-2031.
The expansion is underpinned by extended-producer-responsibility mandates, rising critical-metal scarcity, and automaker commitments to closed-loop cathode supply chains that treat end-of-life cells as strategic feedstock rather than waste. Lead-acid batteries retained dominant volumes thanks to mature collection networks, yet lithium-ion chemistries are gaining ground as electric-vehicle (EV) penetration accelerates and legacy automotive lead-acid demand plateaus.[1]International Energy Agency, “Global EV Outlook 2025,” iea.org Hydrometallurgical routes are scaling quickly because they deliver high-purity nickel and cobalt sulfates demanded by cathode producers, while direct-recycling pilots show energy savings that could cut pack costs by USD 1,000 per vehicle once commercialized. Regionally, Asia-Pacific anchors more than half of revenue due to China’s integrated gigafactory-recycler clusters, whereas North America posts the fastest growth as the Inflation Reduction Act incentives subsidize domestic black-mass refining.[2]European Commission, “Regulation (EU) 2023/1542 on Batteries,” eur-lex.europa.eu
Key Report Takeaways
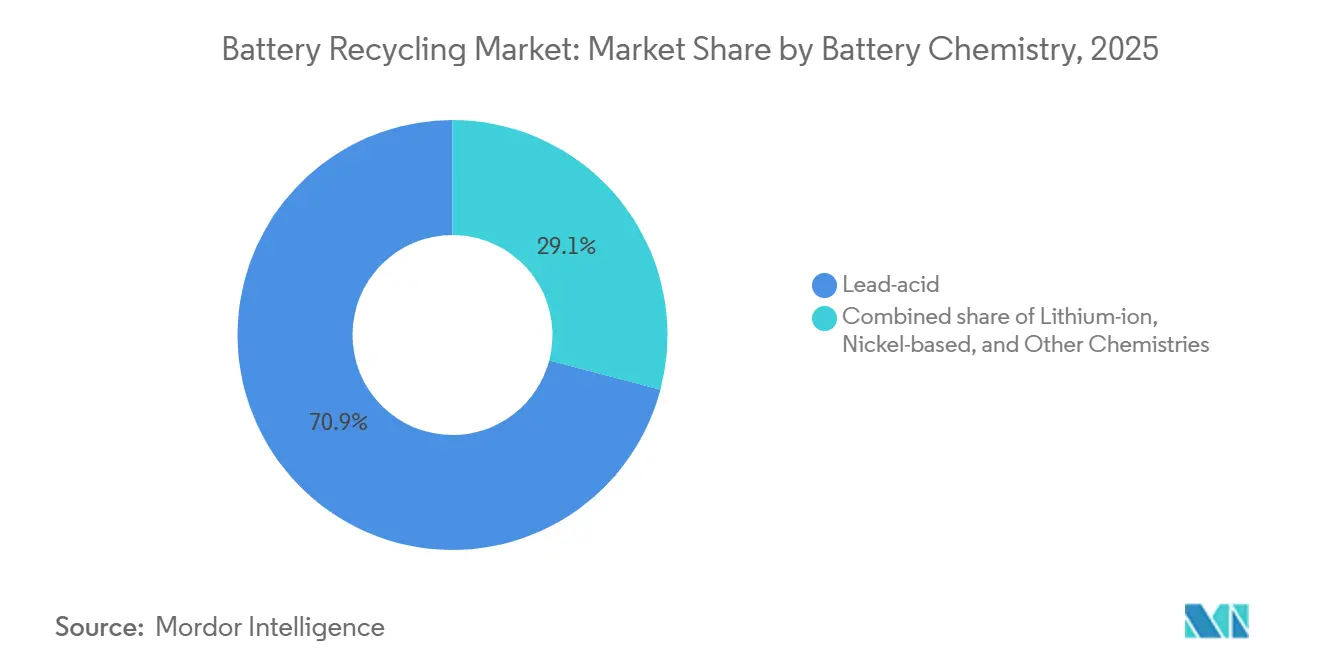
- By battery chemistry, lead-acid held 70.9% of the battery recycling market share in 2025; lithium-ion is forecast to grow at a 23.9% CAGR through 2031.
- By source of scrap, automotive batteries led with 58.5% of the battery recycling market share in 2025, while consumer electronics batteries are projected to rise at a 20.5% CAGR through 2031.
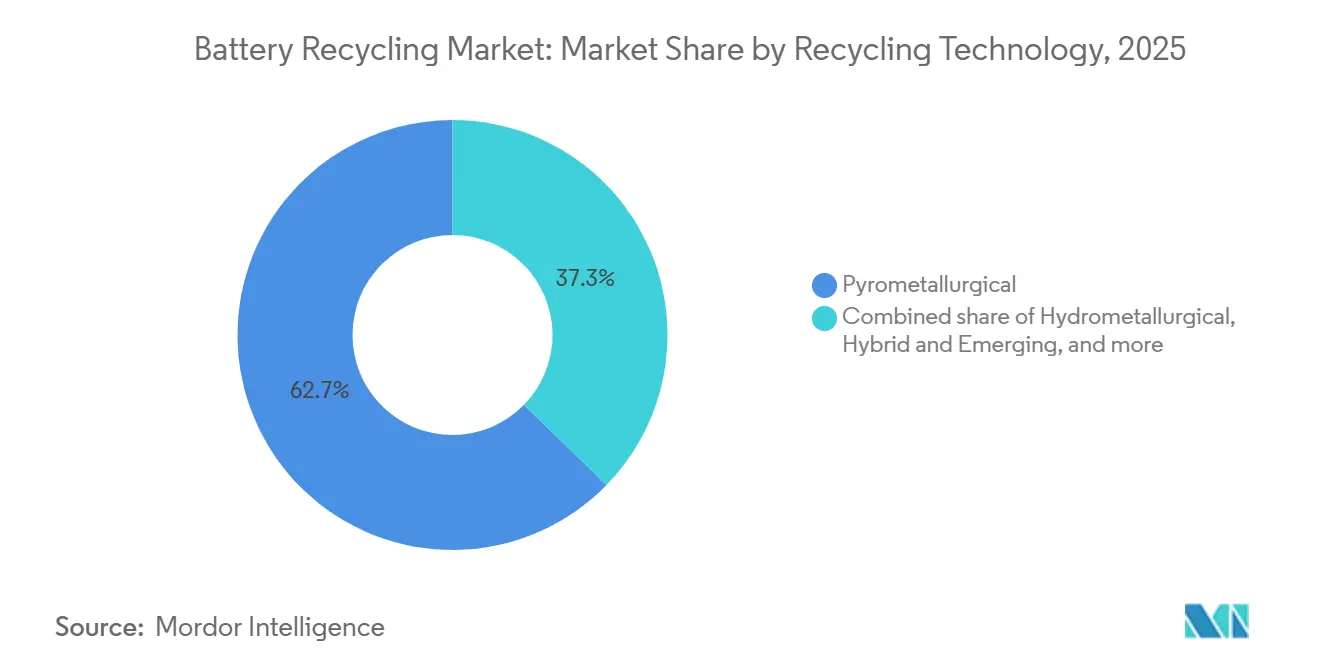
- By recycling technology, pyrometallurgy led with a 62.7% share in 2025, while hydrometallurgy is advancing at a 22.7% CAGR to 2031.
- By process stage, material refining and recovery accounted for 28.6% of the battery recycling market size in 2025, while black-mass production is forecast to advance at a 25.1% CAGR to 2031.
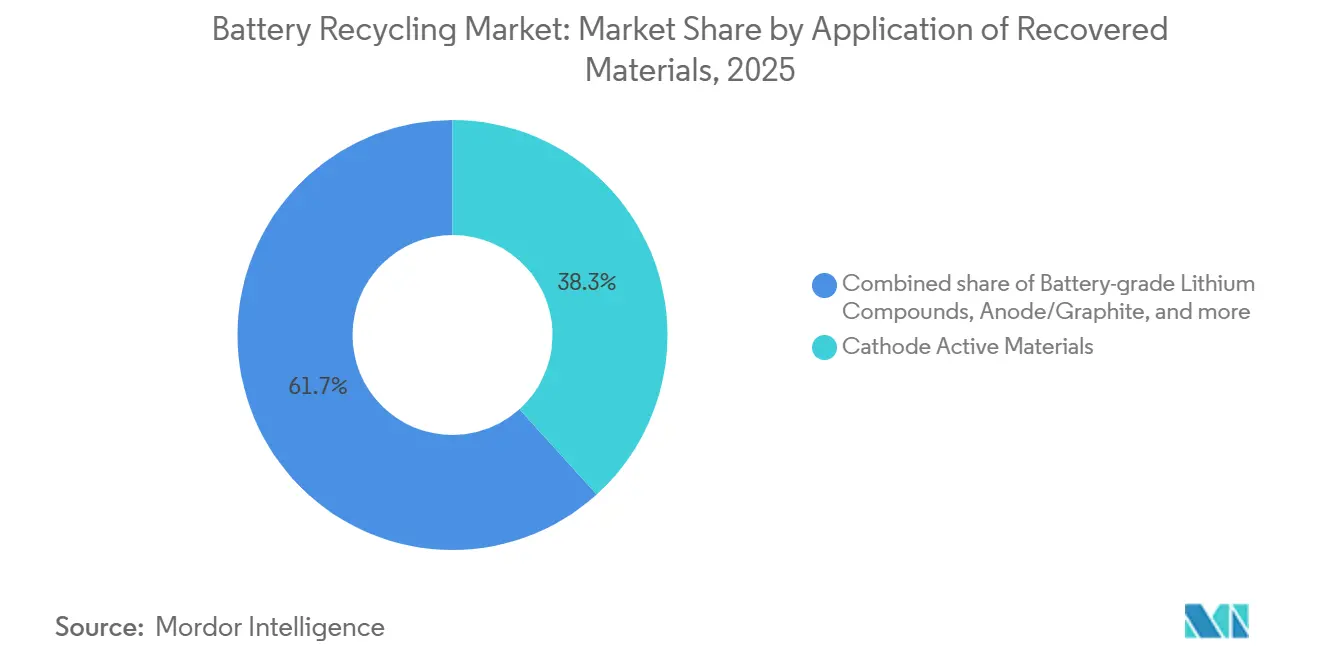
- By application of recovered materials, the cathode active materials segment claimed 38.3% of revenue in 2025, whereas battery-grade lithium compounds are expected to register the highest growth at 27.6% CAGR over 2026-2031.
- By end-user industry, automotive captured 43.1% of the battery recycling market size in 2025, and power & energy storage is climbing at a 19.8% CAGR to 2031.
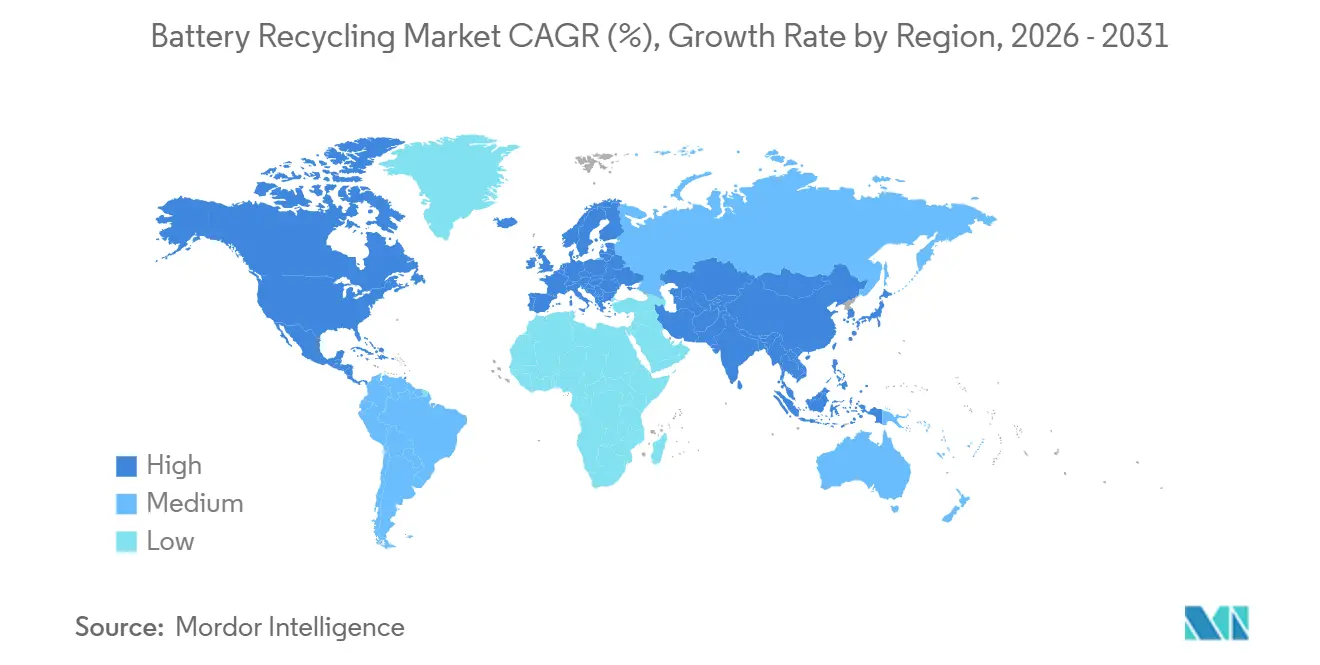
- By geography, Asia-Pacific commanded 52.4% revenue in 2025; North America is projected to expand at a 21.3% CAGR between 2026-2031.
Note: Market size and forecast figures in this report are generated using Mordor Intelligence’s proprietary estimation framework, updated with the latest available data and insights as of January 2026.
Global Battery Recycling Market Trends and Insights
Drivers Impact Analysis*
| Driver | (~) % Impact on CAGR Forecast | Geographic Relevance | Impact Timeline |
|---|---|---|---|
| EV penetration surge | +3.2% | Global, strongest in China, EU, North America | Medium term (2-4 years) |
| Global end-of-life battery rules tighten | +2.1% | EU, China, North America; emerging India & ASEAN | Long term (≥ 4 years) |
| Critical-metal price inflation | +1.8% | Global, acute where cathode imports dominate | Short term (≤ 2 years) |
| OEM ESG & circular-economy mandates | +1.5% | North America, EU; pilots in Japan, South Korea | Medium term (2-4 years) |
| Liquid black-mass spot markets emerge | +1.1% | China, EU; nascent North America | Short term (≤ 2 years) |
| Break-through direct-recycling economics | +0.9% | North America, EU; R&D in Asia-Pacific | Long term (≥ 4 years) |
| Source: Mordor Intelligence | |||
EV penetration surge
Global battery-electric and plug-in hybrid sales passed 14 million units in 2024, embedding roughly 1.1 TWh of lithium-ion capacity that will reach end-of-life after 2032, creating a predictable feedstock wave.[3]International Energy Agency, “Global EV Outlook 2025,” iea.org Tesla recovered 92% of critical minerals from retired packs at its Nevada facility, proving technical feasibility at scale. China projects 12 million t of retired lithium-ion cells by 2030, triple the current global recycling capacity. Europe’s tightening fleet-average CO₂ limits accelerate EV adoption and bring first-generation packs into dismantling networks earlier.[4]European Commission, “Regulation (EU) 2023/1542 on Batteries,” eur-lex.europa.eu The lag between sales and retirements compresses the window for recyclers to build capacity and secure offtake agreements with cathode makers.
Global End-of-Life Battery Regulations Tighten
The EU Battery Regulation requires 16% recycled cobalt, 6% recycled lithium, and 6% recycled nickel in new EV batteries by 2031, with steeper thresholds by 2036. China’s 2024 extended-producer-responsibility rules oblige automakers to finance collection networks and reach 85% lithium-ion recovery, alongside penalties up to CNY 500,000 per violation. The U.S. Environmental Protection Agency proposed a stewardship framework in 2025 that would impose producer fees on cells lacking certified recycling pathways. India’s draft EPR rules target 70% collection by 2028 but lack enforcement clarity. These policies reduce revenue volatility for recyclers but fragment supply chains across jurisdictions.
Critical-Metal Price Inflation
Lithium carbonate averaged CNY 95,000 (USD 13,400) t in Q4 2024, still 180% above 2020 levels. Cobalt sulfate traded near USD 12,800 t in December 2024 as artisanal-mining governance issues in the Democratic Republic of Congo added risk premiums. Nickel sulfate suitable for batteries reached USD 16,200 t in early 2025 amid Indonesian ore-export curbs. Recycled cathode precursors now sell only 5-8% below virgin equivalents, improving recycler margins as volumes rise.
OEM ESG & Circular-Economy Mandates
Volkswagen aims to source 50% of cathode nickel and cobalt from recycled content by 2030 and is co-locating hydrometallurgical refining at its Salzgitter gigafactory. General Motors signed a 50,000 t y black-mass offtake pact with Cirba Solutions through 2030. BMW reached 30% recycled content in Neue Klasse cells via direct-recycling pilots that cut processing energy 40% versus hydro routes. Such mandates lock recyclers into long-term supply contracts, de-risking capital expenditure but concentrating buyer power.
Restraints Impact Analysis*
| Restraint | (~) % Impact on CAGR Forecast | Geographic Relevance | Impact Timeline |
|---|---|---|---|
| High capex / opex of recycling plants | -1.4% | Global, acute where subsidies absent | Medium term (2-4 years) |
| Patchy collection logistics in emerging markets | -0.9% | India, ASEAN, Sub-Saharan Africa, Latin America | Long term (≥ 4 years) |
| Safety & hazardous-material transport hurdles | -0.7% | Global, most stringent in EU & North America | Short term (≤ 2 years) |
| Shift to low-value LFP chemistries | -1.2% | China, India; spreading to entry EV segments elsewhere | Medium term (2-4 years) |
| Source: Mordor Intelligence | |||
High Capex / Opex of Recycling Plants
A 20,000 t y hydrometallurgical facility requires USD 180-250 million, with reactors and solvent-extraction trains comprising 60% of the installed cost. Operating expenses range USD 1,800-2,400 t input, driven by acid consumption and wastewater treatment. Li-Cycle’s Rochester Hub budget ballooned from USD 485 million to USD 960 million by mid-2024, exposing cost-overrun risk. Smaller firms in emerging markets face debt costs of 18-22%, widening the infrastructure gap.
Patchy Collection Logistics in Emerging Markets
India’s formal lithium-ion collection rate was 28% in 2024, with the rest funneled to informal dismantlers lacking discharge protocols, wasting 30-40% recoverable material. Indonesia operates collection points in only 12 of 34 provinces, and reverse logistics from outer islands can exceed USD 150 t. Sub-Saharan Africa recovers under 5% of EV batteries, and Brazil’s collection lags in municipalities below 100,000 residents, keeping volumes below the 15,000 t scale needed for hydro plant viability.
*Our forecasts treat driver/restraint impacts as directional, not additive. The impact forecasts reflect baseline growth, mix effects, and variable interactions.
Segment Analysis
By Battery Chemistry: Lead-Acid Dominates Revenue, Lithium-Ion Drives Growth
Lead-acid retained 70.9% of 2025 revenue as nearly 99% of spent units are collected in developed markets and recycled through established smelters.[5]Battery Council International, “U.S. Lead-Acid Recycling Statistics 2025,” batterycouncil.org Lithium-ion’s 23.9% CAGR signals where the battery recycling market is pivoting; International Energy Agency data show 1.8 million t of lithium-ion scrap annually by 2030, creating an addressable lithium-ion battery recycling market size surge. Incumbent lead-acid recyclers are modernizing pyro lines, while new entrants finance hydrometallurgical hubs to capture upcoming lithium-rich flows. Redwood Materials processed 18,000 t of lithium-ion scrap in 2024, confirming commercial momentum.
The battery recycling market is therefore split: lead-acid offers stable, low-growth cash flows; lithium-ion offers high-growth, technology-intensive upside. Competitive advantage will hinge on securing EV-derived feedstock ahead of the post-2028 inflection and on achieving metal-recovery rates above 90% to satisfy automaker specifications.


By Source of Scrap: Automotive Dominates, Consumer Electronics Accelerates
Automotive batteries supplied 58.5% of 2025 throughput, reflecting large lead-acid replacement volumes and early EV retirements such as 2013-16 Nissan Leaf packs. Consumer electronics scrap is expanding 20.5% CAGR as device lifecycles shorten; however, sub-40% collection rates reveal upside for policy-driven capture programs. Manufacturing scrap delivers high-purity feedstock and turns inventory within 45 days at CATL’s Ningde campus, improving working capital compared with post-consumer flows.
Rapid consumer electronics growth ensures the battery recycling market continues diversifying feedstock, reducing reliance on automotive volumes, and improving blended margins as clean manufacturing scrap offsets lower-grade household batteries.
By Recycling Technology: Pyrometallurgy Holds Scale, Hydrometallurgy Gains Precision
Pyrometallurgy provided 62.7% of the 2025 capacity because existing copper and nickel smelters can accept mixed chemistries without pre-sorting. Yet hydrometallurgy is growing 22.7% CAGR as cathode producers demand battery-grade nickel sulfate with ≤50 ppm impurities, a purity that pyro slag cannot cost-effectively achieve. Direct-recycling pilots account for 8.4% today but could carve high-margin niches once homogeneous EV scrap streams become available.
Hydrometallurgy’s rise will lift the battery recycling market share of high-value converted salts, while pyro lines may shift toward lower-value, cobalt-lean LFP and stationary-storage scrap where absolute purity is less critical.
By Process Stage: Refining Anchors Value, Black-Mass Surges
Material refining and recovery contributed 28.6% of 2025 revenue, delivering USD 1,200-1,800 t gross margin owing to technical barriers and permitting complexity. Black-mass production is the fastest riser at 25.1% CAGR as vertically integrated cell makers bypass third-party smelters. CATL’s Brunp subsidiary already runs 180,000 t/y of black-mass lines feeding captive cathode plants.
The battery recycling market size for black-mass tolling will therefore expand rapidly, yet ultimate value capture rests with refiners that can supply battery-grade salts under automaker quality contracts.
By Application of Recovered Materials: Cathode Actives Lead, Lithium Compounds Accelerate
Cathode-active materials secured 38.3% of the 2025 value as LG Energy Solution, SK On, and Samsung SDI consumed 42,000 t of recycled precursors. Recycled lithium compounds are forecast at a 27.6% CAGR, lifted by direct-recycling yields of 95-98% lithium recovery. Anode and graphite initiatives remain R&D-stage, and manganese recovery fetches one-tenth the cobalt price, keeping it a marginal revenue stream.
Accelerating lithium recovery ensures the battery recycling market maintains competitiveness against new brine and hard-rock projects, particularly in jurisdictions with strong environmental-permitting hurdles.
By End-User Industry: Automotive Anchors Demand, Energy Storage Surges
Automotive consumed 43.1% of recycled-battery output in 2025 as OEMs hedge cobalt and nickel exposure through closed-loop black mass recycling programs. Power and energy-storage systems represent the fastest-growing demand at 19.8% CAGR, driven by first-wave utility-scale lithium-ion retirements and second-life repurposing economics that extend pack life by up to 10 years.
Utility growth diversifies the battery recycling industry customer base, reducing correlation with automotive cycles and providing a stable offtake for lithium-rich black mass.
Geography Analysis
Asia-Pacific captured 52.4% of 2025 revenue, led by China's vertically integrated ecosystem where recycler-gigafactory clusters reach 88-92% metal-recovery through hydro routes. The national battery passport, launched in 2024, tags every cell for traceability, cutting contamination by 15-18%. Japan processed 68,000 t of NiMH and lithium-ion scrap, recovering rare-earth elements at Toyota-Sumitomo's Onahama smelter. South Korea's fee-backed EPR scheme lifted lithium-ion recovery to 72% by end-2025. India has 42,000 t capacity, but informal dismantlers still siphon 60% of volumes.
North America is the fastest-growing region at 21.3% CAGR. Section 45X provides a USD 10 kWh production credit for recycled material, and Section 30D requires 50% battery value from North America or FTA partners by 2026. Redwood Materials is investing USD 3.5 billion in a 100 GWh cathode-anode campus, with 30% recycled feedstock. Li-Cycle's Rochester Hub secured a USD 475 million DOE loan guarantee, targeting late-2026 commissioning. Canada earmarked CAD 1.5 billion for recycling infrastructure, with Glencore and Electra expanding hydrometallurgy in Quebec and Ontario.
Europe's share is also increasing at a high rate, driven by rNorthvolt'stent strong mandates. Northvolt's Revolt facility achieved 95% lithium, nickel, and cobalt recovery at 8,000 t throughput and targets 125,000 t/y by 2030. Germany granted EUR 200 million to Duesenfeld and Accurec for 50,000 tFrance'sd hydro capacity. France's Veolia-Solvay JV will build a 15,000 t plant in ACC 'sirk, co-located with ACC's gigafactory. South America and MEA combined for share, limited to Brazil's network and South Africa's Eco-Bat smelter; large-scale lithium-ion projects await higher EV penetration.

Regulatory Landscape
Regulation is tightening around traceability, recycling-performance verification, and producer responsibility. In the EU, Regulation (EU) 2023/1542 sets recycled-content and recovery obligations that affect how recyclers qualify with cell makers and OEMs. From the 2026 calendar year, annual reporting begins for recycling efficiency and material recovery, supported by harmonized calculation and verification rules in Commission Delegated Regulation (EU) 2025/606 and standardized reporting formats under Commission Implementing Regulation (EU) 2025/2289. This increases the importance of auditable mass-balance systems and stronger quality controls.
In the United States, policy support is tied to Department of Energy grant authority under the Infrastructure Investment and Jobs Act for battery materials processing, manufacturing, and recycling facilities. This complements the market shift toward domestic refining and closed-loop supply. The U.S. Environmental Protection Agency has also advanced voluntary guidance through its battery EPR framework workstream, including a May 2026 Battery Collection Best Practices Report to Congress, which is shaping collection-system design and documentation practices that producers and recyclers use to demonstrate responsible end-of-life pathways.
Competitive Landscape
The top 10 recyclers controlled roughly 50% of global throughput in 2025; no single company exceeded 12% share, yielding a moderately fragmented structure. Legacy lead-acid firms like Eco-Bat and Glencore leverage existing smelters, while lithium-focused specialists such as Redwood Materials, Li-Cycle, and Ascend Elements compete on hydrometallurgical purity and direct-recycling innovation. Chinese incumbents CATL, GEM, and Brunp exploit captive gigafactory scrap and internal transfer pricing that undercuts merchant recyclers by up to 15%.
Cirba Solutions consolidated Retriev and Heritage Battery Recycling and secured USD 200 million from Koch Strategic Platforms to lift capacity to 120,000 t y by 2027. Neometals’ mixed-hydroxide-precipitate process recovers 96% lithium, allowing only a 3% discount versus virgin carbonate. Patent filings in direct recycling jumped 140% from 2022-2024, signaling intensifying intellectual-property competition. Scale, vertical integration, and process IP will dictate future share shifts as the battery recycling market evolves.
Battery Recycling Industry Leaders
Brunp Recycling Technology
Li-Cycle Holdings Corp.
Umicore SA
GEM Co. Ltd.
Glencore plc
- *Disclaimer: Major Players sorted in no particular order

Market Opportunities and Future Outlook
EU compliance mechanics are creating near-term whitespace around data, verification, and compliant routing of black mass and end-of-life lithium-ion batteries, particularly as 2026 reporting begins under Regulation (EU) 2023/1542 and the related delegated and implementing acts (2025/606 and 2025/2289). That shift is raising demand for traceable, battery-grade outputs and is pushing investments that combine pre-treatment, hydrometallurgical refining, and documentation capability within the same operating model. Fortum Battery Recycling securing a new environmental permit in April 2026 to lift daily processing capacity at Kirchardt, Germany (from 10 to 25 tonnes, with increased hazardous-waste storage) is an example of capacity additions tied directly to regulated European operating requirements.
On the supply side, the market is also opening for integrated hubs that can convert heterogeneous feedstock into consistent intermediates (black mass) and, more often, into saleable battery-grade salts where impurity and specification control matter. In China, Brunp (CATL) has continued to expand pretreatment and lithium-carbonate capacity via approved project expansions (reported May 2026), showing how recycler-gigafactory integration scales when aligned to domestic collection or EPR systems and downstream cathode demand. In North America, grant and financing programs alongside OEM offtake structures support build-outs that localize processing near battery manufacturing corridors, while emerging black-mass spot markets and long-term offtake contracts (including the automaker and recycler agreements described in the report context) reduce uncertainty for refining-stage investments.
Recent Industry Developments
- May 2026: Umicore SA reaffirmed battery recycling solutions as part of its CORE strategy focus for 2026 and continued operating its pilot battery recycling plant in Hoboken, Belgium, highlighting nickel recovery rates above 95%. The update underscores the role of high-purity recovery performance in qualifying recycled metals for cathode supply chains under tighter European requirements.
- August 2025: Glencore plc completed the acquisition of Li-Cycle assets, including multiple Spoke facilities (Germany, Arizona, Alabama, New York, and Ontario) and the Rochester Hub project. The transaction accelerates consolidation and connects recycling capacity more directly to a large commodity producer and marketer, strengthening pathways to scale feedstock access and refined-metal offtake.
- December 2024: Li-Cycle provided an update on its European Recycling Hub pre-feasibility work and collaboration framework with Glencore. The disclosure kept focus on establishing commercial routes for hub products and cross-border integration, reflecting how project viability increasingly depends on secured offtake terms and financing alignment rather than stand-alone capacity announcements.


Research Methodology Framework and Report Scope
Market Definition and Coverage
This market captures the value from collecting, processing, and refining spent or scrap batteries so recovered materials can be reused, and recycling services can be sold to major end uses.
Scope exclusions: We exclude primary mining and virgin refining of battery metals, and we also exclude the manufacturing value of new batteries that are not part of recycling.
Segmentation Overview
- By Battery Chemistry
- Lead-acid
- Lithium-ion (NMC, LFP, NCA, LMO)
- Nickel-based
- Other chemistries (Zn-air, Sodium-ion etc.)
- By Source of Scrap
- Automotive Batteries
- Consumer Electronics Batteries
- Industrial and ESS Batteries
- Manufacturing Scrap
- By Recycling Technology
- Hydrometallurgical
- Pyrometallurgical
- Direct/Mechanical
- Hybrid and Emerging (Bio/ Electro-chemical)
- By Process Stage
- Collection and Logistics
- Dismantling and Discharge
- Mechanical Shredding/Sorting
- Black-Mass Production
- Material Refining and Recovery
- By Application of Recovered Materials
- Cathode Active Materials
- Anode/Graphite
- Battery-grade Lithium Compounds
- Cobalt and Nickel Salts
- Manganese
- Others (Cu, Al)
- By End-user Industry
- Automotive
- Marine
- Power and Energy Storage
- Consumer Electronics
- Others
- By Geography
- North America
- United States
- Canada
- Mexico
- Europe
- Germany
- United Kingdom
- Italy
- France
- Spain
- NORDIC Countries
- Russia
- Rest of Europe
- Asia-Pacific
- China
- India
- Japan
- South Korea
- ASEAN Countries
- Australia and New Zealand
- Rest of Asia-Pacific
- South America
- Brazil
- Argentina
- Colombia
- Rest of South America
- Middle East and Africa
- Saudi Arabia
- United Arab Emirates
- South Africa
- Egypt
- Rest of Middle East and Africa
- North America
Data Sources, Market Sizing, and Validation
Desk Research
Desk work starts with building the demand and supply story in plain numbers, and then mapping it to recycling revenue. We review public datasets and policy trackers, such as USGS mineral statistics, UN Comtrade trade flows, IEA publications on EV and battery supply chains, and European Commission battery regulation updates, since these sources help frame material availability and compliance pull.
After that, we read company filings and investor presentations to understand capacity additions, plant commissioning timing, and typical output streams (for example, black mass and recovered salts). Patent databases are also scanned to identify which recycling routes are being commercialized and what yields are being claimed. Where needed, paid subscriptions for company financials and intelligence, news and financials, patent databases, and shipment-level import and export views are used to cross-check volumes, plant footprints, and pricing direction. The sources listed here are illustrative only, and many other public references were used during collection, validation, and clarification.
Primary Interviews and Surveys
Primary work is used to pressure-test the desk assumptions with operators, feedstock aggregators, recyclers, material buyers, and domain experts connected to policy and compliance. We also use these discussions to set practical ranges for collection rates, recovery yields, and pricing behavior across regions, so gaps in public data do not push the model in one direction.
For a global market like this, inputs were checked across APAC, EMEA, and the Americas to reflect differences in regulation, informal collection channels, and the pace of EV battery retirements.
Distribution of primary research fieldwork respondents
| Company type | Respondent position | Region |
|---|---|---|
| Top tier: 25% | CXOs: 12% | APAC: 48% |
| Mid tier: 61% | Functional/Unit leaders: 38% | EMEA: 29% |
| Smaller Players: 14% | Managers: 50% | Americas: 23% |
Market-Sizing & Forecasting
The core model uses a top-down and bottom-up approach. It starts with batteries placed-in-market and retirement signals, which are then converted into recyclable scrap availability by chemistry and source. For example, battery production and trade data are used to reconstruct the pool of batteries in circulation, and then expected lifetimes and collection rates are applied to estimate end-of-life volumes reaching recyclers.
Those volumes are priced using a practical revenue logic tied to the chain of steps, including collection and logistics intensity, black-mass output rates, recovery yields for key metals, and realized spreads linked to commodity benchmarks. In this market, variables that matter include lead-acid replacement cycles, EV pack retirement timing, regional compliance and take-back enforcement, recycling route mix (hydrometallurgical versus pyrometallurgical), and the portion of manufacturing scrap that enters contracted recycling.
Forecasts are built using scenario analysis, because policy enforcement, battery chemistry shifts, and commodity pricing can move together and do not always behave in a straight line. The scenarios are anchored to expert consensus ranges gathered in interviews, and then reconciled with selective bottom-up approximations, such as sampled capacity roll-ups and volume times average realized pricing checks, to adjust totals where coverage is uneven.
Data Validation & Update Cycle
Outputs are checked against independent signals before sign-off, including apparent scrap availability, announced capacity utilization direction, and price movements for recovered materials that directly affect recycler revenue. If a region or chemistry shows a jump that cannot be explained by retirements, policy changes, or capacity additions, the assumptions are revisited and the contributors are re-contacted.
A multi-step review is followed, where another analyst reviews the model logic, the unit conversions, and the year-on-year movements, and then the narrative is aligned to the numbers. Reports are refreshed annually, with interim updates when material events happen, such as major regulation changes, large plant start-ups, or sharp commodity swings. Before delivery, a final pass is done so clients receive the latest updated view.
Mordor Intelligence's Battery Recycling Market Sizing Compared With Other Published Estimates
Published market numbers for battery recycling often differ because the boundary of what counts as recycling revenue is not uniform. The timing of the base year update can also shift results. Differences also come from how each study converts battery scrap volumes into dollars, especially when pricing is volatile and contract versus spot realization is mixed.
EV battery retirement indicators, lead-acid replacement cycles, and recycler capacity announcements are used as evidence checks to keep Mordor Intelligence's estimate tied to scrap actually reaching processing and refining, instead of counting adjacent upstream or downstream value. Gaps usually appear when an estimate blends in broader waste management revenue, assumes aggressive collection improvements without local validation, or applies a single global price curve to recovered materials across very different regions.
Benchmark comparison
| Source | Market Size | Gaps in Research Methodology |
|---|---|---|
| Mordor Intelligence | USD 30.05 B (2026) | |
| Industry Research Publisher A | USD 26.90 B (2024) | Uses a different base year and may include a wider bundle of material and service items around recycling, which changes what is counted as market revenue in the starting year. |
| Industry Research Publisher B | USD 11.90 B (2024) | Applies a narrower revenue boundary and a shorter forecast window, and the pricing and yield assumptions appear to be averaged at a high level, which can understate value when recovered-material realization improves. |
The spread is mainly explained by scope boundaries, base-year timing, and how scrap volumes are translated into revenue through yields and realized pricing. By keeping the model inputs traceable to retirements, collection, process yields, and region-specific pricing signals, the final number stays repeatable and easier to defend on a client call.


Key Questions Answered in the Report
How large is the battery recycling market today and where is it headed by 2031?
The battery recycling market size reached USD 30.05 billion in 2026 and is projected to climb to USD 50.36 billion by 2031 at a 10.88% CAGR.
Which battery chemistry offers the strongest growth opportunity for recyclers?
Lithium-ion scrap is forecast to expand at a 23.9% CAGR through 2031 as EV retirements accelerate, outpacing mature lead-acid volumes.
Why is hydrometallurgy gaining share over pyrometallurgy?
Hydrometallurgical processes yield battery-grade nickel and cobalt sulfates with impurity levels below 50 ppm, meeting cathode-maker specifications that pyrometallurgical slag cannot achieve economically.
How do government incentives in North America support recycling investment?
Section 45X of the Inflation Reduction Act awards USD 10 kWh for recycled battery materials, while DOE loan programs have financed large projects such as Li-Cycles Rochester Hub and Ascend Elements Apex plant.
What limits recycling expansion in emerging markets?
Patchy collection logistics, informal dismantling networks, and high capital-cost financing keep formal recovery rates below 40% in India, ASEAN, and parts of Africa.
Will low-value LFP chemistries hurt recycler margins?
LFP's lower cobalt and nickel content reduces black-mass value by up to 65%, pressuring profit unless recyclers adopt direct-recycling routes that recover lithium efficiently.
Page last updated on:


 Your data is secure and never sold or shared.


