
Battery Electrolyte Market Size and Share
Market Overview
| Study Period | 2021 - 2031 |
|---|---|
| Market Size (2026) | USD 15.84 Billion |
| Market Size (2031) | USD 28.72 Billion |
| Growth Rate (2026 - 2031) | 12.63 % |
| Fastest Growing Market | Asia Pacific |
| Largest Market | Asia Pacific |
| Market Concentration | Medium |
Major Players *Disclaimer: Major Players sorted in no particular order Image © Mordor Intelligence. Reuse requires attribution under CC BY 4.0. | |
Battery Electrolyte Market Analysis by Mordor Intelligence
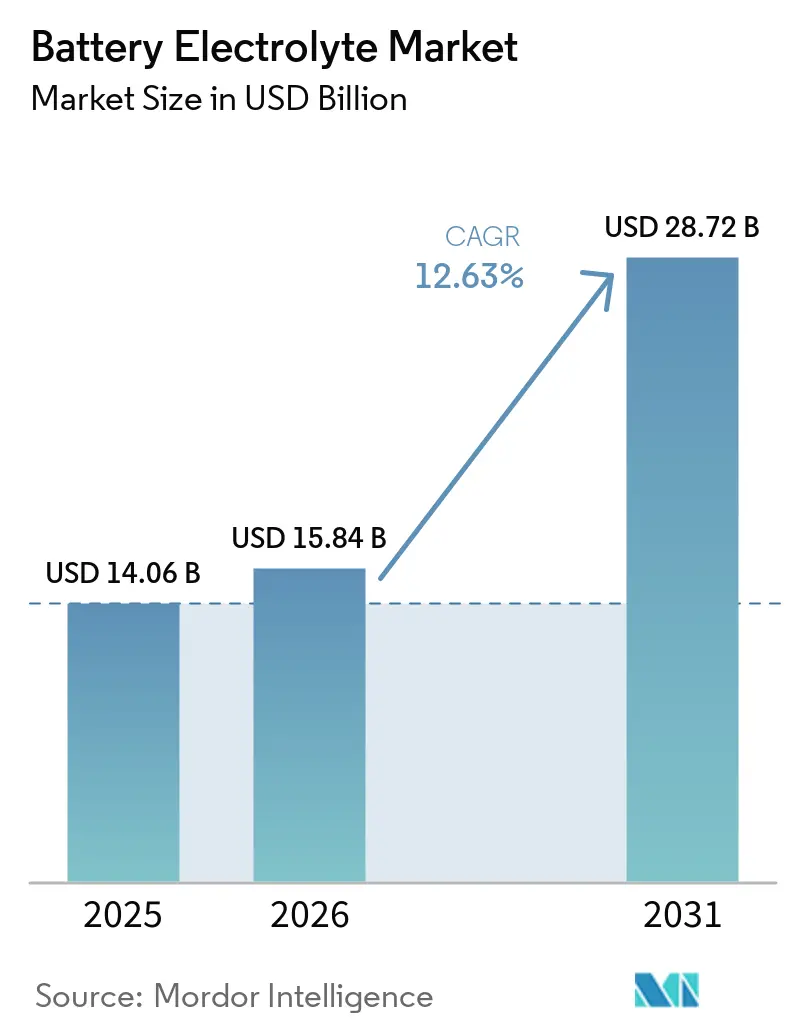
The Battery Electrolyte Market size was valued at USD 14.06 billion in 2025 and estimated to grow from USD 15.84 billion in 2026 to reach USD 28.72 billion by 2031, at a CAGR of 12.63% during the forecast period (2026-2031).
Continuous chemistry improvements, the electrification of transportation, and policy-driven supply chain localization are the key forces widening adoption curves. Lithium-ion formulations currently dominate revenues, but sodium-ion, zinc-air, and vanadium flow systems are scaling rapidly as manufacturers diversify their raw-material exposure. Regionally, the Asia-Pacific’s cost-efficient production ecosystem maintains its volume leadership, while North America and Europe accelerate the build-out of local capacity to qualify for domestic-content rules. Innovation around solid-state and gel chemistries, rising energy-storage deployments, and expanding recycling economics are together redefining competitive strategies, despite near-term headwinds from PFAS restrictions and lithium price volatility.
Key Report Takeaways
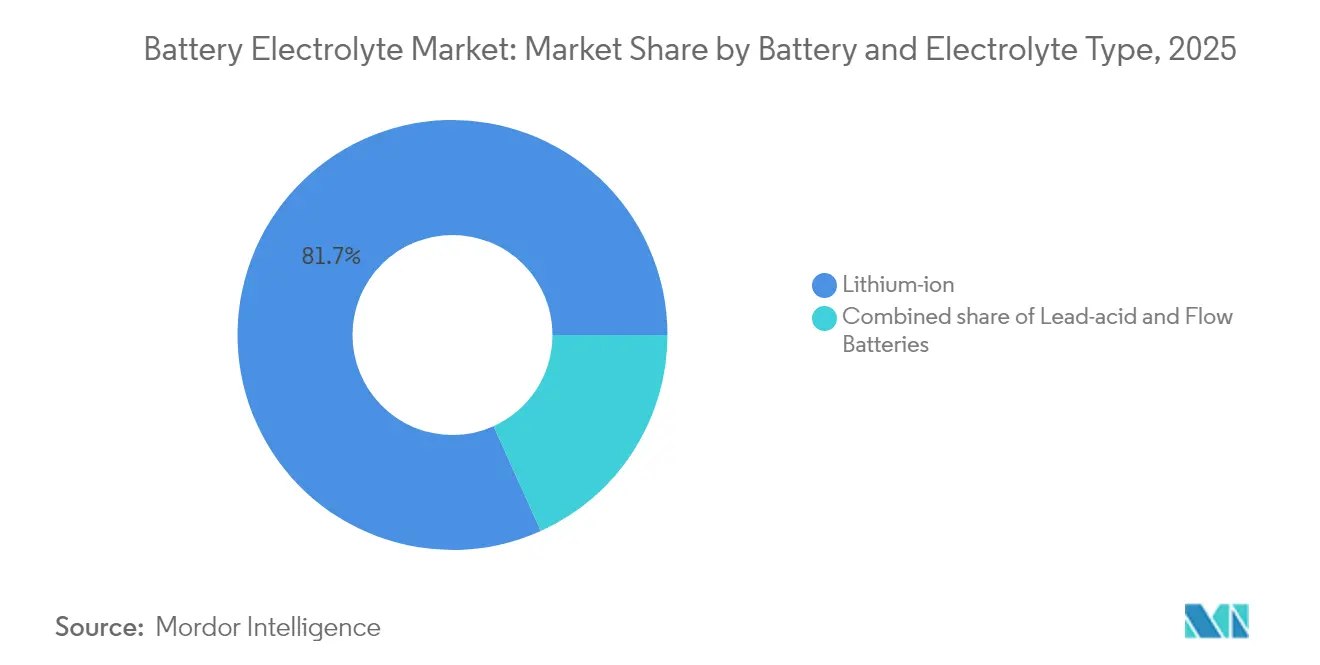
- By battery & electrolyte type, lithium-ion captured 81.74% of the battery electrolyte market share in 2025; alternative chemistries are expected to register a 22.1% CAGR through 2031.
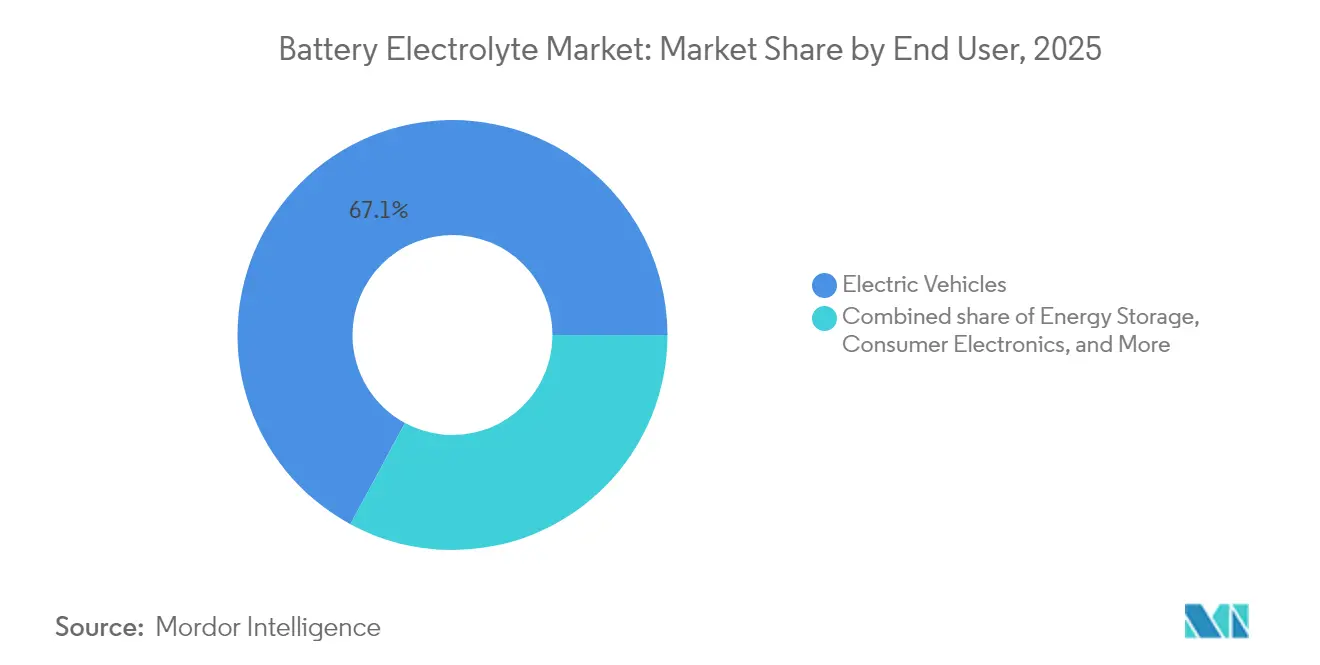
- By end user, electric vehicles accounted for 67.12% of the battery electrolyte market size in 2025, while the energy storage sector is projected to advance at a 17.25% CAGR through 2031.
- By geography, the Asia-Pacific region commanded a 69.65% revenue share of the battery electrolyte market in 2025 and is expected to expand at a 13.97% CAGR through 2031.
Note: Market size and forecast figures in this report are generated using Mordor Intelligence’s proprietary estimation framework, updated with the latest available data and insights as of 2026.
Global Battery Electrolyte Market Trends and Insights
Drivers Impact Analysis*
| Driver | (~) % Impact on CAGR Forecast | Geographic Relevance | Impact Timeline |
|---|---|---|---|
| Surging EV-linked demand in China & Europe | +3.20% | China, Europe | Short term (≤ 2 years) |
| Inflation Reduction Act spurring U.S. supply chains | +2.60% | North America | Medium term (2-4 years) |
| Shift to high-voltage solid & gel chemistries | +1.90% | Global | Long term (≥ 4 years) |
| Roll-out of grid-scale BESS | +2.30% | Global | Medium term (2-4 years) |
| Sodium-ion R&D lowering raw-material constraints | +1.50% | China, global | Long term (≥ 4 years) |
| Li-ion electrolyte recycling economics turning positive | +1.30% | North America & EU | Medium term (2-4 years) |
| Source: Mordor Intelligence | |||


Surging EV-linked demand in China & Europe
China’s EV output rose 70% in 2024, and Europe’s IPCEI-backed gigafactories aim to target 400 GWh of annual cell capacity by 2030, concentrating electrolyte demand in two regions. Local sourcing rules under the EU Battery Regulation 2023/1542 motivate European cell makers to contract directly with regional electrolyte suppliers, such as Capchem’s USD 676 million multi-year deal, which trades higher short-term costs for supply-chain visibility. The resulting scale creates cost efficiencies but also elevates geopolitical risk when trade disruptions affect precursor flows.
Inflation Reduction Act spurring U.S. local supply chains
The Act’s domestic-content criteria have triggered more than USD 150 billion of battery-value-chain commitments since 2024. UBE Corporation broke ground on a USD 500 million Louisiana plant that will produce 50,000 t of annual carbonate solvents by 2026, reducing reliance on Asian imports while exposing producers to higher North American compliance and labor costs. Long-term viability depends on the continuation of tax incentives beyond 2032 and on streamlined permitting for lithium processing ventures such as GM-Lithium Americas’ clay extraction partnership.
Shift to high-voltage solid & gel chemistries
OEM roadmaps for 4.5 V-plus cells demand electrolytes for gel battery applications that resist aluminum current-collector corrosion and suppress dendrite growth. Twenty major manufacturers disclosed solid-state commercialization timelines through 2030, with sulfide systems offering high ionic conductivity but requiring expensive dry-room fabrication. Mercedes-Benz aims for a 25% range increase via lithium-metal anodes, yet achieving cost parity with liquid electrolytes (USD 50/kWh) remains distant, as solid-state variants still exceed USD 200/kWh. Commercial feasibility hinges on breakthroughs in mass production that lower the prices of ceramic and polymer precursors.
Roll-out of grid-scale BESS
The U.S. projects a sixfold increase in battery storage deployment by 2035 to balance intermittent renewable energy sources. Long-duration applications favour vanadium redox flow batteries, whose electrolytes can be reused for decades. Chinese projects surpassed 100 MW/600 MWh in 2024.(1)Vanitec, “Global Vanadium Flow Battery Deployments 2024,” vanitec.org Vanadium price volatility and low-temperature limitations encourage R&D into zinc-iron and organic flow chemistries with ambient-condition operation, positioning suppliers that master multi-chemistry portfolios for diversification benefits.
Restraints Impact Analysis*
| Restraint | (~) % Impact on CAGR Forecast | Geographic Relevance | Impact Timeline |
|---|---|---|---|
| PFAS-phase-out regulations on fluorinated solvents | -1.00% | North America & EU | Short term (≤ 2 years) |
| Volatile lithium carbonate spot prices | -1.50% | Global | Short term (≤ 2 years) |
| Safety recalls linked to thermal-runaway incidents | -0.80% | Global | Medium term (2-4 years) |
| Patent thickets around next-gen solid electrolytes | -0.50% | Global | Long term (≥ 4 years) |
| Source: Mordor Intelligence | |||
PFAS-phase-out regulations on fluorinated solvents
The EU’s draft PFAS restriction could ban fluoroethylene carbonate by 2026, potentially forcing the reformulation of electrolytes used in approximately 60% of lithium-ion batteries.(2)European Chemicals Agency, “PFAS Restriction Proposal Under REACH,” europa.euU.S. EPA investigations are driving pre-emptive transitions to fluorine-free additives; however, replacements reduce ionic conductivity and raise costs by up to 30%. Japanese suppliers invested in proprietary ether-based blends, yet requalification cycles stretch to two years, delaying full market rollout.
Volatile lithium carbonate spot prices
Prices plunged from USD 80,000/t in early 2024 to USD 12,000/t by year-end as Chinese refining capacity outpaced demand. Contract mis-timing wiped margins for mid-tier producers bound by fixed-price offtake deals. Integration moves, such as Rio Tinto’s USD 5.85/share Arcadium Lithium acquisition, tighten upstream control, but they also concentrate pricing power, potentially raising long-run cost floors once surplus capacity is rationalized.
*Our forecasts treat driver/restraint impacts as directional, not additive. The impact forecasts reflect baseline growth, mix effects, and variable interactions.
Segment Analysis
By Battery & Electrolyte Type: Lithium-ion Dominance Faces Alternative-Chemistry Challenge
Lithium-ion formulations controlled 81.74% of the battery electrolyte market in 2025, reflecting entrenched gigafactory infrastructure and proven performance in EVs. High-nickel cathodes demand additives that suppress aluminum collector corrosion and stabilize elevated voltages, sustaining premium-grade demand for lithium-ion battery's electrolyte solvent. Meanwhile, the other-chemistry cohort—including sodium-ion and zinc-air—posts a 22.1% CAGR to 2031, propelled by material availability advantages that insulate supply chains from lithium constraints. Vanadium flow electrolytes target grid storage with discharge requirements of 10+ hours, and Chinese labs have increased stack power density by 70 kW, reducing system costs by 40%. Gel variants remain relevant for indoor lead-acid replacements, where spill-proof operation and low upfront costs remain decisive factors.
Manufacturers are broadening their portfolios to hedge against a future dominated by a single chemistry. Solid-state lithium systems promise 30% energy-density gains yet face scale bottlenecks around sulfide powder handling and oxide sintering yields. Sodium-ion prototypes moved from R&D labs to commercial lines in 2024, with pilot packs powering micro-EVs and residential storage cabinets. In this nuanced landscape, suppliers able to flexibly pivot between carbonate, ether, and ionic liquid families strengthen their long-term positioning within the battery electrolyte market.


By End User: Electric Vehicles Lead While Energy Storage Accelerates
Electric vehicles accounted for 67.12% of electrolyte shipments in 2025, as average battery sizes reached 75 kWh, driven by increasing range expectations. Automotive-grade formulations must combine low-temperature mobility with high-temperature stability across 10-year product warranties, driving demand for high-purity solvents and multi-additive packages. However, energy-storage installations are the fastest-growing outlet, charting a 17.25% CAGR through 2031. Residential solar-plus-storage systems and utility-scale BESS require electrolytes tuned for deep-cycle durability and wider operating-temperature windows, broadening specification diversity. Consumer electronics represent a smaller slice but exert an outsized influence on the adoption of fast-charging additives, which later migrate to EV packs. Industrial, marine, and aerospace niches create small-volume, high-margin demand for customized blends with extreme-environment tolerances.
The widening spread of application profiles fragments volume pools. Commodity producers focus on high-throughput EV demand, whereas specialty formulators craft differentiated solutions for stationary storage and harsh-duty verticals. This bifurcation raises switching barriers and embeds long-term customer relationships, shaping competitive dynamics in the battery electrolyte market.
Geography Analysis
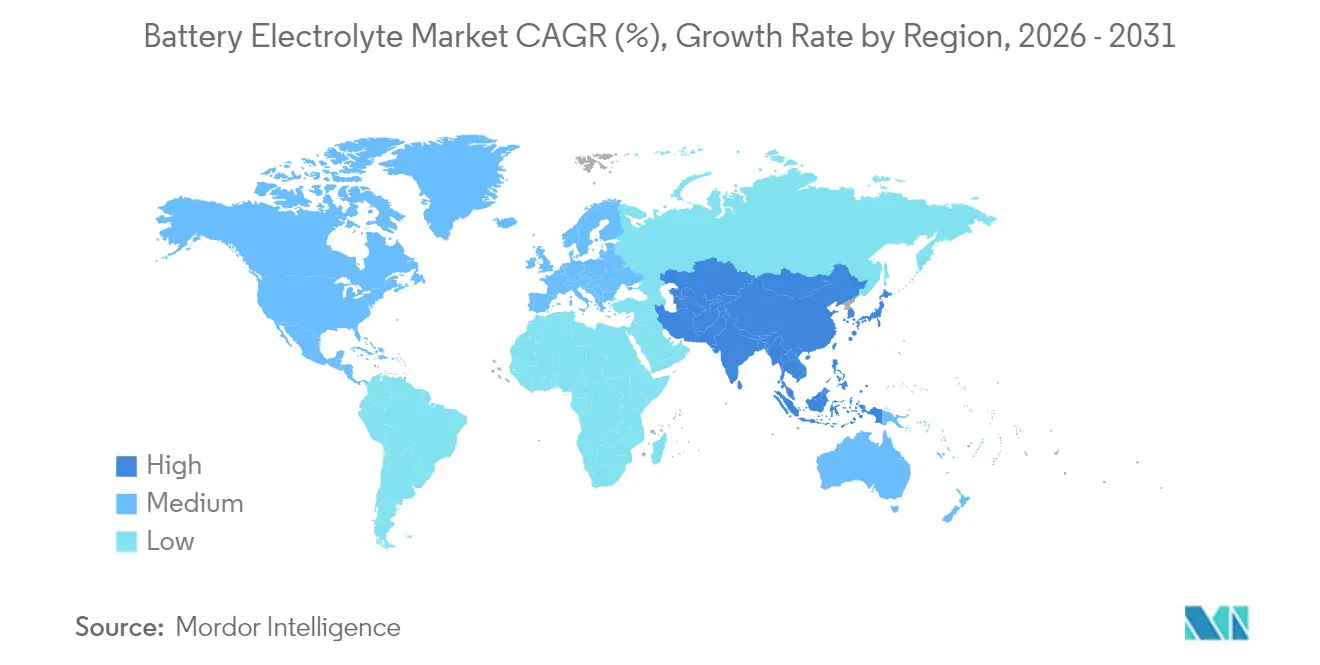
Asia-Pacific captured 69.65% of 2025 revenue and is growing at a 13.97% CAGR, supported by dense supply chains, state incentives, and proximity to cathode and separator plants. China alone controls more than 60% of global electrolyte capacity through firms such as Tinci and Capchem, enabling export strategies that flood international buyers with competitively priced products. Japan and South Korea focus on high-performance grades for premium batteries, while India courts cost-sensitive producers with Production-Linked Incentive schemes. Technology leadership in sodium-ion and solid-state prototypes remains concentrated in East Asia, indicating that the region will continue to set chemistry roadmaps even as other continents localize volumes.
North America is racing to build domestic capacity following the passage of the Inflation Reduction Act. Capital commitments include UBE’s 50,000 t Louisiana plant and several carbonate-solvent expansions in Texas and Ohio. Canada contributes to emerging lithium refining hubs, and Mexico provides assembly proximity that reduces logistics costs for U.S. automakers. Success depends on narrowing cost gaps—currently 15-25%—with Asian incumbents, while meeting strict automotive quality metrics. The U.S. Department of Energy projects a six-fold increase in storage deployment by 2035, a demand wave that domestic plants must be prepared to supply.
Europe anchors its strategy in sustainability. The EU Battery Regulation 2023/1542 requires recycled-content quotas and life-cycle disclosures, prompting chemical manufacturers to invest in closed-loop processes and low-carbon production powered by renewable energy. IPCEI-backed gigafactories are expected to reach 400 GWh of annual cell capacity by 2030, which translates to a multi-hundred-kiloton electrolyte demand. BASF, Solvay, and newcomer FUCHS-E-Lyte are scaling regional plants with an eye on high-value specialty blends that can command margin premiums despite elevated utility costs. Circular-economy mandates facilitate aggressive electrolyte recycling targets—80% lithium recovery by 2031—opening ancillary revenue streams for chemistry suppliers that vertically integrate recycling operations.

Regulatory Landscape
Regulation is tightening around battery sustainability, traceability, and chemical content, and this is affecting electrolyte formulations and qualification timelines. In the European Union, the EU Battery Regulation 2023/1542 (with amendments including Regulation (EU) 2025/1561) strengthens supply-chain due diligence requirements for key raw materials (cobalt, natural graphite, lithium, and nickel) and reinforces marking and information obligations, with a 10 April 2026 corrigendum clarifying marking requirements. As a result, electrolyte suppliers serving EU cell plants face higher documentation and compliance burdens, particularly as customers pursue battery passport-style disclosure and recycled-content pathways.
Outside the EU, national standards and safety frameworks for lithium-ion systems are becoming more prescriptive. China issued an industry standard (T/CIET 624-2024, effective 28 August 2024) that sets technical requirements for lithium-ion battery electrolyte, including purity and inspection rules, reinforcing quality benchmarking for producers supplying domestic gigafactories. In the United States, the Department of Energy announced a Notice of Funding Opportunity on 13 March 2026 aimed at strengthening domestic critical materials recycling and component manufacturing, tying public support to localized, compliant supply chains and increasing focus on electrolyte recovery and reformulation programs as fluorinated solvent restrictions come into view.
Competitive Landscape
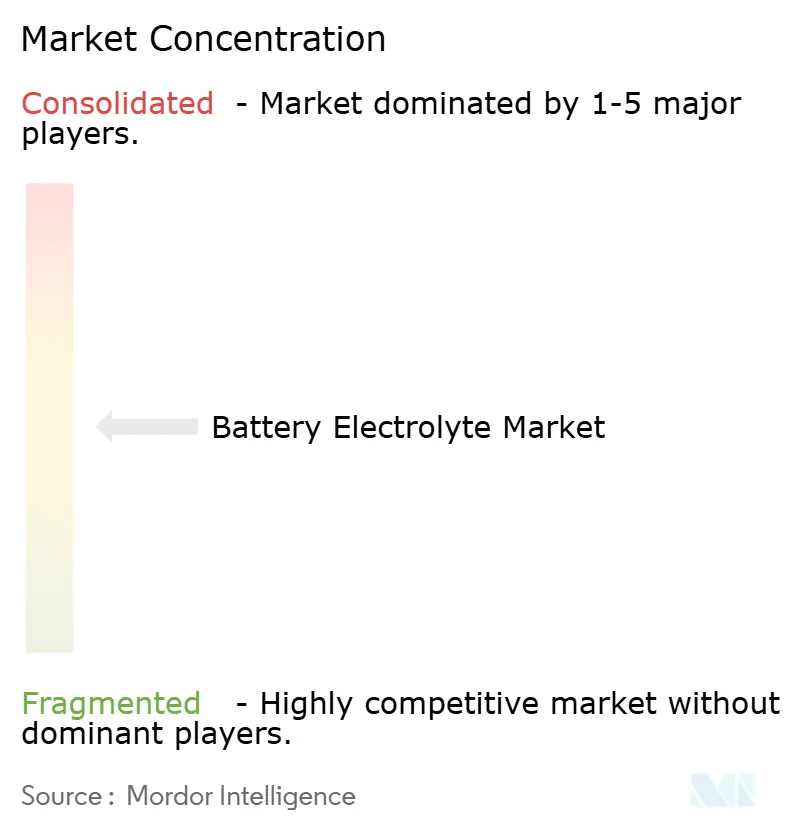
The battery electrolyte market shows moderate concentration. The top five producers—Tinci, Capchem, Mitsubishi Chemical Group, Mitsui Chemicals, and Shenzhen Capchem—collectively account for nearly 60% of the global volume. Vertical integration into solvent precursors and lithium-salt production underpins cost leadership. Larger incumbents leverage deep R&D benches to tailor additive packages, creating high technical-service stickiness with cell makers. Specialty entrants differentiate through IP ownership in solid-state, fluorine-free, or low-viscosity formulations, often monetizing technology via joint development agreements.
Technology race intensity is rising. Intellectual property surrounding high-voltage additives and sulfide powders grants early-mover leverage, yet also spurs cross-licensing and litigation. Corporate activity underscores this trend: Rio Tinto’s acquisition of Arcadium Lithium strengthens upstream resource security, UBE’s U.S. carbonate-solvent facility connects raw-material access with regional demand, and VRB Energy’s vanadium flow hub cements a position in long-duration storage. Government funding, especially from the U.S. DOE Advanced Battery consortium, accelerates the development of pilot lines in solid-state electrolytes, lowering capital-barrier thresholds for domestic start-ups.
Competitive positioning is shifting from bulk-volume advantage to formulation sophistication. Suppliers that master multi-chemistry portfolios, rapid qualification processes, and closed-loop recycling will command premium market positions as customers seek turnkey, regionally compliant sourcing partners.
Battery Electrolyte Industry Leaders
Targray Industries Inc.
3M Co.
Shenzhen Capchem Technology Co. Ltd
Ube Industries Ltd.
Mitsubishi Chemical Holdings Corporation
- *Disclaimer: Major Players sorted in no particular order

Market Opportunities and Future Outlook
Electrolyte supply-chain localization is opening opportunities for regional, small-to-medium batch production, faster customer qualification support, and compliant formulations aligned to domestic-content and sustainability requirements. In North America, Orbia Fluor & Energy Materials completed a major capacity expansion in December 2025 at its custom electrolyte facility in Madison, Wisconsin, raising output by roughly 300% and highlighting demand for domestic, flexible manufacturing that can support specialty and development-stage programs alongside high-volume EV demand.
In Europe, incremental capacity additions and procurement moves point to opportunities in cost-competitive EV segments and long-term offtake structures. Enchem outlined an April 2026 strategy aimed at mid- and low-priced European EV programs, supported by stated total capacity of 200,000 tons across Poland and Hungary, while large cell makers tighten supplier integration through multi-year volume commitments. CATL signed long-term electrolyte supply agreements in June 2026 with Yongtai Technology and Shenzhen Capchem covering a combined 770,000 tons for 2026-2028, favoring suppliers that can deliver consistent volumes along with high-voltage and next-generation additive systems. Separately, solid-state commercialization in China is being pushed through standards-led timelines, with a national EV solid-state battery standard entering a public comment phase through 31 August 2026, which encourages electrolyte producers to align materials, safety testing, and validation protocols ahead of wider product qualification cycles.
Recent Industry Developments
- June 2026: Shenzhen Capchem announced a three-year procurement and sales agreement with CATL covering 300,000 tons of electrolyte, with scheduled deliveries rising from 50,000 tons in 2026 to 150,000 tons in 2028. The deal improves Capchem's volume visibility and deepens supplier integration with a leading cell maker, reinforcing the role of long-term offtakes in securing upstream materials and supporting capacity planning.
- May 2025: MU Ionic Solutions signed a patent licensing agreement with CATL for its difluorophosphate-based cathode interfacial control technology (MP1 Technology) for lithium-ion batteries. The agreement formalizes technology transfer into high-volume manufacturing pathways and supports the use of additive packages intended to improve high-voltage stability and cycle life.
- December 2024: FUCHS and E-Lyte jointly inaugurated an electrolyte solutions production plant in Kaiserslautern, Germany, with annual capacity of 20,000 tons. The facility adds a European production footprint for electrolyte blends and supports regional sourcing strategies under tightening EU sustainability and transparency requirements.


Research Methodology Framework and Report Scope
Market Definition and Coverage
This market covers the value of battery electrolyte materials that enable ion movement inside a battery, including liquid, gel, and solid formats used across major battery chemistries and end uses.
Scope exclusions: We exclude battery cells, packs, BMS, separators, electrodes, and electrolyte additives sold as standalone products when they are not priced as part of electrolyte supply.
Segmentation Overview
- By Battery & Electrolyte Type
- Lead-acid
- Liquid
- Gel
- Lithium-ion
- Liquid
- Gel
- Solid
- Flow Batteries
- Vanadium
- Zinc-bromide
- Other Chemistries (Na-ion, Zn-air, etc.)
- Lead-acid
- By End User
- Electric Vehicles
- Energy Storage (Grid, C&I, Residential)
- Consumer Electronics
- Industrial and Specialty
- By Geography
- North America
- United States
- Canada
- Mexico
- Europe
- Germany
- United Kingdom
- France
- Italy
- NORDIC Countries
- Russia
- Rest of Europe
- Asia-Pacific
- China
- India
- Japan
- South Korea
- ASEAN Countries
- Rest of Asia-Pacific
- South America
- Brazil
- Argentina
- Rest of South America
- Middle East and Africa
- Saudi Arabia
- United Arab Emirates
- South Africa
- Egypt
- Rest of Middle East and Africa
- North America
Data Sources, Market Sizing, and Validation
Desk Research
Desk work starts by mapping the demand pool for batteries and then translating that into electrolyte consumption and pricing. We rely on open datasets such as IEA battery and EV statistics, USGS minerals summaries, UN Comtrade trade flows for key solvent and salt categories, and OECD plus national statistical offices for industrial output and price series. For chemistry shifts and safety requirements, we also reference sources such as IEC and ISO publications, patents databases, and peer reviewed electrochemistry journals to track what moves from lab to scaled supply.
To keep the model grounded, we layer in public company filings, annual reports, investor presentations, and customs and port authority releases where available, and reputable industry press for capacity and expansion signals. In a few places, paid subscriptions supporting company financials and intelligence, patents, and shipment-level trade screening were used to cross-check production footprints and timing assumptions. The source list above is illustrative only, and many other public and paid references were used for data collection, validation, and clarification.
Primary Interviews and Surveys
Primary inputs were gathered through expert interviews and structured surveys with battery material suppliers, battery and cell manufacturing teams, and procurement and engineering functions in key end use sectors like EV and stationary storage. We covered APAC, EMEA, and the Americas so regional pricing pressure, supply tightness, and regulation-driven chemistry changes could be compared. Follow-up calls were used to close gaps where desk research could not confirm assumptions, especially around electrolyte intensity and pricing conventions.
Distribution of primary research fieldwork respondents
| Company type | Respondent position | Region |
|---|---|---|
| Top tier: 32% | CXOs: 12% | APAC: 45% |
| Mid tier: 53% | Functional/Unit leaders: 31% | EMEA: 32% |
| Smaller Players: 15% | Managers: 57% | Americas: 23% |
Market-Sizing & Forecasting
Sizing was built using a top-down demand reconstruction where battery production and deployment indicators were translated into electrolyte volumes by chemistry and format, and then valued using region specific average pricing. Because published battery counts do not always capture the full materials story, we used selective bottom-up checks such as sampled supplier capacity, typical utilization bands, and ASP x volume sanity checks at the chemistry level to adjust totals when implied consumption looked off.
Key inputs included battery production by application (EV, consumer electronics, industrial, and energy storage), electrolyte intensity per kWh or per unit by chemistry, shifts between liquid and solid or gel formulations, purity-driven cost premiums, and trade and freight signals that affect delivered pricing. Forecasts were produced using scenario analysis tied to EV and storage buildout, announced capacity additions, and expected policy and safety changes that affect electrolyte selection. Where direct data was missing for smaller chemistries, we derived ratios from comparable applications and then reviewed the approach with interviewees before carrying them into the forecast.
Data Validation & Update Cycle
Validation is done by checking whether implied electrolyte volumes align with independent battery production signals, trade flows for relevant input materials, and observed pricing ranges in major regions. Outliers are reviewed in a second analyst pass, and when a variance remains large, assumptions are re-checked and experts are re-contacted so the driver behind the gap is clearly understood.
The model is refreshed annually, with interim updates when a material event occurs such as a major capacity start-up, a regulation change, or a clear pricing shock in key inputs. Before delivery, we run a final review to confirm that the latest public releases and interview notes are reflected in the market size and forecast.
Mordor Intelligence's Battery Electrolyte Market Size Compared With Other Published Estimates
Published market sizes for battery electrolytes often differ because groups do not always count the same chemistry set, they use different price build ups, and they refresh adoption assumptions at different points in the year. Some also anchor totals to either an EV heavy view or a broader battery demand pool, which changes the starting point quickly.
The bigger gaps usually come from whether solid state and polymer variants are treated as a near term market or left mostly for future years, and from how electrolyte is valued across regions when solvent and salt prices move. Currency conversion timing, the treatment of captive supply, and whether flow battery electrolytes are fully included can also shift the final value by a noticeable margin.
Across these items, the comparison is best read as a scope and timing difference, not a single methodological mistake.
Benchmark comparison
| Source | Market Size | Gaps in Research Methodology |
|---|---|---|
| Mordor Intelligence | USD 14.06 B (2025) | |
| Industry Publisher A | USD 13.67 B (2025) | Uses a different base year buildup and a broader application split that can smooth regional ASP differences, which tends to lower the 2025 value when input price spikes are averaged out. |
| Research Firm B | USD 12.10 B (2024) | Anchors the current value one year earlier and mixes in additional electrolyte types and end uses in its segmentation, so year alignment and scope blending make direct like for like comparison difficult. |
The spread in the table is mainly explained by year alignment and the way chemistry and application inclusion is handled, rather than by arithmetic errors. By keeping flow battery electrolytes inside scope only when they are commercially deployed and tying regional ASP movement to observed input price signals, the estimate stays closer to an actionable demand pool, a modeling choice applied by Mordor Intelligence.


Key Questions Answered in the Report
What is the current value of the battery electrolyte market?
The battery electrolyte market size reached USD 14.06 billion in 2025 and is projected to more than double to USD 28.72 billion by 2031.
Which chemistry type dominates electrolyte demand today?
Lithium-ion electrolytes held 81.74% of the battery electrolyte market share in 2025 owing to entrenched gigafactory capacity and established automotive performance benchmarks.
Why are sodium-ion and zinc-air systems gaining interest?
These chemistries rely on abundant raw materials, easing supply-chain pressures and supporting a 22.1% CAGR for non-lithium electrolytes through 2031.
How is policy influencing electrolyte supply chains?
The U.S. Inflation Reduction Act and EU Battery Regulation 2023/1542 mandate local content and transparency, driving new regional plants and accelerating recycling initiatives.
What impact do PFAS restrictions have on electrolyte formulations?
Pending EU and U.S. rules could phase out key fluorinated solvents by 2026, prompting costly reformulations and boosting R&D into fluorine-free additives.
Who are the leading companies in the battery electrolyte market?
Major players include Tinci, Capchem, Mitsubishi Chemical Group, and UBE Corporation, all of which combine large-scale production with specialized formulation capabilities.
Page last updated on:


 Your data is secure and never sold or shared.


