
Barcode Printer Market Size and Share
Market Overview
| Study Period | 2020 - 2031 |
|---|---|
| Market Size (2026) | USD 4.9 Billion |
| Market Size (2031) | USD 5.98 Billion |
| Growth Rate (2026 - 2031) | 4.05 % |
| Fastest Growing Market | Asia Pacific |
| Largest Market | North America |
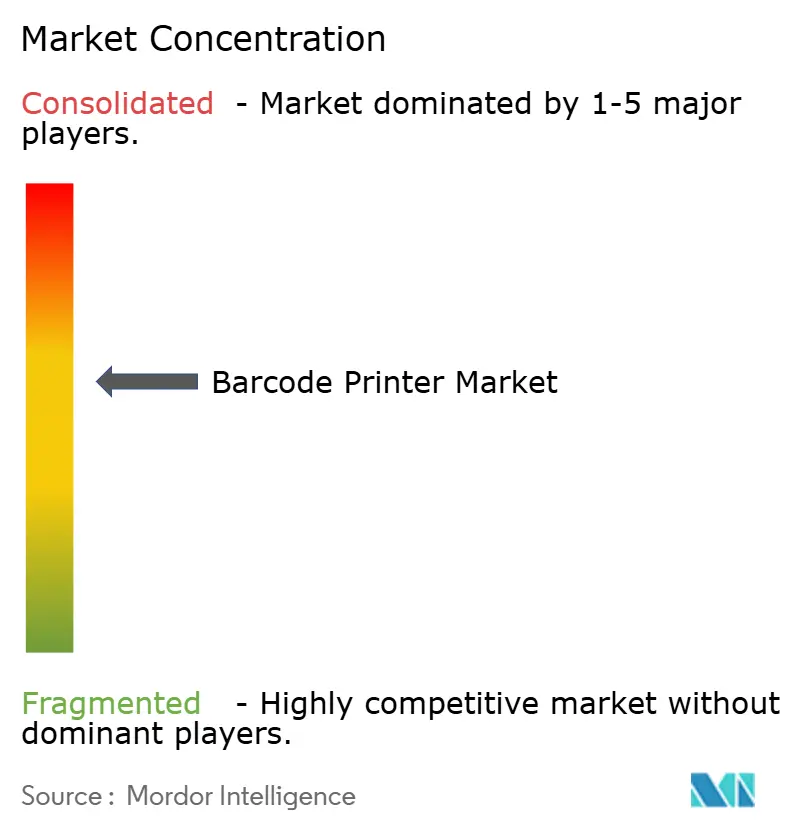
| Market Concentration | Medium |
Major Players *Disclaimer: Major Players sorted in no particular order Image © Mordor Intelligence. Reuse requires attribution under CC BY 4.0. | |
Barcode Printer Market Analysis by Mordor Intelligence
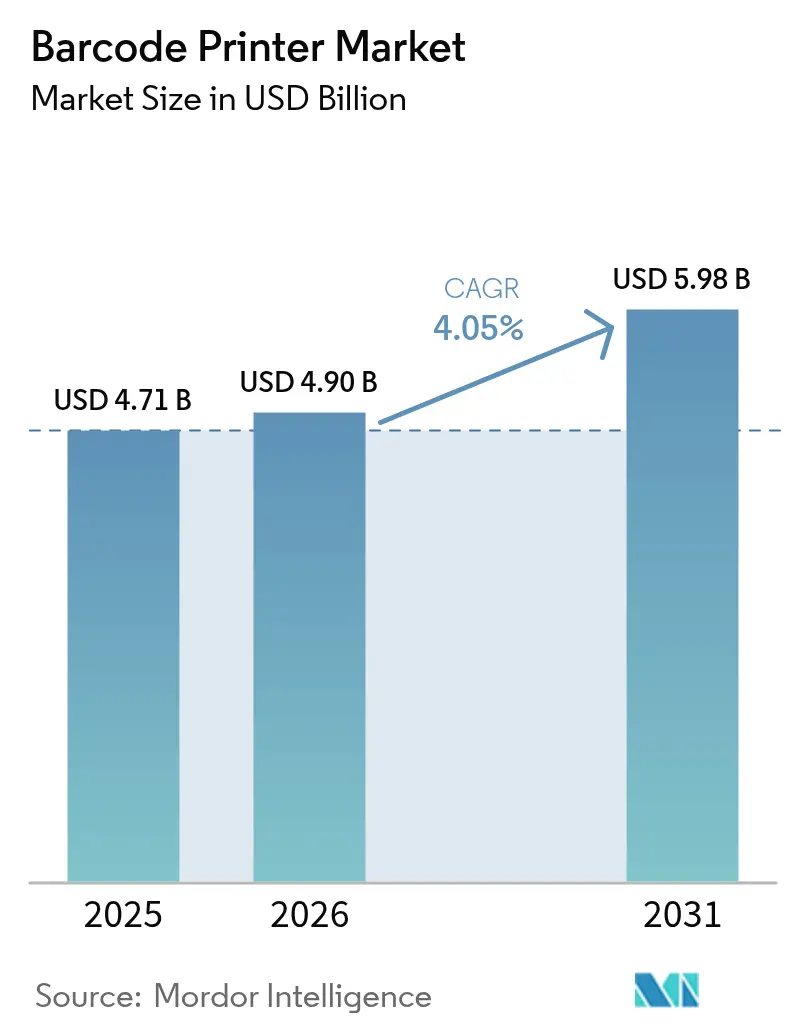
The barcode printer market size is expected to grow from USD 4.71 billion in 2025 to USD 4.9 billion in 2026 and is forecast to reach USD 5.98 billion by 2031 at 4.05% CAGR over 2026-2031. This growth reflects steady corporate investment in automation and supply chain digitization that keeps demand resilient even as the sector enters a more mature phase. Expanding traceability mandates in healthcare and food, the acceleration of omnichannel retail, and the need for serialized production data inside smart factories all sustain procurement budgets. Thermal transfer technology continues to anchor the barcode printer market because it supports durable labels for compliance‐critical environments, yet direct thermal printers are gaining ground because users prefer their lower consumable costs and simplified workflows. Industrial printers remain the workhorse of global manufacturing sites, but mobile units are now the clear growth engine as last-mile delivery networks and field service organizations pursue real-time labeling. Competitive intensity is rising as Chinese manufacturers scale up and challenge incumbents on price, forcing established brands to double down on software integration and specialized service offerings.
Key Report Takeaways
- By product type, industrial printers led with 56.60% revenue share in 2025, while mobile printers are projected to expand at a 5.95% CAGR to 2031.
- By printing technology, thermal transfer captured 60.45% of the barcode printer market share in 2025; direct thermal is advancing at a 6.42% CAGR through 2031.
- By end-user industry, manufacturing accounted for 34.10% share of the barcode printer market size in 2025, whereas healthcare is growing the fastest at 5.12% CAGR to 2031.
- By geography, North America held 31.40% of the barcode printer market in 2025, and Asia-Pacific is set to post the quickest regional CAGR at 4.72% to 2031.
Note: Market size and forecast figures in this report are generated using Mordor Intelligence’s proprietary estimation framework, updated with the latest available data and insights as of 2026.
Market Trends and Insights
Drivers Impact Analysis of Barcode Printer Market*
| Driver | (~) % Impact on CAGR Forecast | Geographic Relevance | Impact Timeline |
|---|---|---|---|
| Omnichannel retail and e-commerce logistics boom | +1.2% | North America and Asia-Pacific | Medium term (2-4 years) |
| Industry 4.0 smart-factory adoption of AIDC | +0.9% | Germany, China, United States | Long term (≥4 years) |
| Cold-chain traceability in healthcare and food | +0.8% | North America and EU | Short term (≤2 years) |
| Mobile and wearable printers boosting field productivity | +0.6% | Developed markets worldwide | Medium term (2-4 years) |
| Cloud-native remote print management | +0.4% | Global enterprises | Medium term (2-4 years) |
| Adoption of linerless labeling for ESG goals | +0.3% | EU then North America | Long term (≥4 years) |
| Source: Mordor Intelligence | |||
Omnichannel retail and e-commerce logistics boom
Retailers that manage unified inventories across multiple channels need labels printed in real time at fulfillment sites to cope with seasonal demand swings. American Eagle Outfitters lifted carton reading accuracy to 99% after installing image-based solutions in its 1.65 million sq ft Pennsylvania distribution center, illustrating how higher scan rates feed back into precise print requirements.[1]Cognex, “Hazleton Distribution Center Case Study,” cognex.com Blue Sky Distribution recorded 100% order accuracy and an 80% jump in fulfillment efficiency once it synchronized on-demand printing with routing software, which cut single-day delivery errors as orders rose 70%. Retailers now deploy mobile printers on picking carts to remove stationary bottlenecks, enhancing flexibility on warehouse floors. Demand for cloud oversight is also rising so that IT teams can manage firmware and security patches remotely. These needs push the barcode printer market toward devices that are wireless, rugged, and serviceable through centralized dashboards.
Industry 4.0-driven smart factories adopting AIDC
Smart factories rely on automated identification and data capture to link production assets directly with ERP and MES platforms. Zebra’s FS42 fixed scanner integrates neural processing to inspect codes and feed AI models that flag defects on the line. When barcode printers relay serial numbers to plant networks, they enable predictive maintenance programs that rely on component IDs. Brady Corporation observed that automated data entry based on printed codes can eliminate up to 90% of manual typing errors while increasing lifting efficiency by 40%. Manufacturers therefore specify printers that support industrial protocols, edge computing, and high-volume throughput. The result is sustained hardware refresh cycles despite the broader slowdown in capital expenditure across sectors.
Cold-chain traceability demand in healthcare and food
The FDA FSMA 204 Final Rule obliges brand owners to maintain end-to-end records for high-risk foods, and QR codes are now common carriers of such data. Healthcare regulators in more than 70 countries mandate GS1 DataMatrix codes for medical devices, accelerating printer upgrades that can deliver micro-barcodes on constrained label real estate.[2]GS1, “Global UDI and Sunrise 2027 Initiatives,” gs1.org Cold environments expose labels to moisture and sub-zero temperatures, so buyers demand thermal transfer ribbons rated for −40 °C operation. Pharmaceutical serialization rules require higher print resolution to keep readability on small vials. All these mandates dampen cyclical swings, providing the barcode printer market with a reliable baseline of compliance-driven demand.
Mobile and wearable barcode printers enhancing field productivity
Technicians who maintain telecom towers, utilities, or hospital equipment need to print asset tags on site. Mobile printers paired with enterprise mobility software allow labels to post directly into backend systems, cutting transcription errors. Zebra’s ZQ600 Plus adds Wi-Fi 6 and sizeable batteries to extend shift length in hospitals and retail back-rooms without swaps. At the point of care, nurses print wristbands that reduce patient misidentification, which remains a top sentinel event. Wearable printing accessories now let workers keep both hands on tools while generating labels, opening new productivity thresholds. The pattern strengthens the perception that portability is an intrinsic capability rather than an optional add-on in the barcode printer market.
Restraints Impact Analysis of Barcode Printer Market*
| Restraint | (~) % Impact on CAGR Forecast | Geographic Relevance | Impact Timeline |
|---|---|---|---|
| Supply volatility and price swings for thermal printheads | −0.8% | Asia-Pacific sourcing hubs | Short term (≤2 years) |
| Migration to QR / RFID reducing basic barcode volume | −0.6% | Retail and logistics globally | Medium term (2-4 years) |
| Tightening e-waste directives lifting lifecycle costs | −0.4% | EU extended globally | Long term (≥4 years) |
| Direct-part marking replacing labels in harsh plants | −0.3% | Heavy industry worldwide | Medium term (2-4 years) |
| Source: Mordor Intelligence | |||
Supply volatility and price swings for thermal printheads
Tariffs and rising input prices pushed thermal paper costs up by double digits in 2024.[3]POS Supply Solutions, “Thermal Paper Pricing Update 2024,” possupply.com Printhead fabrication is concentrated among a handful of specialist plants in East Asia, and replacement heads wear 25-50% faster in direct thermal modes than in thermal transfer settings. OEMs must stock larger buffers, elevating working capital needs and pushing end-user prices higher. Some projects have slipped because buyers wait for component costs to normalize. Longer term, manufacturers are evaluating multi-supplier strategies, yet the capital barrier keeps supply diversity modest.
Migration toward QR / RFID reducing basic barcode demand
GS1’s Sunrise 2027 roadmap encourages retailers to move toward omnipresent 2D codes that hold more data and can serve consumer engagement. Tesco and beverage brands already pilot QR labels that convey provenance plus recycling instructions. Zebra showcased an enterprise mobile phone with embedded RFID to enable contactless scans in stores, shifting some identification events away from printed media. While 2D and RFID growth still requires specialty label stock, legacy 1D symbologies lose page share on shipping cartons. The net effect trims unit volume for entry-level printers, though it also pushes the barcode printer market toward higher resolution heads and media versatility.
*Our forecasts treat driver/restraint impacts as directional, not additive. The impact forecasts reflect baseline growth, mix effects, and variable interactions.
Barcode Printer Market Segment Analysis
By Product Type:
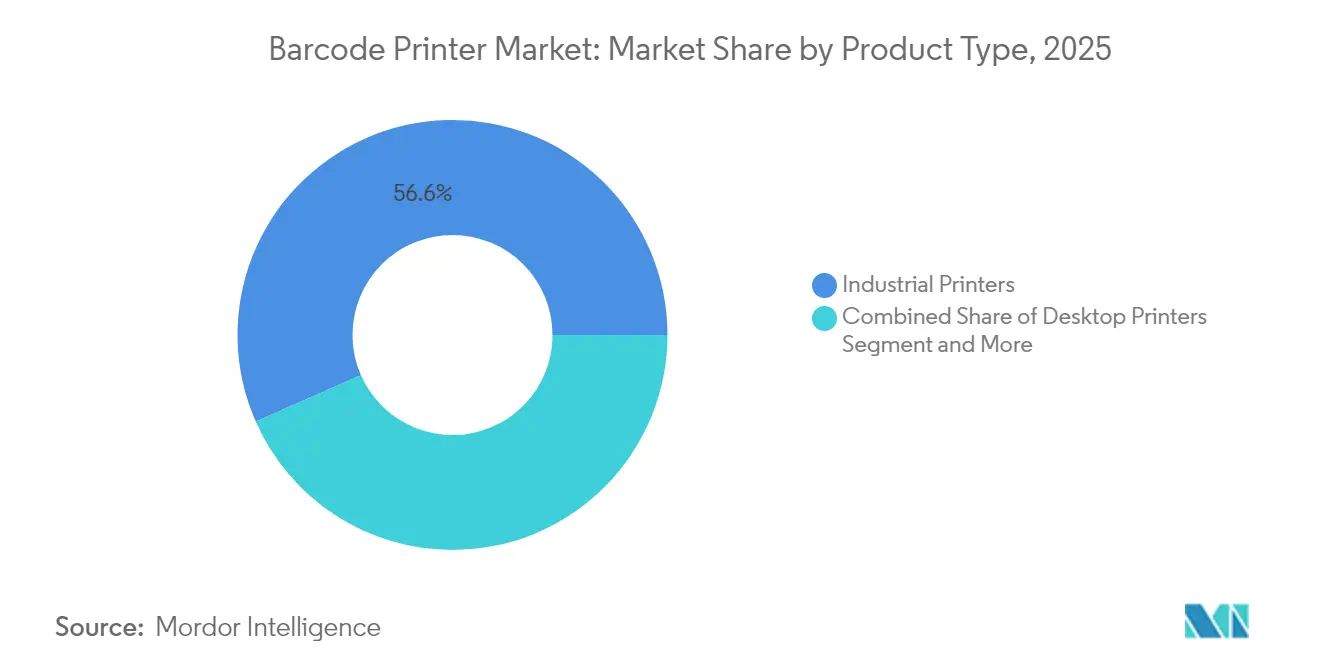
Industrial Dominance Faces Mobile DisruptionIndustrial printers produced the highest revenue in 2025 by securing 56.60% of the barcode printer market. These devices deliver wide media widths, steel chassis, and duty cycles that exceed 24-hour operation, which manufacturers and logistics hubs value for uptime. SATO’s CL4NX Plus prints at 14 ips while tracking head wear in firmware, ensuring predictive part replacement. Nonetheless, mobile units record a 5.95% CAGR to 2031 as gig-economy couriers, field engineers, and in-store pickers seek lightweight devices that roam with workers. The barcode printer market size for mobile models is projected to expand from USD 1.02 billion in 2025 to USD 1.44 billion by 2031, indicating that portability is redefining customer expectations. Desktop printers keep traction among small firms because they blend acceptable duty cycles with modest capex. Hybrid designs that mount industrial engines on cart platforms may blur product lines, suggesting future segmentation will hinge on workflow rather than form factor.
In volume terms, industrial printers still ship the largest absolute unit count because multi-line factories employ fleets for work-in-process tickets. However, price aggression by Chinese OEMs is compressing margins in the mid-tier. Mobile printer ASPs have proven more resilient because buyers prioritize battery life, wireless security, and drop resistance. Over the forecast, industrial SKU turnover will center on connectivity upgrades, Ethernet, Bluetooth 5, and WPA3, while mobile SKUs will compete on weight reductions and antimicrobial casings for healthcare. The coexistence of entrenched industrial demand with agile mobile adoption underscores how the barcode printer market can grow even as one segment matures.


By Printing Technology:
Thermal Transfer Leadership Under PressureThermal transfer held 60.45% of the barcode printer market share in 2025 because its resin ribbons yield labels that survive solvents, UV exposure, and deep freeze storage. Regulatory packaging in pharmaceuticals, chemicals, and aerospace depends on this durability. Yet direct thermal units post a 6.42% CAGR to 2031 because retailers and express carriers favor the lower consumable inventory. The barcode printer market size for direct thermal is forecast to reach USD 2.36 billion in 2031, narrowing the gap with thermal transfer. Users accept that images may fade under heat when parcels have a short life cycle.
Inkjet and laser options address color GHS hazard labels or extremely small 2D codes on electronics. Epson’s ColorWorks CW-C8000 meets high-volume color compliance needs in distribution centers. Linerless media, which omits silicone backing, is emerging across both thermal methods. Zebra reports that customers cut waste volumes by 30% after shifting to linerless rolls, aligning procurement with ESG targets zebra.com. Going forward, the selection of print technology will reflect media costs, image longevity, and sustainability mandates rather than generic preference, keeping competitive tension lively inside the barcode printer market.
By End-user Industry:
Healthcare Acceleration Challenges Manufacturing DominanceManufacturing controlled 34.10% of the barcode printer market in 2025 as Industry 4.0 roadmaps embedded AIDC into every process step. Automotive plants often run printers alongside PLCs so that each component is serialized upon assembly. However, healthcare logs the fastest 5.12% CAGR to 2031 because hospitals roll out point-of-care wristband printing and pharmacies equip blister packs with serialized 2D codes. The barcode printer market size tied to healthcare uses is on pace to climb from USD 0.62 billion in 2025 to USD 0.84 billion by 2031. Retail and logistics users remain steady adopters given sustained e-commerce volumes, while government agencies procure units during postal modernization programs. The mix shift toward regulated verticals means future products will need tamper-evident ribbons, antimicrobial plastics, and cybersecurity certifications.
Pharmaceutical factories sit at the intersection of manufacturing and healthcare. They require rugged printers that also comply with GMP environments. Brother’s mobile healthcare lineup illustrates how vendors tailor products with disinfectant-ready casings and Cerner validated drivers. Elsewhere, universities and local governments issue durable asset labels for IT inventories but, absent regulatory impetus, those orders seldom spark high growth. Segment divergence signals that vendors must deepen vertical specializations to protect margins.
Geography Analysis
North America Barcode Printer Market
North America retained 31.40% of the barcode printer market in 2025. Federal procurement, such as the United States Postal Service’s refresh of thousands of Zebra devices, anchors hardware volumes. Drug supply chain laws also oblige hospitals and pharmacies to invest in printers that handle GS1 DataMatrix media. Canada’s retail modernization and Mexico’s maquiladora exports further reinforce regional demand. The barcode printer market size for North America is estimated at USD 1.48 billion in 2025 and will edge toward USD 1.86 billion by 2031. Users in the region typically prioritize total cost of ownership, driving adoption of remote fleet management suites that schedule firmware updates without site visits.
APAC Barcode Printer Market
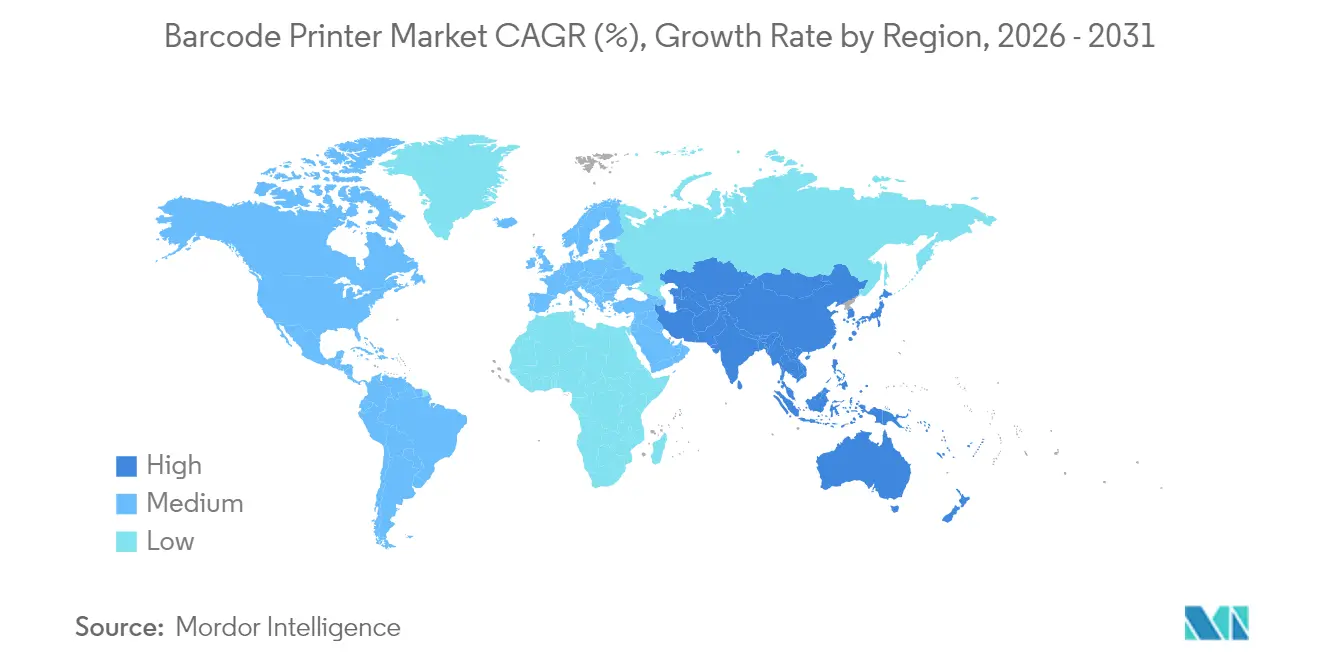
Asia-Pacific is the fastest-expanding arena with a 4.72% CAGR to 2031. China and India keep building new factories for consumer electronics and apparel, each requiring inline labeling for export. Gainscha operates over 40,000 sqm of manufacturing space and holds 50 thermal patents, underscoring indigenous capability gains. HPRT reports distribution in more than 80 countries, reflecting the global reach of Chinese brands. Japan advances Industry 4.0 integration in automotive plants, while Southeast Asia wins near-shoring that moves labeling equipment demand southward. The barcode printer market size in Asia-Pacific is projected at USD 1.33 billion in 2025 and should exceed USD 1.75 billion by 2031.

Regulatory Landscape
Regulatory and standards activity continues to shape barcode printer specifications toward higher traceability, 2D readability, and packaging-labeling harmonization. In the European Union, the Packaging and Packaging Waste Regulation, Regulation (EU) 2025/40 (PPWR), introduces harmonized packaging labeling requirements, with an application date highlighted for August 2026 in European Commission materials. This shifts the emphasis toward consistent print quality and symbol capability across packaging formats.
International standards published in 2026 also tighten technical expectations for machine-readable labeling on packages. ISO 22742:2026 sets requirements for linear bar codes and 2D symbols on product packages, while ISO 28219:2026 standardizes packaging, labeling, and product marking content and structure. These updates push global shippers and regulated industries to use printers that can reliably produce compliant 2D codes at scale. In the United States, labeling compliance frameworks such as FDA food labeling requirements (21 CFR Part 101) and ongoing FDA activity around front-of-package nutrition labeling keep label content complexity high, reinforcing demand for controlled, auditable labeling workflows rather than basic standalone printing.
Competitive Landscape
The barcode printer market exhibits moderate consolidation. Zebra, SATO, and Honeywell command sizable installed bases that let them bundle software, services, and media. Zebra’s push into generative AI on handhelds shows its intent to differentiate beyond mechanics. SATO enlarged global reach by acquiring Checkpoint’s BCS Group, doubling its regional capacity. Honeywell invests in Mobility Edge platforms that tie printers to rugged scanners for uniform device governance.
Chinese challengers pursue cost leadership and selective innovation. TSC Auto ID’s portfolio expanded when it bought Printronix, adding industrial models with PGL firmware that ease IBM midrange migrations. Gainscha and HPRT deliver competitive thermal engines to OEM partners, eroding incumbent share in entry tiers. Strategic moves also include vertical integration: ProMach’s purchase of Panther Industries folded print-and-apply automation into a broader packaging line. ERP vendors seek direct tie-ins: CYBRA linked its label design suite with Acumatica to sync printing and RFID tracking under one UI.
Service ecosystems play a critical role. Vendors now market annual subscription bundles that wrap device analytics, predictive maintenance, and consumables under one fee. Sustainability enters tender criteria as European buyers screen suppliers on recycler networks for spent ribbon cores. These trends encourage alliances between OEMs and specialized software or material firms, broadening competition beyond straight hardware.
Barcode Printer Industry Leaders
Zebra Technologies Corporation
Avery Dennison Corporation
Honeywell International Inc.
Toshiba Tec Corporation
Sato Holdings Corporation
- *Disclaimer: Major Players sorted in no particular order
Barcode Printer Market Companies Covered in this Report
- Zebra Technologies Corporation
- Sato Holdings Corporation
- Honeywell International Inc.
- Toshiba Tec Corporation
- Avery Dennison Corporation
- Seiko Epson Corporation
- TSC Auto ID Technology Co. Ltd.
- Brother Industries Ltd.
- Postek Electronics Co. Ltd.
- Primera Technology Inc.
- Bixolon Co. Ltd.
- Citizen Systems Japan Co. Ltd.
- Godex International Co. Ltd.
- Wasp Barcode Technologies
- Cab Produkttechnik GmbH and Co KG
- Printronix Auto ID Inc.
- Gainscha Technology Group Ltd.
- Domino Printing Sciences plc
- IDPRT (Xiamen Hanin Co. Ltd.)
- Datamax

Market Opportunities and Future Outlook
Whitespace is opening around 2D-code readiness and centralized coding software as retailers and brand owners shift from 1D barcodes to data-rich 2D symbols aligned with GS1 initiatives. The GS1 Sunrise 2027 program, which targets broad retail point-of-sale acceptance of 2D barcodes by the end of 2027, is feeding into procurement checklists for higher-resolution printing, code-quality control, and media flexibility across packaging and distribution operations. The publication of ISO 22742:2026 and ISO 28219:2026 also supports upgrades toward printers and labeling systems that can standardize symbol placement and content for global packaging lines.
The operational opportunity is concentrated in packaging-line and enterprise IT/OT integration, where coding hardware must pair with secure, remotely managed software to generate dynamic identifiers at speed. In 2026, Markem-Imaje launched CoLOS Version 7 to support secure integration with GS1 Digital Link and dynamic QR-code generation. LEIBINGER also unveiled its 2DJET coding system at interpack 2026 for GS1-compliant 2D code requirements, aimed at high-speed packaging environments. Domino introduced the Ux360i UV laser coder at interpack 2026 to support high-speed coding on heat-sensitive and recyclable packaging materials, which points to continued investment in versatile coding and verification capabilities alongside traditional barcode printing fleets.
Recent Industry Developments in Barcode Printer Market
- June 2026: Honeywell agreed to sell its Productivity Solutions and Services (PSS) business, which includes barcode printing solutions, to Brady Corporation for USD 1.4 billion. The transaction repositions a major barcode printing portfolio under a focused identification and workplace-safety supplier, reshaping competitive dynamics across industrial labeling, data capture, and workflow software.
- June 2026: Avery Dennison launched Pathfinder Edge, a handheld label printer line for retail and logistics that combines printing with integrated scanning. The move targets mobile-first workflows in stores and distribution centers where on-demand labeling and verification reduce pick-and-pack friction and support omnichannel execution.
- July 2025: Xerox completed its USD 1.5 billion acquisition of Lexmark, creating a broader print solutions supplier with 125 facilities across 16 countries. The deal expands the installed base and service reach of enterprise print infrastructure, increasing cross-sell potential for managed print and labeling-adjacent workflows in global commercial environments.


Barcode Printer Market Report Scope and Research Methodology
Market Definition and Coverage
The barcode printer market covers dedicated hardware used to print barcodes on labels, tags, or similar media that are then applied to physical items for identification and tracking. Revenue is counted from sales of barcode printers across major end-user settings and regions.
Scope exclusions: This sizing excludes barcode scanners, labeling software sold on a standalone basis, and label stock, ribbons, and other consumables.
Segments Covered in This Report
- By Product Type
- Desktop Printers
- Mobile Printers
- Industrial Printers
- By Printing Technology
- Thermal Transfer
- Direct Thermal
- Laser
- Inkjet
- Others
- By End-user Industry
- Manufacturing
- Automotive
- Electronics
- Food and Beverage
- Others
- Retail
- Transportation and Logistics
- Healthcare
- Other End-user Industries
- Manufacturing
- By Geography
- North America
- United States
- Canada
- Mexico
- South America
- Brazil
- Argentina
- Rest of South America
- Europe
- Germany
- United Kingdom
- France
- Italy
- Russia
- Rest of Europe
- Asia-Pacific
- China
- Japan
- India
- South Korea
- Rest of Asia-Pacific
- Middle East and Africa
- Middle East
- GCC
- Turkey
- Israel
- Rest of Middle East
- Africa
- South Africa
- Nigeria
- Kenya
- Rest of Africa
- Middle East
- North America
Data Sources, Market Sizing, and Validation
Desk Research
Desk work started by building a simple fact base on where barcode printing demand comes from and how purchasing typically happens across industries. We reviewed public sources such as US Census trade and manufacturing statistics, International Trade Centre trade maps, UN Comtrade customs series, US FDA UDI documentation, and GS1 standards publications to understand labeling rules and adoption.
To tighten assumptions, we also used company filings and earnings call transcripts, investor presentations, and reputable press coverage around automation, warehousing, and retail logistics. In addition, we selectively used paid subscriptions for company financials and intelligence, patents, and shipment level trade checks when a public series had gaps or mixed definitions. These desk sources are not exhaustive, and many other public and paid references were also used to collect data, validate it, and clarify open questions.
Primary Interviews and Surveys
Primary work focused on interviews and structured surveys with printer manufacturers, channel partners, system integrators, and large end users across manufacturing, retail, logistics, and healthcare. These respondent inputs were used to confirm shipment direction, pricing moves for desktop versus mobile versus industrial units, and how thermal transfer versus direct thermal configurations are shifting by region. We then used the same inputs to challenge any shipment and pricing assumptions that looked unusual in the initial model.
Distribution of primary research fieldwork respondents
| Company type | Respondent position | Region |
|---|---|---|
| Top tier: 38% | CXOs: 16% | APAC: 40% |
| Mid tier: 46% | Functional/Unit leaders: 39% | EMEA: 36% |
| Smaller Players: 16% | Managers: 45% | Americas: 24% |
Market-Sizing & Forecasting
Our model starts with a top-down build where production and trade signals, installed base replacement behavior, and adoption rates in key label-heavy industries are used to reconstruct the annual demand pool. These totals are then corroborated with selective bottom-up checks, such as sampled average selling price ranges by printer class and a roll-up of shipments discussed by suppliers and channel participants. This helps us adjust for overcounting and for regional mix differences.
Key inputs used in the model include the desktop versus mobile versus industrial unit mix, thermal transfer versus direct thermal share shifts, average selling price progression by printer class, warehouse and parcel handling growth indicators, and the pace of traceability and labeling compliance adoption in regulated sectors. When coverage is thin in smaller countries, gaps are handled through proxying from comparable economies using trade intensity and end-user footprint, and then validated through primary feedback.
For forecasting, scenario analysis is used, supported by expert views on how automation spend, omnichannel fulfillment needs, and replacement cycles may move over the next five years. Assumptions are kept visible so the model can be repeated and stress-tested when variables change.
Data Validation & Update Cycle
Validation is done through triangulation across multiple angles so that one noisy data point does not drive the outcome. We compare outputs with independent signals such as trade flows, public guidance on industrial demand, and pricing direction shared by market participants, and then investigate variances that do not match the expected pattern.
Before sign-off, the model goes through stepwise analyst reviews where assumptions, calculations, and conversions are rechecked, followed by targeted re-contacts when an anomaly cannot be explained. Reports are refreshed annually, and interim updates are made when material events occur, after which a final pre-delivery review is completed to reflect the latest available information.
Mordor Intelligence's Barcode Printer Market Estimate Compared With Other Published Estimates
Published market sizes for barcode printers do not always line up, even when they are all stated in USD and cover similar timeframes. Differences usually come from what is counted as a barcode printer sale, which year is treated as the base, and how pricing and unit mix are carried forward into the forecast.
By tracking unit mix and average selling price resets each year using channel feedback, Mordor Intelligence keeps the 2026 value focused on printer hardware revenue rather than broader labeling spend, which helps explain part of the spread seen across public estimates.
Benchmark comparison
| Source | Market Size | Gaps in Research Methodology |
|---|---|---|
| Mordor Intelligence | USD 4.90 B (2026) | |
| Industry Research Desk A | USD 4.74 B (2024) | Uses an earlier base year and a faster growth path through 2030, and it can also reflect wider technology inclusion and price escalation assumptions that are not always revalidated with channel checks. |
| Industry Research Desk B | USD 2.42 B (2024) | Often centers on manufacturer shipment and output reporting with narrower counting rules, which can miss parts of the channel-led commercial market and understate value when ASP and configuration mix shift upward. |
The table shows that year selection and what gets counted drive most of the gap, rather than a single math issue. When scope boundaries, ASP logic, and mix changes are made explicit and then checked with market participants, the result becomes easier to trace and to update as conditions evolve.


Key Questions Answered in the Report
What is the expected value of the barcode printer market in 2031?
The barcode printer market is projected to reach USD 5.98 billion by 2031 based on a 4.05% CAGR from 2026.
Which product segment shows the fastest growth through 2031?
Mobile printers are the quickest movers with a 5.95% CAGR as last-mile, field service, and point-of-sale applications expand.
Why is healthcare a high-growth vertical for barcode printers?
Patient safety regulations and pharmaceutical serialization rules drive hospitals and drug makers to adopt high-resolution, compliant printers, leading to a 5.12% CAGR in healthcare demand.
How does linerless labeling influence procurement decisions?
Linerless printers reduce material waste and lower disposal costs, helping European and North American firms meet sustainability goals while improving print throughput.
Page last updated on:


 Your data is secure and never sold or shared.


