
B2B Enterprise And Industrial Wearables Market Size and Share
Market Overview
| Study Period | 2020 - 2031 |
|---|---|
| Market Size (2026) | USD 26.05 Billion |
| Market Size (2031) | USD 87.56 Billion |
| Growth Rate (2026 - 2031) | 27.45 % |
| Fastest Growing Market | Asia Pacific |
| Largest Market | North America |
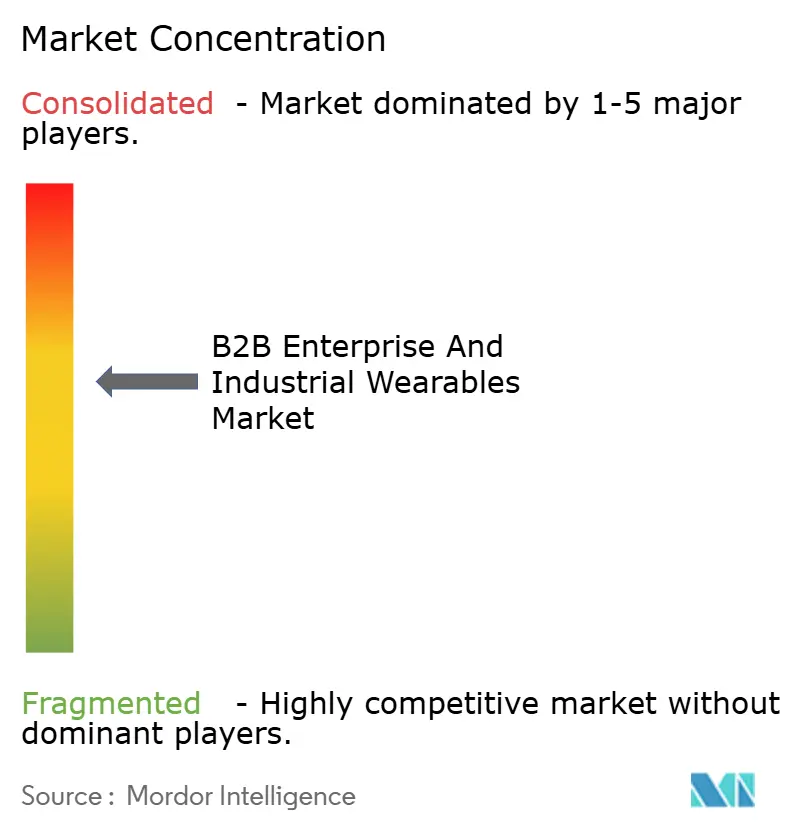
| Market Concentration | Medium |
Major Players *Disclaimer: Major Players sorted in no particular order Image © Mordor Intelligence. Reuse requires attribution under CC BY 4.0. | |
B2B Enterprise And Industrial Wearables Market Analysis by Mordor Intelligence
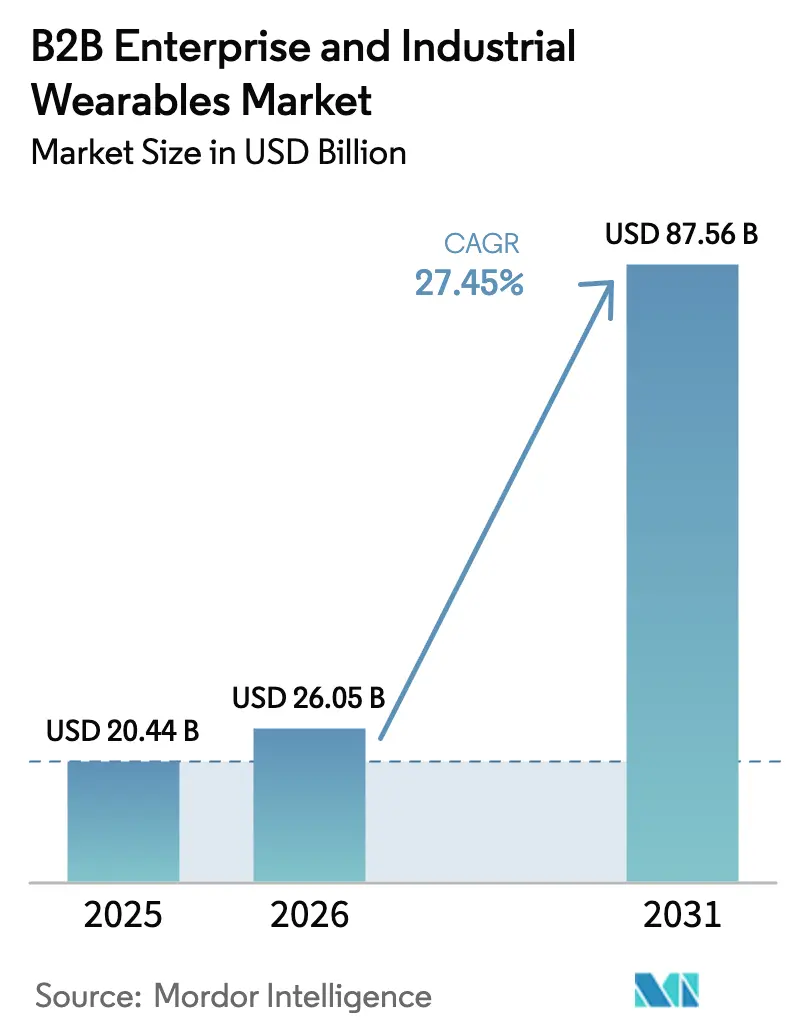
The B2B enterprise and industrial wearables market size was valued at USD 20.44 billion in 2025 and estimated to grow from USD 26.05 billion in 2026 to reach USD 87.56 billion by 2031, at a CAGR of 27.45% during the forecast period (2026-2031). The continued migration of compute power toward the edge, regulatory pressure for real-time worker safety, and private 5G rollouts are the primary catalysts driving this expansion. Industrial buyers now place greater emphasis on deterministic latency, data sovereignty, and battery-efficient AI inference than on headline display specifications. Early deployments in manufacturing, logistics, and healthcare are providing proof points that shorten purchase cycles, even as labor unions demand privacy controls that keep biometric data local. Component advances, such as 15 TOPS edge AI chipsets operating under 5 watts, are enabling all-day smart glasses and sensor-rich safety vests that occupants forget they are wearing. As software ecosystems mature, enterprises can deploy out-of-the-box AR workflows that integrate with ERP and CMMS platforms in weeks rather than quarters. Together, these forces push the B2B enterprise and industrial wearables market toward mainstream procurement budgets rather than discretionary innovation funds.
Key Report Takeaways
- By device type, smart glass led with a 31.02% revenue share in 2025, while smart clothing and body sensors are projected to post a 28.74% CAGR through 2031.
- By end-user industry, manufacturing held 27.95% of the 2025 base, whereas healthcare is forecast to expand at a 29.86% CAGR to 2031.
- By component, sensors accounted for 34.35% of 2025 revenue, and the segment is expected to grow at a 29.05% CAGR over the forecast period.
- By application, remote assistance and workflow guidance captured 26.42% of 2025 revenue, while predictive maintenance is anticipated to rise at a 30.10% CAGR through 2031.
- By connectivity technology, Bluetooth and BLE contributed 42.10% of 2025 revenue, with 5G and 5G RedCap projected to advance at a 30.25% CAGR.
- By geography, North America commanded a 39.65% share in 2025, whereas Asia-Pacific is set to post a 30.90% CAGR to 2031.
Note: Market size and forecast figures in this report are generated using Mordor Intelligence’s proprietary estimation framework, updated with the latest available data and insights as of 2026.
Market Trends and Insights
Drivers Impact Analysis of B2B Enterprise And Industrial Wearables Market*
| Driver | (~) % Impact on CAGR Forecast | Geographic Relevance | Impact Timeline |
|---|---|---|---|
| Growing App Ecosystem Fuels Enterprise Adoption | +4.8% | Global, with concentration in North America and Europe | Medium term (2-4 years) |
| Demand for Smart Factory Set-Ups | +5.2% | Asia-Pacific core, spill-over to North America and Europe | Long term (≥ 4 years) |
| Rapid Gains in 5G Stand-Alone and Private Networks | +4.5% | North America and Europe early, Asia-Pacific scaling | Medium term (2-4 years) |
| Edge AI Chips Reduce Latency and Power Budget | +3.9% | Global | Short term (≤ 2 years) |
| Regulatory Push for Workforce Safety Compliance | +3.6% | North America and Europe, emerging in Middle East | Short term (≤ 2 years) |
| Mainstreaming of Digital Twins in Heavy Industry | +3.4% | Global, with early gains in Germany, United States, Japan | Long term (≥ 4 years) |
| Source: Mordor Intelligence | |||
Growing App Ecosystem Fuels Enterprise Adoption
Enterprises increasingly judge wearables by how well the software stack integrates with existing ERP, MES, and CMMS workflows, rather than by display resolution or battery longevity. PTC’s Vuforia Studio now ships with over 200 modular AR workflows that can be deployed without custom code, shrinking pilot phases from months to weeks. Siemens’ Industrial Edge Marketplace extends similar plug-and-play logic to manufacturing execution environments, allowing plants to run the same workflow in parallel lines with minimal IT investment. At Boeing, AR guidance reduced wiring-harness assembly time by 25% and errors by 90%, providing the ROI clarity that finance groups require before funding fleetwide rollouts. [1] This pivot from bespoke development to API-first modules lowers switching costs, accelerates user onboarding, and solidifies the B2B enterprise and industrial wearables market as a line item in formal capital budgets, rather than an R&D curiosity.
Demand for Smart Factory Set-Ups
National programs such as China’s Made in China 2025 and India’s Production-Linked Incentive schemes earmark billions for automated production lines that rely on wearable-equipped technicians for exception handling and quality inspection. BMW’s Regensburg logistics team reported a 15% reduction in picking errors after smart-glass deployment, while Bosch feeds wearable sensor streams into its ConnectedWorld IoT platform to trigger predictive maintenance work orders. These use cases validate the thesis that wearables serve as the human-machine interface of Industry 4.0, linking physical assets to digital twins that simulate process changes before plant managers pull the trigger. As factories become data factories, demand for head-mounted displays, smart gloves, and biometric vests scales in lockstep.
Rapid Gains in 5G Stand-Alone and Private Networks
Ericsson cites sub-10 ms latency and four-nines uplink reliability in private 5G proofs of concept for automotive paint shops and chemical refineries. GSMA Intelligence reported a 40% increase in private 5G installations in 2024, with manufacturing and logistics accounting for 60% of that growth. [2]Unlike Wi-Fi, which struggles with RF interference in metal-dense halls, 5G RedCap offers deterministic performance at lower BOM costs, making it viable for sensor-rich wearables. Network slicing enables safety alerts to preempt video traffic, thereby satisfying OSHA mandates for real-time arc-flash detection. [3]The result is a connectivity backbone that elevates the B2B enterprise and industrial wearables market from pilot-scale to plant-wide roll-outs.
Edge AI Chips Reduce Latency and Power Budget
Qualcomm’s QCS6490 delivers 15 TOPS at under 5 watts, allowing smart glasses to execute computer-vision models on device and still last an entire shift. Bosch Sensortec’s BHI385 enables AI inference directly within the sensor hub, filtering out noise locally and transmitting only actionable events. On-premises processing sidesteps GDPR restrictions that complicate uploading biometric data to cloud endpoints. Lower latency and longer battery life translate into greater user satisfaction, addressing the wear fatigue complaints that doomed prior generation trials.
Restraints Impact Analysis of B2B Enterprise And Industrial Wearables Market*
| Restraint | (~) % Impact on CAGR Forecast | Geographic Relevance | Impact Timeline |
|---|---|---|---|
| Lack of Business-Grade Applications | -3.2% | Global | Medium term (2-4 years) |
| Data Security and Legacy IT Integration Issues | -2.8% | North America and Europe, emerging in Asia-Pacific | Short term (≤ 2 years) |
| High Up-Front TCO and Uncertain ROI | -2.5% | Global | Short term (≤ 2 years) |
| Worker Privacy and Wear Fatigue Concerns | -1.9% | Europe and North America | Medium term (2-4 years) |
| Source: Mordor Intelligence | |||
Lack of Business-Grade Applications
Many AR and workflow guidance suites remain pilot-grade, lacking essential features such as ISO 9001 audit trails, role-based access controls, or FDA 510(k) validations required for continuous vital-sign telemetry. Hospitals are often forced to rely on consumer-grade wearables that do not meet EHR interoperability requirements, leaving clinical staff to manually reconcile data. Fragmentation across Android, proprietary RTOS, and iOS platforms obliges IT to maintain parallel code bases, inflating ownership costs. EU-OSHA has warned that opaque data flows heighten psychosocial risks, a red flag for worker councils. Until software catches up with enterprise governance standards, adoption will lag hardware readiness.
Data Security and Legacy IT Integration Issues
CISA’s 2024 advisory cataloged multiple CVE vulnerabilities tied to wearable gateways in industrial control systems. The FDA now requires a software bill of materials for connected medical devices, adding months to product certification cycles. In brownfield factories, SCADA stacks predating Ethernet struggle to ingest wearable data, forcing middleware hacks that undermine reliability. The GDPR and the forthcoming EU AI Act necessitate data localization, which undermines cloud-centric architectures. Combined, these frictions slow procurement and temper the otherwise meteoric growth of the B2B enterprise and industrial wearables market.
*Our forecasts treat driver/restraint impacts as directional, not additive. The impact forecasts reflect baseline growth, mix effects, and variable interactions.
B2B Enterprise And Industrial Wearables Market Segment Analysis
By Device Type – Smart Glass Dominates as Smart Clothing Surges
Smart glass delivered 31.02% of 2025 revenue, underscoring its maturity in hands-free inspection and remote expert workflows. RealWear and Vuzix units meet IP67 ingress ratings and pair voice control with high-brightness micro-OLED optics, letting automotive line workers navigate manuals without removing gloves. The B2B enterprise and industrial wearables market size for smart glass is projected to expand at a healthy clip as next-generation optics lighten form factors and extend field of view. Yet, smart clothing and body sensors are poised for a 28.74% CAGR, reflecting regulatory moves to monitor heat stress and hazardous gas exposure in real-time. Honeywell’s biometric safety vest, which embeds PPG, accelerometer, and CO2 sensors, fulfills OSHA heat illness prevention guidance without adding bulky gear, positioning textile-integrated wearables as the breakout form factor of the decade.
The widening adoption spectrum now includes wrist wear for two-factor authentication and notification pings, HMDs for VR training in confined-space rescue, and wearable cameras for capturing law enforcement evidence. Sony’s 4K, 1-inch micro-OLED display enables glasses that resemble prescription frames yet deliver industrial brightness, erasing the cultural stigma once associated with head-mounted computers. Pancake optics and waveguide patents promise further weight reductions, translating to full-shift comfort and accelerating replacement of rugged tablets in maintenance work orders.


By End-User Industry – Manufacturing Leads, Healthcare Accelerates
Manufacturing accounted for 27.95% of the 2025 spend, primarily driven by predictive maintenance and assembly guidance. The B2B enterprise and industrial wearables market share for the sector stems from high labor costs and strict defect-per-million targets that justify automation outlays. BMW and Bosch demonstrate that reducing rework yields immediate payback, even before accounting for fewer safety incidents. Healthcare is the fastest-growing sector, with a 29.86% CAGR, as the Centers for Medicare and Medicaid Services reimburse remote patient monitoring codes and the FDA clears clinical-grade biosensors. Continuous telemetry reduces hospital stays, allowing providers to shift risk in value-based contracts.
IT and telecom field crews utilize AR overlays to reduce truck rolls and first-time-fix errors, while retail warehouses deploy glove scanners to shave seconds off of pick cycles. Transportation fleets issue smart watches that double as driver safety monitors, collecting heart-rate variability alongside telematics to predict fatigue. Utilities and oil and gas firms equip inspectors with ATEX-certified smart glasses, replacing paper logs with voice-captured inspection records.
By Component – Sensors Anchor Value, Software Shapes Differentiation
Sensors captured 34.35% of the 2025 value and continue to be the backbone of data collection. Multi-modal IMUs, PPGs, and environmental detectors are embedded in a single flex board, reducing BOM and calibration costs. Artificial intelligence embedded in sensor hubs means fewer data packets traverse congested networks, easing compliance with data minimization rules. The B2B enterprise and industrial wearables market size for sensors is projected to grow at a 29.05% CAGR as integrated packages replace discrete parts.
Displays and optics chase weight and brightness targets, while processor roadmaps push 45 TOPS per watt by mid-forecast, unlocking on-device natural language processing for voice-only UIs. Connectivity modules must juggle Bluetooth, Wi-Fi 7, and 5G RedCap in a postage-stamp footprint. Ultimately, software and services dictate stickiness: ThingWorx and MindSphere ecosystems provide drag-and-drop dashboards that convert raw sensor streams into KPI alerts, reinforcing the shift from hardware sales to recurring SaaS revenue.
By Application – Remote Assistance Dominates, Predictive Maintenance Surges
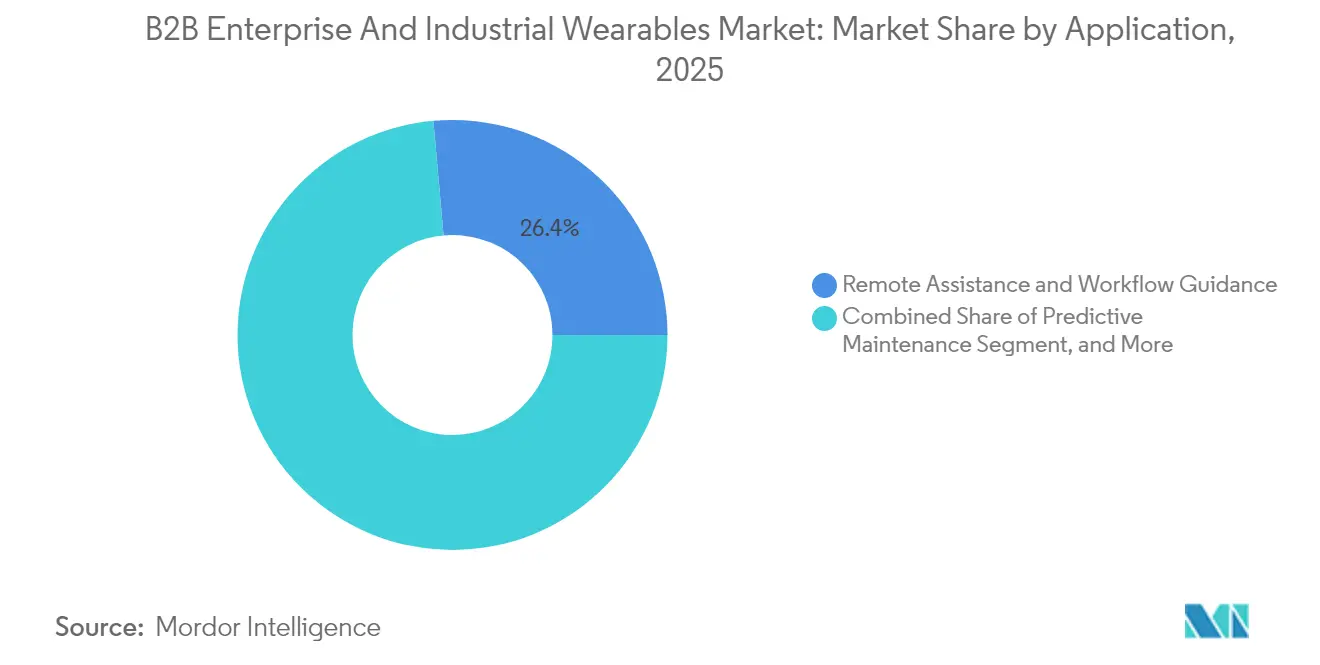
Remote assistance and workflow guidance delivered 26.42% of 2025 revenue. Field engineers wearing smart glasses stream high-definition video to HQ experts, who overlay AR annotations, eliminating the need for costly second visits. In a complex wiring harness assembly, this approach reduced errors by 90% at Boeing, demonstrating its economic benefits. Predictive maintenance is racing ahead with a 30.10% CAGR, as vibration and thermal anomalies captured by wearables feed asset-health algorithms. The B2B enterprise and industrial wearables market size is tied to the benefits of predictive maintenance, which can lead to deferred capital spending on replacement equipment.
Training and simulation see growing VR adoption for confined-space entry drills, while worker health monitoring extends beyond pulse checks to include gas exposure thresholds and posture analytics. Inventory management leverages glove-integrated RFID to automate stock counts, and quality inspection workflows pair computer vision with voice tags to archive audit trails for ISO compliance.
By Connectivity Technology – Bluetooth Leads, 5G Gains Momentum
Bluetooth and BLE secured 42.10% of 2025 revenue, thriving on the ubiquity of smartphones and sub-100 mW power draws. Wi-Fi 6E fills high-bandwidth indoor tasks, and Wi-Fi 7 targets sub-5 ms latency. 4G LTE remains indispensable for field crews beyond factory fences, though LTE-M and NB-IoT serve low-throughput sensors.
Private 5G and 5G RedCap, however, are forecast to leap forward at a 30.25% CAGR as enterprises seek deterministic latency for safety alerts and real-time video. Ultra-wideband offers centimeter-level positioning, enabling collision-avoidance systems for forklifts inside warehouses once plagued by blind corners.
Geography Analysis
North America B2B Enterprise and Industrial Wearables Market
North America generated 39.65% of 2025 revenue. Stringent OSHA standards and early adoption of AR by logistics behemoths laid the groundwork for widespread uptake. U.S. aerospace, automotive, and oil majors continue to layer wearables on top of digital-twin roadmaps, driving the B2B enterprise and industrial wearables market toward established annual budgets. Canada utilizes rugged smart glass in remote mining and forestry operations, where fly-in-fly-out crews require off-grid diagnostics. Mexico’s maquiladora plants adopt wearables to satisfy zero-defect mandates from North American OEMs.
APAC B2B Enterprise and Industrial Wearables Market
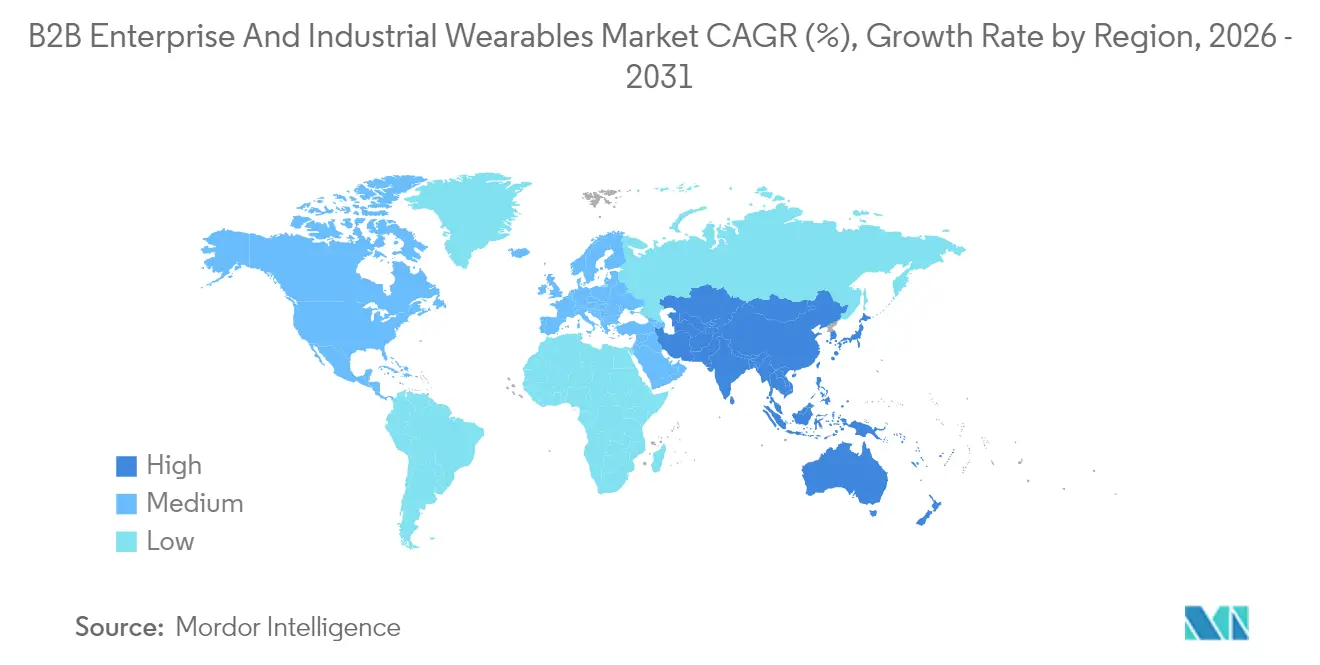
Asia-Pacific is poised for a 30.90% CAGR through 2031. Beijing’s Made in China 2025 agenda finances automated factories in the Yangtze River Delta, embedding wearable feeds into real-time MES dashboards. India’s Production-Linked Incentive outlays fund smart clothing pilots for the pharmaceutical and automotive sectors, addressing labor-skill gaps. Japan’s Society 5.0 vision positions wearables as the interface between an aging workforce and robotic co-workers, with smart exoskeletons and biometric sleeves helping to ease musculoskeletal strain. South Korea’s semiconductor fabs deploy UWB-enabled badges to enforce cleanroom zoning, while Australia’s mines adopt fatigue-detection vests to mitigate accident risks.
Europe, Middle East and South America B2B Enterprise and Industrial Wearables Market
Europe shows robust yet regulated growth. Germany leverages Industrie 4.0 subsidies and CE-marking expertise to export turnkey wearable-enabled production lines. GDPR compels on-premises inference, putting the spotlight on edge AI chipmakers. France and Italy face slower roll-outs as worker councils debate surveillance optics, though automotive clusters in Turin and Modena pilot smart glasses for torque-wrench calibration. The United Kingdom’s divergent post-Brexit standards add compliance complexity but also open fast-track routes for innovative suppliers. Elsewhere, the Middle East invests in smart-city megaprojects that include wearable safety mandates on construction sites, while South America pilots edge-AI-enabled wearables in Brazil’s open-pit mines.
Regulatory Landscape
Regulation for enterprise and industrial wearables is converging across hardware safety, worker safety compliance, cybersecurity, and AI governance. In the United States, OSHA has been expanding recognized test coverage under its Nationally Recognized Testing Laboratory (NRTL) program, including the addition of UL 8400 (VR/AR/MR equipment safety) to the list of appropriate test standards in January 2024 and an expanded scope of recognition for DEKRA Certification Inc., effective December 31, 2025. For industrial robotics wearables, OSHA oversight commonly ties back to the General Duty Clause, while industry design and safety expectations increasingly reference ASTM International Committee F48 standards for exoskeletons and exosuits.
In Europe, regulatory requirements are tightening around cybersecurity and AI-enabled functionality used in worker monitoring and digital health workflows. ETSI CYBER-EUSR released an interim draft of EN 304 634 in April 2026 to support the EU Cyber Resilience Act approach for personal wearables, signaling more explicit security-by-design expectations for connected devices and their firmware lifecycle. In June 2026, the European Commission published draft guidelines under Article 6(5) of the EU AI Act to clarify high-risk AI classification for medical devices and digital health technologies (consultation ending July 23, 2026), reinforcing that certain AI-enabled wearables used in medical contexts align with MDR conformity pathways rather than operating under a separate, parallel approval track. Separately, an April 2026 USTR Section 301 review covering Chinese smart wearable devices introduced additional trade-policy uncertainty for US buyers and import-dependent OEMs, with the review outcome pending later in 2026.
Value Chain Analysis
The value chain starts with core components (sensors, displays and optics, processors and memory, connectivity modules, and batteries), then moves through device OEMs and industrial-grade design validation (ruggedization, ingress protection, and ATEX/IECEx where applicable). From there, software and services layers integrate wearables into ERP, MES, CMMS, and collaboration suites. Semiconductor and sensor suppliers, for example edge AI SoCs and sensor hubs that can run on-device inference, influence device form factors and all-day usability, while standards and certification testing, such as NRTL-recognized safety standards, add time and cost to commercialization for AR headsets and safety wearables.
Downstream, differentiation increasingly comes from ecosystem integration and deployment partners rather than standalone hardware. A December 2025 partnership between JLT Mobile Computers and MakuSafe shows the channel shift toward bundling rugged mobile endpoints with wearables for forklift safety workflows, aligning procurement with existing fleet and warehouse operations. Manufacturing scale-up is also becoming more modular, as seen in May 2026 when Temple partnered with Zetwerk and Ethereal Machines to accelerate production, reflecting greater reliance on specialized manufacturing and engineering platforms to bring industrial wearables to volume without building in-house capacity. Software platform tie-ins are shaping adoption as well, including a May 2026 partnership between Guangfan Technology and Tencent Mobility to integrate AI-powered wearable sensing into Tencent Maps, positioning wearables as data capture nodes inside larger operational applications.
Competitive Landscape
Competition remains moderately fragmented. Platform incumbents such as Meta, Microsoft, and Apple utilize existing collaboration suites and digital twin backends to secure accounts. RealWear, Vuzix, and ProGlove carve out niches with ATEX-rated smart glasses and glove scanners that withstand dust and vibration.
Patent runs highlight strategic moats: Sony owns micro-OLED roadmaps, Kopin holds waveguide optics, and Qualcomm bundles 5G RedCap with 45 TOPS AI compute in a single SoC. Bosch Sensortec’s sensor-hub-with-AI models consolidate IMU, PPG, and gas detection on one die, attracting OEMs that want to shrink PCBs and extend battery life.
End-to-end software integration trumps raw hardware specs. Meta’s Quest platform pre-loads Zoom and Teams connectors, minimizing IT effort. Microsoft ships Azure Digital Twin APIs that feed directly into Dynamics maintenance tickets. Apple courts field technicians by merging Vision Pro spatial menus with SAP and Salesforce extensions, prioritizing usability over warehouse-grade ruggedness. Regulatory hurdles favor large players: Honeywell’s FDA 510(k) clearance for biometric vests and RealWear’s ATEX/IECEx certifications erect barriers that newcomers struggle to cross.
B2B Enterprise And Industrial Wearables Industry Leaders
-
Alphabet Inc.
-
Samsung Electronics Co. Ltd.
-
Sony Corporation
-
HTC Corporation
-
Apple Inc
- *Disclaimer: Major Players sorted in no particular order
B2B Enterprise And Industrial Wearables Market Companies Covered in this Report
- Meta Platforms Inc. (Oculus VR LLC)
- Alphabet Inc.
- Samsung Electronics Co. Ltd.
- Sony Group Corporation
- HTC Corporation
- Apple Inc.
- Fitbit LLC (Google LLC)
- Xiaomi Corp.
- Seiko Epson Corporation
- Microsoft Corporation
- Texas Instruments Incorporated
- Toshiba Corporation
- Honeywell International Inc.
- RealWear Inc.
- Zebra Technologies Corporation
- Vuzix Corporation
- ProGlove GmbH
- Qualcomm Incorporated
- Panasonic Holdings Corporation
- Kopin Corporation
Read Analysis of B2B Enterprise And Industrial Wearables Companies
Market Opportunities and Future Outlook
A near-term opportunity sits at the intersection of worker safety compliance and edge processing, where enterprises are moving from monitoring toward actionable prevention. Smart clothing and body sensors benefit from demand for real-time heat stress and hazard exposure detection, and on-device inference reduces privacy friction by keeping biometric processing local, which is especially relevant in regulated environments. This shift shows up in deployed site solutions such as Samsung's July 2026 roll-out of a SmartThings Pro Safety Management approach at its Pyeongtaek Campus construction site for semiconductor line installation, incorporating heat-stress risk prediction, and in buyer focus on deterministic connectivity (private 5G and 5G RedCap) that supports time-critical safety alerts.
Another opportunity area involves compliance-ready enterprise software and governance features that reduce procurement friction in manufacturing and healthcare. Enterprises are filtering vendors based on security controls, audit trails, and interoperability with identity providers and operational systems; modules that integrate with ERP, MES, CMMS, and EHR reduce integration risk versus bespoke pilots. In healthcare-adjacent use cases, regulatory clarity can broaden the addressable set for non-invasive wearables positioned outside clinical diagnosis: in January 2026, the FDA updated its General Wellness policy guidance, clarifying conditions under which certain physiologic-parameter estimating wearables can be marketed as low-risk general wellness products when they avoid diagnostic claims. In Europe, supplier roadmaps also need to reflect evolving device requirements and test regimes, including cybersecurity standardization linked to the EU Cyber Resilience Act and US consumer-facing compliance tightening such as the CPSC compliance alert referencing UL 2849:2026 Version 4.2 tests effective October 1, 2026 for wearables entering the United States, which can push OEMs toward more robust mechanical design validation and documentation.
Recent Industry Developments in B2B Enterprise And Industrial Wearables Market
- July 2026: Samsung Electronics deployed a SmartThings Pro Safety Management Solution at its Pyeongtaek Campus construction site supporting semiconductor line installation, incorporating a heat-stress risk prediction algorithm. The deployment highlights how enterprise wearables are being packaged into site-level safety workflows rather than treated as standalone devices. It also reinforces demand for integrated analytics and operational roll-out playbooks in industrial settings.
- October 2025: Apple announced an Apple Vision Pro upgrade with the M5 chip and a Dual Knit Band, targeting improved performance and comfort for extended use. The upgrade supports heavier enterprise spatial workflows, including interactive visualization for complex industrial assets via apps such as JigSpace. It further positions managed spatial computing hardware as a long-session tool for engineering, maintenance, and training teams.
- November 2024: RealWear introduced the Navigator Z1, an ATEX-certified smart glass featuring thermal imaging and UWB positioning for oil and gas sites. The product targets hazardous environments where hands-free documentation and inspection capabilities face strict safety requirements. ATEX-rated releases strengthen the rugged-wearables segment by lowering barriers to deployment in regulated, high-risk facilities.
B2B Enterprise And Industrial Wearables Market Report Scope and Research Methodology
Market Definition and Coverage
This market covers wearable devices and related software and services that are bought by organizations for work use, where the device supports tasks like safety monitoring, remote guidance, training, and field documentation in industrial and enterprise settings.
Scope exclusions: Consumer fitness and lifestyle wearables purchased mainly for personal use are excluded, even if the same hardware can be repurposed at work.
Segments Covered in This Report
- By Device Type
- HMDs
- Wrist Wears
- Smart Glass
- Smart Clothing and Body Sensors
- Wearable Cameras
- Other Device Types
- By End-User Industry
- IT and Telecom
- Healthcare
- Retail and E-Commerce
- Insurance and Financial Services
- Manufacturing
- Transportation and Logistics
- Other End-User Industries
- By Component
- Sensors
- Displays and Optics
- Processors and Memory
- Connectivity Modules
- Power and Battery
- Software and Services
- By Application
- Remote Assistance and Workflow Guidance
- Worker Safety and Health Monitoring
- Training and Simulation
- Predictive Maintenance
- Inventory and Asset Management
- Quality Inspection and Documentation
- By Connectivity Technology
- Bluetooth / BLE
- Wi-Fi / Wi-Fi 6 / 6E
- 4G LTE / LTE-M / NB-IoT
- 5G and 5G RedCap
- UWB and Short-Range RF
- By Geography
- North America
- United States
- Canada
- Mexico
- South America
- Brazil
- Argentina
- Rest of South America
- Europe
- Germany
- United Kingdom
- France
- Italy
- Spain
- Rest of Europe
- Asia-Pacific
- China
- Japan
- India
- South Korea
- Australia
- Rest of Asia-Pacific
- Middle East and Africa
- Middle East
- Saudi Arabia
- United Arab Emirates
- Turkey
- Rest of Middle East
- Africa
- South Africa
- Egypt
- Nigeria
- Rest of Africa
- Middle East
- North America
Data Sources, Market Sizing, and Validation
Desk Research
Desk research was used to build the starting structure for the model and to set realistic ranges for adoption and pricing. We relied on public and official sources such as the US Bureau of Labor Statistics for workforce counts, OSHA for safety context, NIST for industrial connectivity guidance, the FCC for spectrum and private network direction, and ITU publications for broader telecom indicators.
We also reviewed annual reports, earnings decks, and product documentation to understand device categories, typical configurations, and how enterprise contracts are packaged. For directional checks, we used paid subscriptions for company financials and intelligence, patent databases, and a global contracts and tenders feed to spot where deployments were being announced. These examples are not exhaustive, and many other public sources were also used for data collection, validation, and research clarification.
Primary Interviews and Surveys
Primary work focused on speaking with people who either influence deployments or see day to day usage, so our inputs did not rely only on published narratives. We covered device ecosystem participants, enterprise buyers, system implementers, and industry specialists across APAC, EMEA, and the Americas, and then used their feedback to confirm adoption pace, replacement cycles, and realistic pricing moves by form factor.
Distribution of primary research fieldwork respondents
| Company type | Respondent position | Region |
|---|---|---|
| Top tier: 26% | CXOs: 14% | APAC: 46% |
| Mid tier: 55% | Functional/Unit leaders: 40% | EMEA: 30% |
| Smaller Players: 19% | Managers: 46% | Americas: 24% |
Market-Sizing & Forecasting
Sizing was built using a top-down demand pool, where workforce by high exposure roles and digitized workflow intensity were converted into an addressable user base, and then translated into device and software value using adoption rates. The model was then corroborated through selective bottom-up approximations using a sampled set of supplier revenue cues, channel checks, and typical average selling price ranges multiplied by plausible shipment volumes, which helped correct any overreach.
Key inputs included the number of connected workers in target industries, rollout timing of private LTE and 5G in facilities, mix shifts across device types like head mounted displays and wrist wear, replacement cycles driven by battery life and ruggedness, and the split between hardware value and recurring software and services. When bottom-up signals were incomplete in smaller regions or niche device types, we used penetration proxies from similar industries and then adjusted them after expert feedback.
For forecasting, scenario analysis was used with a base case anchored on enterprise digitization budgets and safety compliance momentum, followed by sensitivity tests on connectivity readiness and average price progression. Assumptions were kept simple so they can be traced year by year and rechecked during updates.
Data Validation & Update Cycle
Outputs were validated through multiple checks, starting with internal consistency tests across devices, components, and applications, and then moving to external sense checks against workforce scale and enterprise technology spending direction. If a region or device type showed an unusual jump, the inputs behind adoption, pricing, or replacement timing were re-tested, and when needed, experts were re-contacted to confirm what changed.
A second analyst review is completed before sign-off so the calculation steps and assumptions are clearly followed. Reports are refreshed annually, and interim updates are made when material events occur such as major regulation moves, connectivity shifts, or sudden demand changes. Before delivery, a fresh review pass is completed so the final numbers reflect the latest available signals.
Mordor Intelligence's B2b Enterprise and Industrial Wearables Market Estimate Compared With Other Published Estimates
Published market sizes for enterprise and industrial wearables do not always match, even when the titles look similar, and that usually comes from what is included, how pricing is treated, and which year is taken as the true base for forecasting. Differences also show up when one study leans more on shipment narratives and another ties demand to workforce and deployment readiness.
Some published figures expand the scope into wider enterprise wearable categories that can include broader headset use or loosely defined corporate wearables. For Mordor Intelligence, value is counted only when the purchase is clearly for B2B workplace use cases, and consumer-led demand is left out even if the same form factor exists.
Benchmark comparison
| Source | Market Size | Gaps in Research Methodology |
|---|---|---|
| Mordor Intelligence | USD 20.44 B (2025) | |
| Industry Publisher A | USD 16.40 B (2025) | Uses a different base setup and study window, and its early-year sizing appears to lean more on listed category revenues, which can undercount software and services embedded in enterprise deployments. |
| Industry Publisher B | USD 7.63 B (2025) | Tracks enterprise wearables more narrowly and can omit parts of industrial use, plus the product framing is closer to enterprise wearable devices rather than a full industrial plus enterprise demand pool. |
The spread in values is mainly explained by scope and what gets counted as workplace demand, followed by how recurring software and services are treated alongside devices. By keeping the demand pool tied to worker deployment realities and then cross-checking it with practical pricing and adoption inputs, the final figure stays transparent and repeatable for planning.
Key Questions Answered in the Report
How fast is spending on enterprise wearables growing in manufacturing?
Manufacturing spend in the B2B enterprise and industrial wearables market is growing alongside a 27.45% overall CAGR and held 27.95% share of 2025 revenue.
Which connectivity option is gaining the most momentum for industrial wearables?
Private 5G and 5G RedCap connections are the fastest-growing, projected at a 30.25% CAGR through 2031 on the back of deterministic latency and reliability.
Why are smart clothing and body sensors attracting fresh investment?
Regulatory pressure for real-time worker safety monitoring and advancements in washable textile-integrated sensors support a 28.74% CAGR for smart clothing and body sensors.
What is the biggest adoption barrier for enterprise AR devices?
The lack of business-grade applications with enterprise security certifications and deep ERP integration remains the leading bottleneck.
How does edge AI improve wearable performance?
Chipsets delivering up to 15 TOPS under 5 watts enable on-device inference, cutting latency and complying with data-localization rules without sacrificing battery life.