
Market Overview
| Study Period | 2019 - 2031 |
|---|---|
| Market Size (2026) | USD 0.91 Trillion |
| Market Size (2031) | USD 1.17 Trillion |
| Growth Rate (2026 - 2031) | 5.13 % |
| Fastest Growing Market | Asia Pacific |
| Largest Market | Middle East |
| Market Concentration | Medium |
Major Players *Disclaimer: Major Players sorted in no particular order Image © Mordor Intelligence. Reuse requires attribution under CC BY 4.0. | |
Aviation Infrastructure Market Analysis by Mordor Intelligence
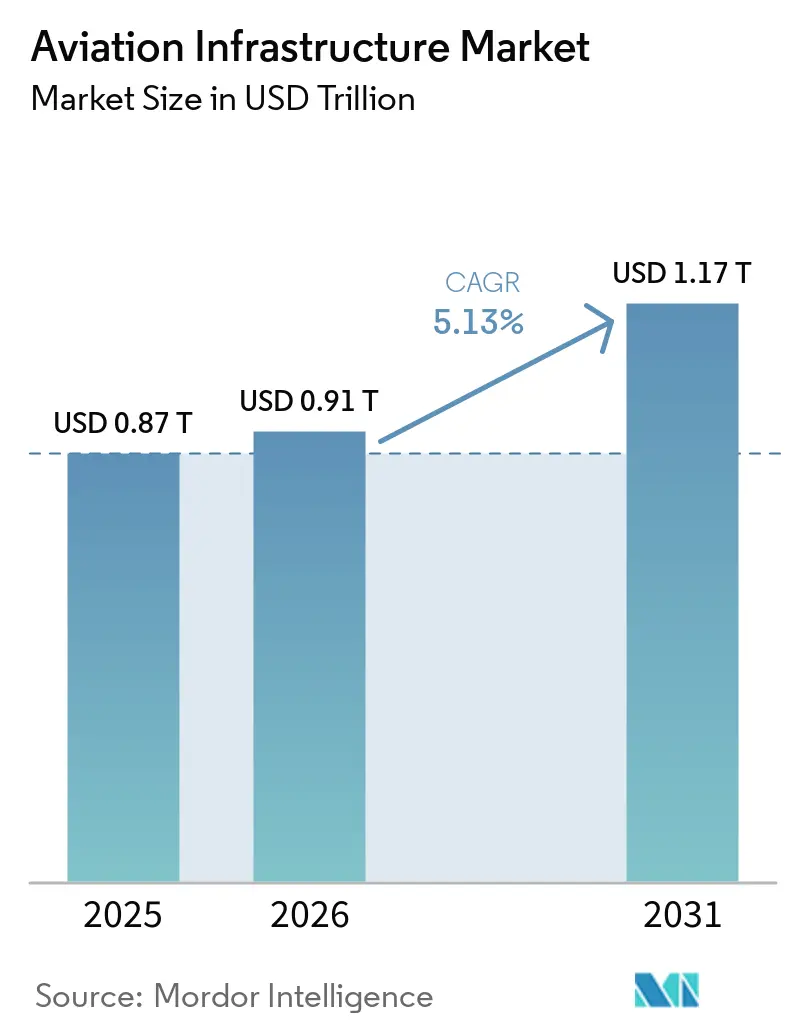
The aviation infrastructure market size is expected to grow from USD 0.87 trillion in 2025 to USD 0.91 trillion in 2026 and is forecasted to reach USD 1,17 trillion by 2031 at a 5.13% CAGR over 2026-2031. Growth is supported by sovereign investments in green-field hubs across the Asia-Pacific and the Middle East, the retrofit cycle in mature economies, and airlines’ pivot to contactless processing, which pulls forward terminal automation spending. EPC contractors are reshaping their offerings around design-build-finance packages, while concession operators seek revenue certainty through 25–30-year leases that bundle aeronautical fees with retail upside. Lifecycle cost optimization, rather than headline capital outlay, is now the dominant procurement filter, elevating operations-and-maintenance (O&M) providers within the Aviation Infrastructure market. Fiscal volatility and skilled-labor gaps temper near-term momentum, yet dual-use military conversions and vertiport roll-outs widen the medium-term opportunity set.
Key Report Takeaways
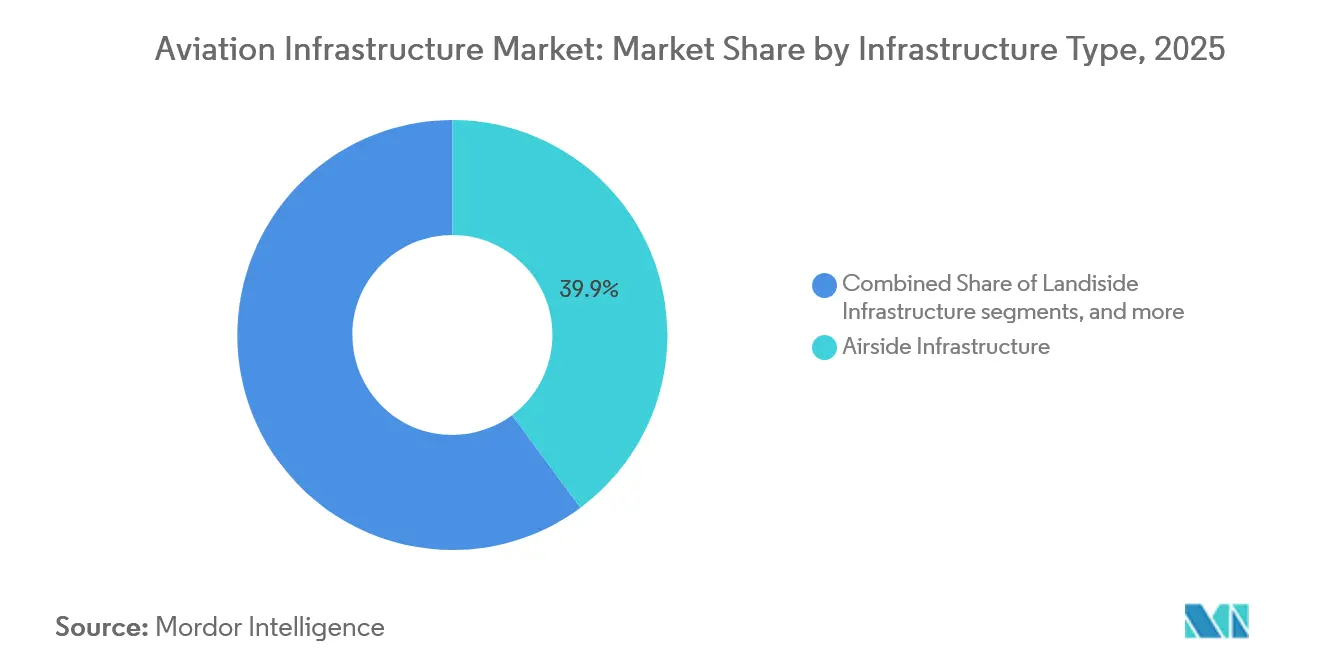
- By infrastructure type, airside facilities led with 39.85% of the aviation infrastructure market share in 2025, while landside facilities are projected to expand at a 5.95% CAGR to 2031.
- By airport type, green-field projects captured 52.78% of 2025 spending, but brownfield upgrades are expected to grow at a 5.76% CAGR through 2031.
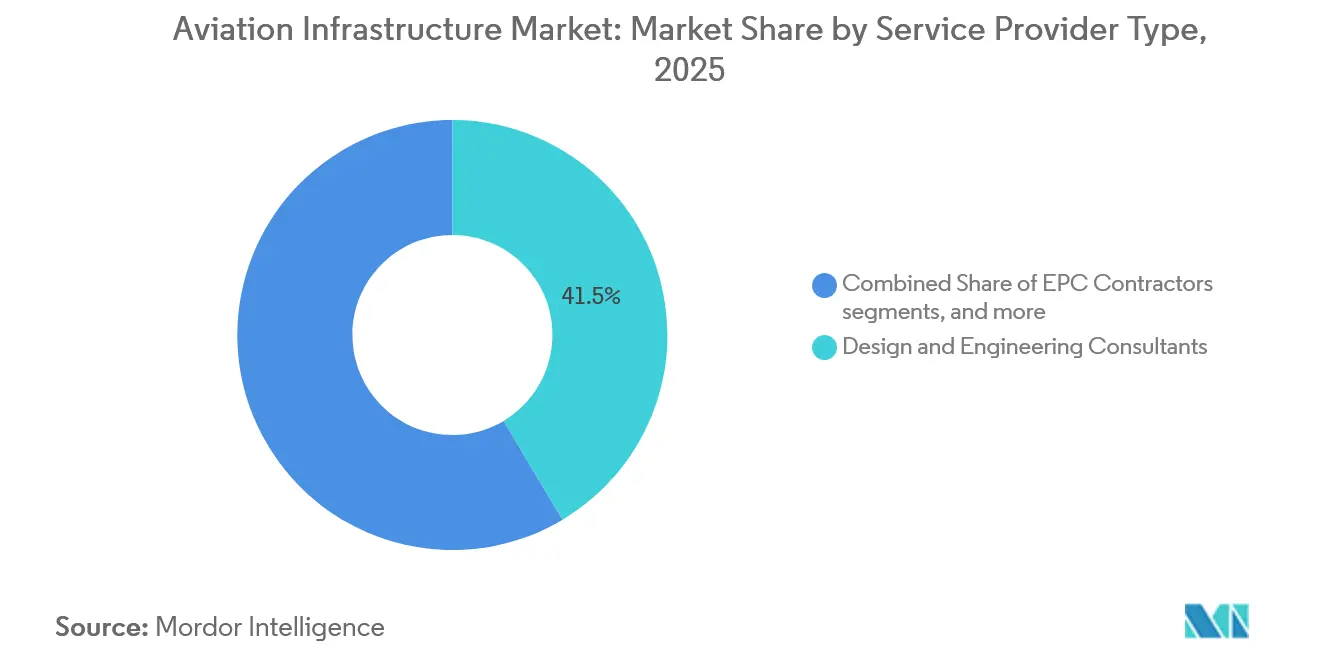
- By service provider type, design and engineering consultancies accounted for 41.45% of the 2025 revenue, whereas O&M specialists are forecast to post the fastest growth, with a 6.11% CAGR during 2026–2031.
- By geography, the Asia-Pacific region held 37.87% of the 2025 value; the Middle East is projected to expand at a 6.23% CAGR through 2031.
Note: Market size and forecast figures in this report are generated using Mordor Intelligence’s proprietary estimation framework, updated with the latest available data and insights as of January 2026.
Market Trends and Insights
Drivers Impact Analysis of Aviation Infrastructure Market*
| Driver | (~) % Impact on CAGR | Key Geography | Impact Timeline |
|---|---|---|---|
| Surge in green-field airport projects across APAC | +1.20% | Asia-Pacific, spill-over to Middle East | Medium term (2 – 4 years) |
| Modernization mandates for ageing North American terminals | +0.80% | North America and Europe | Short term (≤ 2 years) |
| Airline-led demand for contactless passenger processing | +0.60% | Global | Short term (≤ 2 years) |
| State stimulus for regional/secondary airports | +0.50% | North America, Europe, select APAC | Medium term (2 – 4 years) |
| Military dual-use infrastructure unlocking civil slots | +0.40% | North America, Japan, South Korea | Long term (≥ 4 years) |
| eVTOL vertiport network build-outs | +0.30% | North America, Europe, UAE | Long term (≥ 4 years) |
| Source: Mordor Intelligence | |||
Surge in Green-Field Airport Projects Across APAC
Beijing Daxing’s third runway pushed its design capacity to 100 million passengers in early 2025.[1] India’s Navi Mumbai International opened in October 2025 with an initial 20 million-passenger throughput and embedded high-speed-rail connectivity that links the site to central Mumbai in 25 minutes. Indonesia awarded a USD 4.2 billion EPC package for a new East Kalimantan airport in March 2025, linking the facility to a planned special economic zone cluster. The Philippines broke ground on the USD 15 billion Bulacan hub in June 2025, specifying on-site sustainable aviation-fuel (SAF) blending as a prerequisite for financing. ICAO’s 2027 SAF compliance trigger is accelerating the adoption of similar specifications across the region.
Modernization Mandates for Ageing North American Terminals
The US FAA disbursed USD 3.2 billion in 2025 under the Airport Infrastructure Grant program, prioritizing HVAC, baggage system, and gate bridge retrofits at terminals over 30 years old. Denver International completed a USD 770 million expansion in September 2025, adding 12 contact gates and eight computed tomography security lanes that cut the average screening time by 22%. Toronto Pearson launched a renovation in April 2025 to install biometric exits at Terminal 1, in compliance with Canadian border-control mandates. The TSA’s January 2025 directive, which compels Category X airports to install 3D scanners by December 2026, compresses procurement timelines and construction windows.
Airline-Led Demand for Contact-less Passenger Processing
Delta Air Lines activated biometric boarding across 15 US hubs in 2025, trimming gate dwell by nine minutes per wide-body flight. Emirates’ iris recognition at Dubai Terminal 3 now processes 2,400 passengers per hour, slashing immigration queues by 40%. IATA’s One ID framework is expected to have 28 participating airports by the end of 2025, with adopters citing 15% lower staffing costs and double-digit gains in satisfaction metrics.[2] In 2025, Lufthansa invested to co-finance biometric infrastructure at Frankfurt and Munich, enabling three extra daily rotations per long-haul aircraft.
State Stimulus for Regional/Secondary Airports
Washington’s Infrastructure Investment and Jobs Act routed USD 5 billion to US regional airports through 2026, funding runway extensions at 23 facilities during 2025. Spain allocated EUR 351 million (USD 412.85 million) to upgrade 14 regional airports with LED taxiway lighting and CAT III instrument landing system upgrades. Japan deployed billions to expand eight secondary terminals, diverting leisure traffic from congested Haneda and Narita. Australia committed AUD 190 million for apron resurfacing and fire-station improvements at 11 regional gateways.
Restraints Impact Analysis of Aviation Infrastructure Market*
| Restraint | (~) % Impact on CAGR | Key Geography | Impact Timeline |
|---|---|---|---|
| Fiscal tightening curbing PPP funding pipelines | -0.70% | Europe, Latin America, select APAC | Short term (≤ 2 years) |
| Skilled labor shortages in specialized airside construction | -0.50% | North America, Europe, Australia | Medium term (2 – 4 years) |
| Volatile jet-fuel and terminal-access charges reducing airport CAPEX appetite | -0.40% | Global | Short term (≤ 2 years) |
| Local community opposition delaying runway extensions | -0.30% | Europe, North America | Medium term (2 – 4 years) |
| Source: Mordor Intelligence | |||
Fiscal Tightening Curbing PPP Funding Pipelines
Euro-zone PPP deal flow fell 18% in 2025 as rate hikes pushed airport IRRs below pension-fund targets, shelving USD 6.2 billion of projects.[3] Gatwick withdrew a GBP 1.2 billion (USD 1.63 billion) second-runway plan in July 2025 after lenders priced debt above 7.5%, which would have required passenger-fee hikes of 22% to meet investment-grade metrics. Similarly India postponed four green-field tenders once capped aeronautical charges pulled modeled IRRs to 6.8%. Multilateral lenders partially fill the gap; the Asian Development Bank’s USD 450 million commitment to Vietnam and the Philippines comes with stringent SAF and carbon-offset covenants that raise project costs by 9%.
Skilled Labor Shortages in Specialized Air-Side Construction
US contractors face 14-month waits for certified airfield electricians and pavement engineers, which delays handovers and activates liquidated-damages clauses.[4] Britain’s Construction Industry Training Board pegged a 23,000-worker shortfall in 2025 as apprenticeship enrollment slipped 40% since 2020. Australian airfield crews command a 17% wage premium, which widens contractor cost bases and stretches schedules by up to nine months. FAA-accredited lighting-technician programs graduate just 340 students annually against a 680-technician need, underlining a structural gap.
*Our forecasts treat driver/restraint impacts as directional, not additive. The impact forecasts reflect baseline growth, mix effects, and variable interactions.
Aviation Infrastructure Market Segment Analysis
By Infrastructure Type:
Landside Gains on Retail and AutomationLandside assets are forecast to grow at 5.95% between 2026 and 2031, surpassing airside upgrades, despite runways and taxiways holding a 39.85% share of the aviation infrastructure market in 2025, with airside services supporting efficient airport operations. The shift is underpinned by airports’ drive to offset aeronautical-fee pressure through retail concessions, premium parking, and automated baggage systems that cut mishandled-bag rates by 28% at early adopters such as Hong Kong International. Modular terminal builds, codified by AISC standards in 2024, trim on-site labor by 35% and shave a third off schedule durations.
Security infrastructure accelerates in response to the TSA’s 3D-scanner mandate, while EASA’s stringent fire-suppression rules for terminals exceeding 100,000 square meters intensify retrofit efforts. Amsterdam Schiphol’s EUR 45 million (USD 50.9 million) hydrant-system upgrade in May 2025 enables 30% SAF blends across all gates, attracting carriers with published carbon-reduction commitments. Electric ground-support fleets at Los Angeles International Airport eliminate 1.2 million liters of diesel annually, aligning with California's zero-emission timelines.

By Airport Type:
Brownfield Expansions AccelerateAlthough greenfield hubs accounted for 52.78% of the 2025 spend, brownfield programs are expected to outpace them at a 5.76% CAGR through 2031. Heathrow’s GBP 2.3 billion (USD 2.89 billion) Terminal 2 enlargement and Paris-CDG’s EUR 1.6 billion (USD 1.67 billion) Terminal 1 upgrade leverage existing airside footprints to avoid protracted land-use reviews. Brownfield timing constraints create night-shift premiums that inflate labor cost by 22% yet still undercut the multiyear permitting cycle facing green-field proposals.
Adaptive reuse is trending; in July 2025, Chicago O’Hare transformed a 1960s cargo shed into a nine-gate concourse, saving USD 140 million and preserving a historic structure. FAA continuous-safety auditing adds USD 2.8 million in inspection overhead for a typical 10-gate expansion; however, operators accept the premium to sidestep the hurdles associated with green-field land acquisition.
By Service Provider Type:
O&M Providers Capture Lifecycle ValueDesign consultancies commanded 41.45% of 2025 service revenue; however, O&M specialists are set to grow at a rate of 6.11% per year, as concession models prioritize lifecycle performance over the lowest-bid construction approach. VINCI’s 30-year Belgrade concession and Ferrovial’s 25-year Dalaman award illustrate the pivot, with earnings tied to passenger throughput and retail income rather than fixed availability payments.
EPC majors, such as Bechtel, are responding by bundling finance and 20-year maintenance guarantees, as evidenced by Bechtel's USD 1.4 billion JFK proposal in August 2025. Predictive-maintenance roll-outs, like Fraport’s IoT sensors that cut baggage-conveyor downtime by 34%, validate the O&M value proposition and underpin a service-driven margin profile.
Geography Analysis
APAC and Middle East Aviation Infrastructure Market
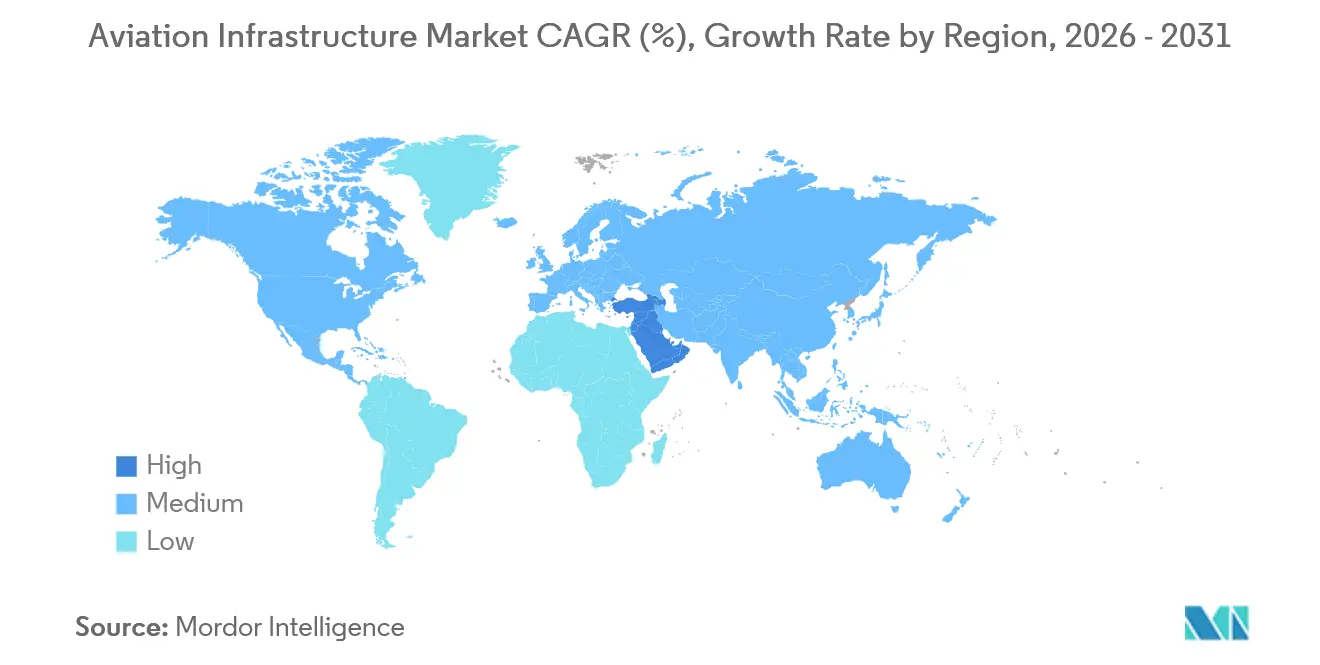
In 2025, the Asia-Pacific region accounted for 37.87% of the value; the Middle East represents the largest regional market in 2026 and is expected to expand at a 6.23% CAGR through 2031. Saudi Arabia’s USD 5.8 billion King Salman International contract aims to serve 120 million passengers by 2035, featuring a dedicated Hajj terminal and a SAF plant. The UAE’s USD 35 billion Al Maktoum expansion will add three runways and a 9 million-square-meter terminal by 2033, positioning Dubai for 260 million passengers a year.
Saudi Arabia and United Arab Emirates Aviation Infrastructure Market
Saudi Arabia’s USD 5.8 billion King Salman International contract aims to serve 120 million passengers by 2035, featuring a dedicated Hajj terminal and a SAF plant. The UAE’s USD 35 billion Al Maktoum expansion will add three runways and a 9 million-square-meter terminal by 2033, positioning Dubai for 260 million passengers a year.
The Americas and EMEA Aviation Infrastructure Market
North America held the second-largest % share in 2025, thanks to FAA grant-fuelled retrofits at Denver and Dallas-Fort Worth, while Europe’s 22% slice concentrates on noise-constrained brownfield projects at Heathrow, CDG, and Frankfurt. South America and Africa combined for 12% but drew multilateral backing; Viracopos and King Shaka projects illustrate the trend. The Gulf Cooperation Council’s unified airfield-design code, published in March 2025, cuts engineering spend by 14% across Saudi, UAE, and Qatari tenders.
Regulatory Landscape
Aviation infrastructure development is shaped by global safety and airport economic policy frameworks that increasingly influence both project scope and procurement. ICAO reinforced infrastructure development and diversified funding in its Strategic Plan 2026-2050 and through the Marrakech Ministerial Call to Action adopted on 14 April 2026. ICAO Policies on Charges for Airports and Air Navigation Services (Doc 9082, 10th ed.) also anchor principles such as transparency and consultation that affect aeronautical fee setting and, in turn, capital program bankability.
Regulators are tightening technical and compliance requirements for aerodromes, which is increasing retrofit demand and pushing greater rule harmonization. In the United States, the FAA progressed 2026 Airport Improvement Program (AIP) grant cycles (announced in March 2026) and implemented the FAA Reauthorization Act of 2024 (P.L. 118-63), including an integrated project delivery pilot for airport building construction and expanded runway-extension eligibility for GA airports. In Europe, EASA updated its Easy Access Rules for Aerodromes in March 2026, and NPA 2026-01 advanced proposals to transpose updated ICAO Annex 14 aerodrome standards into EU rules, including areas such as apron management and visual aids, shaping upgrade specifications and compliance timelines for operators and contractors.
Value Chain Analysis
The aviation infrastructure value chain covers master planning and design (airport authorities, regulators, and engineering consultancies), financing and procurement (public budgets, multilateral lenders, and PPP or concession vehicles), EPC delivery (civil works, MEP, airfield systems, and security screening integration), and long-duration operations and maintenance for terminals, airside assets, and digital systems. Execution increasingly combines design-build structures with bundled lifecycle commitments, as operators and sponsors prioritize lifecycle cost optimization and schedule certainty, which lifts the role of O&M providers and technology integrators alongside traditional civil contractors.
Upstream inputs and specialist services (airfield electricals, pavement engineering, baggage handling, and airport IT) are also being complemented by logistics and cargo ecosystem partners to reduce bottlenecks and improve airside efficiency. For example, GXO Logistics partnered with London Luton Airport in February 2026 to operate an airside delivery consolidation center, and Malaysia Airports Holdings Bhd partnered with Mitsui Fudosan (RM80 million announced July 2026) to develop an air cargo logistics complex at Subang Aerotech Park. Kenya’s USD 1.2 billion modernization contract for Jomo Kenyatta International Airport, awarded in February 2026 to China Road and Bridge Corporation, further reflects how international EPC capacity and financing networks can speed up delivery.
Competitive Landscape
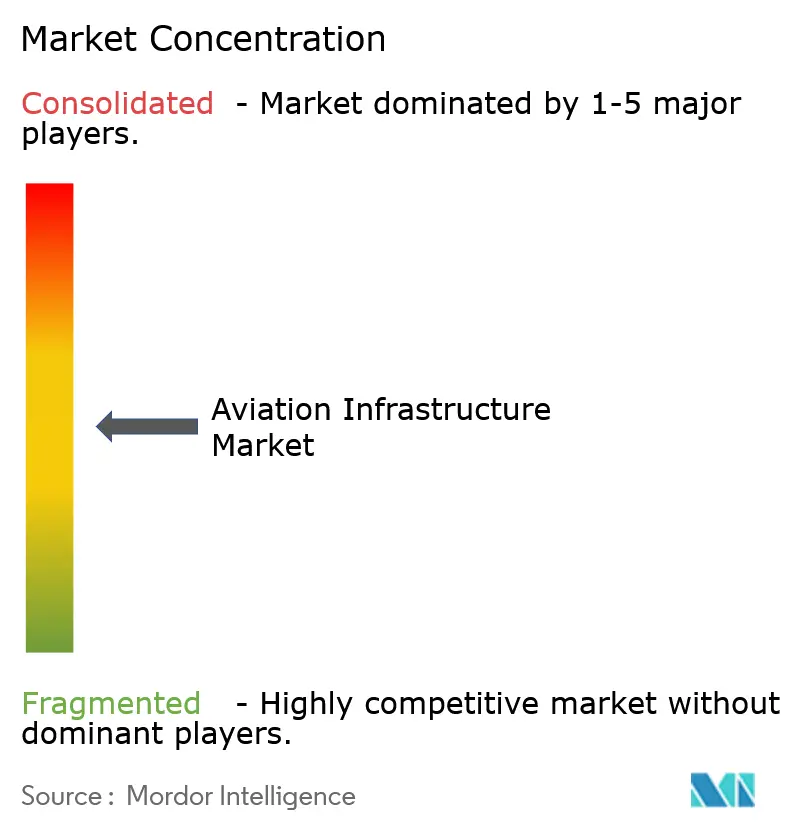
The aviation infrastructure market remains moderately concentrated, with the top 10 EPC and operator groups accounting for approximately 45% of the contract value. Hensel Phelps, Turner, and AECOM dominate North American terminals under FAA design-build frameworks, while VINCI and Ferrovial expand their concession portfolios to secure 25- to 30-year annuity streams. Chinese SOEs bundle turnkey EPC with concessional China Development Bank finance priced 150–200 basis points below commercial loans, accelerating Belt and Road airport build-outs.
Technology is a wedge; Bechtel’s 14 patents for prefabricated terminal modules slash on-site labor 40% and compress schedules to 22 months. Changi Airport’s digital twin re-optimizes gate allocation, lifting aircraft utilization by 7%. Skyports’ USD 85 million Series B funding positions it as a first-mover in vertiport networks across London, Los Angeles, and Singapore. Consolidation is accelerating; Royal BAM’s 60% stake in a Middle Eastern JV opens pre-qualified access to Saudi Arabia’s pipeline.
Aviation Infrastructure Industry Leaders
-
Hensel Phelps
-
Turner Construction Company
-
Austin Industries
-
AECOM
-
VINCI Airports
- *Disclaimer: Major Players sorted in no particular order
Aviation Infrastructure Market Companies Covered in this Report
- Hensel Phelps
- Turner Construction Company
- Austin Industries
- AECOM
- The Walsh Group
- McCarthy Building Companies, Inc.
- J.E. Dunn Construction Company
- PCL Constructors Inc
- Skanska USA Commercial Development Inc.
- Royal BAM Group nv
- ALEC Engineering and Contracting
- Manhattan Construction Group, Inc.
- Hill International, Inc.
- Sundt Companies, Inc.
- VINCI Airports
- FERROVIAL SE
- Bechtel Corporation
- Fluor Corporation
- GMR Group
- Larsen & Toubro Limited
- China State Construction Engineering Corporation (CSCEC)
- Samsung C&T Corporation
- Taisei Corporation
- Bouygues Construction
Market Opportunities and Future Outlook
A near-term opportunity sits in digitally enabled terminal and asset operations that reduce operating costs while improving throughput. This pulls spending toward airport IT foundations, biometric processing, and infrastructure management, and it is showing up in large hub programs that formalize technology partner roles within broader delivery scopes, such as Tata Consultancy Services being named the technology partner for the New Terminal One at John F. Kennedy International Airport in July 2026, with responsibility for digital foundations and AI-driven IT operations.
A second opportunity is security and screening modernization, where mandates such as the TSA requirement for Category X airports to install 3D scanners by December 2026 compress retrofit timelines and favor integrated delivery partners that can coordinate construction phasing, systems integration, and operational continuity. Beyond passenger processing, expansion of mega-hubs and supporting cargo and landside infrastructure is creating demand for end-to-end delivery capabilities, including for greenfield and major capacity additions at legacy urban airports. In June 2026, Dubai stated it planned to award Dh55 billion in contracts during 2026 for the Al Maktoum International Airport expansion, pointing to an active pipeline for sub-structure, terminal, and concourse packages. In Africa, Ethiopian Airlines broke ground on the Bishoftu International Airport project on 10 January 2026 (USD 12.5 billion), and in the United States, AIP and the Airport Terminals Program under the IIJA (USD 1 billion annually from 2022 to 2026) continue to underwrite runway, taxiway, and terminal work, supporting sustained bid activity for airside and terminal upgrades, including automation and telecom modernization tied to FAA initiatives such as Project LIFT.
Recent Industry Developments in Aviation Infrastructure Market
- March 2026: Austin Industries entered into a Part 1 design-build contract with the Hillsborough County Aviation Authority for Ticket Level Expansion and Optimization at Tampa International Airport. The agreement advances a terminal-side capacity and passenger-flow upgrade program and reinforces the use of design-build delivery for complex works in active terminals.
- September 2025: Hensel Phelps was selected as Construction Manager/General Contractor for phased Concourse A and terminal improvements at Boise Airport, with a program budget of up to USD 700 million through 2029. The award expands Hensel Phelps' multi-year airport backlog and reflects continued emphasis on gate additions, baggage handling upgrades, and utility plant scope to support operational growth.
- February 2024: A Turner Construction Company joint venture (Innovation Next+) was awarded an USD 855 million contract for Dallas Fort Worth International Airport Terminal F and a Skylink station. The win strengthens Turner’s position in large-hub terminal delivery and highlights continued capital allocation toward new concourses and airside connectivity infrastructure at major airports.
Aviation Infrastructure Market Report Scope and Research Methodology
Market Definition and Coverage
The aviation infrastructure market, as defined here, includes spending tied to developing, expanding, and modernizing airports and related air navigation infrastructure, along with associated contracted services that deliver these projects. It covers new builds as well as upgrades intended to increase capacity, improve safety, and strengthen passenger or cargo handling.
Scope exclusions: Aircraft procurement, airline operations, and non-infrastructure aviation services are excluded from this sizing.
Segments Covered in This Report
- By Infrastructure Type
- Airside Infrastructure
- Runways
- Taxiways
- Aprons
- Gates and Air Bridges
- Airfield Lighting and Navaids
- Landside Infrastructure
- Passenger Terminal Facilities
- Retail and Concessions
- Ground Access and Parking Infrastructure
- Baggage Handling Systems
- Security and Safety Infrastructure
- Security Screening Systems
- Customs and Immigration Facilities
- Fire and Rescue Stations
- Air Traffic Management Systems
- Fuel Infrastructure
- Ground Support Equipment and Services
- Airside Infrastructure
- By Airport Type
- Greenfield Airport
- Brownfield Airport
- By Service Provider Type
- EPC Contractors
- Design and Engineering Consultants
- Operators and Maintenance Providers
- By Geography
- North America
- United States
- Canada
- Mexico
- South America
- Brazil
- Rest of South America
- Europe
- United Kingdom
- Germany
- France
- Italy
- Spain
- Rest of Europe
- Asia-Pacific
- China
- India
- Japan
- South Korea
- New Zealand
- Rest of Asia-Pacific
- Middle East and Africa
- Middle East
- United Arab Emirates
- Saudi Arabia
- Qatar
- Rest of Middle East
- Africa
- South Africa
- Rest of Africa
- Middle East
- North America
Data Sources, Market Sizing, and Validation
Desk Research
Desk work starts with mapping the infrastructure demand pool and the funding pipeline, then collecting time series that can be compared across regions. We refer to public sources such as ICAO aviation statistics, IATA traffic indicators, Airports Council International (ACI) airport traffic datasets, World Bank macro indicators, and national civil aviation authority publications for passenger, cargo, and airport capacity direction.
To convert activity into spend, we also review project and procurement disclosures, budget documents, and infrastructure plans from ministries and airport operators, alongside company annual reports, investor presentations, and credible press coverage on awards and timelines. Where helpful, we use paid subscriptions for company financials and intelligence, patent databases, and an import-export shipment-level database to sense-check equipment and materials signals connected with large build cycles. These examples are illustrative only, and many additional sources were used for data collection, cross-checking, and clarifying assumptions.
Primary Interviews and Surveys
Primary inputs are used to test what desk sources cannot show clearly, such as how budgets translate into executed work, typical phasing delays, and how modernization projects are prioritized versus capacity adds. We speak with a mix of project developers, engineering and construction participants, airport-side stakeholders, and domain specialists across APAC, EMEA, and the Americas so assumptions on scope, timing, and pricing stay realistic.
Distribution of primary research fieldwork respondents
| Company type | Respondent position | Region |
|---|---|---|
| Top tier: 27% | CXOs: 15% | APAC: 44% |
| Mid tier: 56% | Functional/Unit leaders: 34% | EMEA: 29% |
| Smaller Players: 17% | Managers: 51% | Americas: 27% |
Market-Sizing & Forecasting
Our model is built mainly using a top-down approach where passenger and cargo outlook, airport capacity additions, and planned infrastructure programs are translated into yearly spending envelopes by region, then normalized to avoid double counting across multi-year projects. We corroborate this with selective bottom-up approximations, such as sampling large project awards, checking typical cost ranges for terminals and airside works, and running volume-times-price checks where dependable public inputs exist.
Key inputs include airport passenger throughput growth, cargo tonnage trends, announced airport expansion and greenfield pipelines, air traffic management modernization programs, and government or airport operator capex plans (including multi-year budget phasing). For forecasting, scenario analysis is used so differences in financing availability, construction capacity constraints, and schedule slippage can be reflected without forcing a single straight-line outcome. When a region lacks clean project disclosure, gaps are handled through proxy indicators such as traffic-to-capex intensity ratios and peer-region benchmarking, then re-tested through expert feedback before finalization.
Data Validation & Update Cycle
Outputs are checked against independent signals such as traffic growth, airport expansion announcements, and procurement cadence so large jumps can be tied to identifiable events. We run variance checks across regions and time, and unusual movements are reviewed again with the underlying assumptions on pricing, project timing, and currency conversion.
A multi-step analyst review is followed before sign-off, and re-contacts are triggered when major project cancellations, policy shifts, or sudden cost inflation could change the yearly spend profile. The report is refreshed annually, with interim updates when material events occur, and a final pre-delivery pass completed so clients receive the most current view available.
Mordor Intelligence's Aviation Infrastructure Market Size Compared Against Other Published Estimates
Published market sizes for aviation infrastructure can vary even when the topic label looks similar, because the boundary of what counts as infrastructure spending is not set the same way by every publisher. Differences in time windows, currency timing, and whether project values are counted at announcement or at execution also create visible gaps.
By tracking execution-linked capex signals, phasing multi-year project values into annualized spend, and refreshing currency timing consistently, Mordor Intelligence keeps the estimate tied to what is more likely to be realized within airport and air navigation infrastructure programs rather than just listed pipelines. Some sources appear to mix adjacent categories like broader aviation services, or they lean heavily on long-horizon growth assumptions without showing how price and volume move year by year.
Benchmark comparison
| Source | Market Size | Gaps in Research Methodology |
|---|---|---|
| Mordor Intelligence | USD 0.91 T (2026) | |
| Trade Publisher A | USD 0.87 T (2024) | Uses an earlier base year and a broader categorization approach, and the sizing appears closer to a snapshot valuation without clearly separating announced pipeline value from executed yearly infrastructure spend. |
| Industry Research Outlet B | USD 0.87 T (2023) | Focuses on airport infrastructure categories like greenfield and brownfield applications, which can exclude parts of air navigation and related systems, and it can also differ on whether values reflect booked activity versus planned projects. |
The comparison shows that most of the spread comes from timing and scope, along with how project pipelines are converted into annual market value. When the scope is kept consistent and the same activity signals are used to sanity-check yearly movement, the resulting market size becomes easier to reconcile and repeat across refresh cycles.
Key Questions Answered in the Report
What is the Aviation Infrastructure market size in 2026 and what CAGR is expected through 2031?
The sector is valued at USD 0.91 trillion in 2026 and is projected to expand at a 5.13% CAGR to 2031.
Which region represents the largest market in 2026?
The Middle East is the largest regional market in 2026 and is projected to expand at a 6.23% CAGR on the back of mega-hub investments in Saudi Arabia, the UAE, and Qatar.
Why are landside facilities expected to outpace airside spending?
Airports aim to raise non-aeronautical revenue through retail, parking, and automated baggage systems, driving a 5.95% landside CAGR.
What proportion of 2025 investment went to green-field airports?
Green-field projects captured 52.78% of 2025 spending, led by large-scale builds in China, India, and Saudi Arabia.
How do long-term concessions influence service-provider dynamics?
Lifecycle-focused concessions shift emphasis to operations-and-maintenance specialists, who are forecast to grow 6.11% annually through 2031.
What is the primary funding risk facing new airport projects?
Higher interest rates have reduced PPP deal flow, pushing some projects below investor return thresholds and delaying USD 6.2 billion in planned expansions.
How are vertiports shaping future infrastructure plans?
Regulatory approvals for eVTOL services are prompting airports in Dubai, Los Angeles, and Munich to allocate land and capital for purpose-built vertiports.