
Autonomous Mobile Robot Market Size and Share
Market Overview
| Study Period | 2020 - 2031 |
|---|---|
| Market Size (2026) | USD 5.18 Billion |
| Market Size (2031) | USD 10.56 Billion |
| Growth Rate (2026 - 2031) | 15.31% CAGR |
| Fastest Growing Market | Middle East and Africa |
| Largest Market | Asia Pacific |
| Market Concentration | Medium |
Major Players *Disclaimer: Major Players sorted in no particular order Image © Mordor Intelligence. Reuse requires attribution under CC BY 4.0. | |
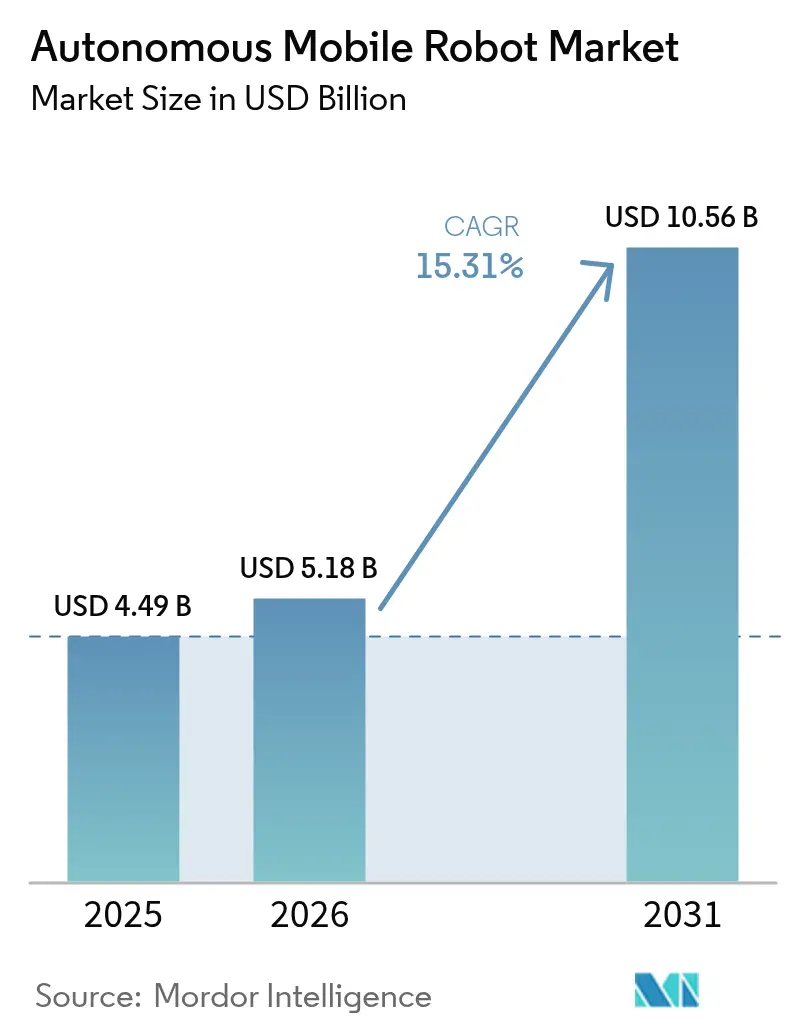
Autonomous Mobile Robot Market Analysis by Mordor Intelligence
Autonomous Mobile Robot Market size in 2026 is estimated at USD 5.18 billion, growing from 2025 value of USD 4.49 billion with 2031 projections showing USD 10.56 billion, growing at 15.31% CAGR over 2026-2031.
Fast adoption of artificial intelligence, 5G-Advanced connectivity and lower-cost lithium-ion batteries together accelerate commercial feasibility across fulfilment, manufacturing and healthcare environments. Operators deploy robots to offset persistent labour shortages, to gain 24/7 throughput without building fixed conveyor infrastructure and to improve workplace safety. Asia-Pacific leads adoption thanks to Chinese suppliers that blend software-centric design and aggressive pricing, while Middle East mega-projects generate fresh demand for heavy-duty systems. Competitive intensity rises as vendors race to embed fleet-level orchestration software and to secure channel partnerships that shorten time-to-value. Regulatory incentives, such as EU “Factory of the Future” grants, further stimulate uptake by subsidizing capital outlays for small and mid-sized enterprises.
Key Report Takeaways
- By type, unmanned ground vehicles held 45.42% of autonomous mobile robot market share in 2025, while humanoids are projected to grow at 18.74% CAGR to 2031.
- By navigation technology, LiDAR SLAM commanded 40.88% revenue share in 2025; vision-based systems are set to expand at 20.64% CAGR through 2031.
- By payload capacity, the 100–500 kg class captured 37.22% share of the market size in 2025, whereas robots above 1,000 kg will advance at 18.21% CAGR over the outlook period.
- By end-user industry, warehouse and logistics accounted for 32.94% of the autonomous mobile robot market size in 2025; healthcare is forecast to post the fastest 19.04% CAGR to 2031.
- By geography, Asia-Pacific dominated with a 37.12% revenue share in 2025, while the Middle East and Africa region is poised for a 18.46% CAGR between 2026 and 2031.
Note: Market size and forecast figures in this report are generated using Mordor Intelligence’s proprietary estimation framework, updated with the latest available data and insights as of 2026.
Global Autonomous Mobile Robot Market Trends and Insights
Drivers Impact Analysis*
| Driver | (~) % Impact on CAGR Forecast | Geographic Relevance | Impact Timeline |
|---|---|---|---|
| Rapid e-commerce fulfilment demand | 3.20% | Global, with concentration in North America & APAC | Short term (≤ 2 years) |
| Scarcity of warehouse labor in OECD markets | 2.80% | North America & EU primarily, spillover to APAC | Medium term (2-4 years) |
| Falling Li-ion battery $/kWh below USD 70 | 2.10% | Global | Medium term (2-4 years) |
| Post-2025 EU "Factory of the Future" grants | 1.40% | Europe, with technology transfer to other regions | Long term (≥ 4 years) |
| 5G-Advanced private network roll-outs | 1.80% | APAC core, spillover to North America & EU | Long term (≥ 4 years) |
| AI-enabled "swarm orchestration" platforms | 2.30% | Global | Medium term (2-4 years) |
| Source: Mordor Intelligence | |||


Rapid e-commerce fulfilment demand
Online retail now hinges on same-day delivery expectations. Amazon surpassed 1 million deployed robots by July 2025 and cut travel time per pick by 10% through DeepFleet fleet intelligence, proving that mobile automation can quadruple throughput using the same headcount. Locus Robotics crossed 3 billion picks after integrating its LocusOne software, which doubled to tripled productivity while reducing injuries by 80%. Retailers are therefore adopting compact autonomous mobile robot market solutions that flex with seasonal volumes and require minimal facility changes. Vision-only navigation, showcased in the Geek+-Intel design, trims installation cost and time because no fixed markers are needed. [1]Amazon, “DeepFleet AI Cuts Travel Time,” aboutamazon.com
Scarcity of warehouse labour in OECD markets
OECD operators report persistent vacancies for night and peak-season shifts. The European Agency for Safety and Health at Work highlights automation as essential for offsetting shrinking working-age populations. Skechers logged 80% energy savings after replacing conveyors with robots, validating the return on investment where skilled labour is scarce. Employers now redesign rolls around robot supervision and maintenance, making warehouse jobs less physically demanding and more attractive.[2]European Agency for Safety and Health at Work, “Automation and Workforce Demographics,” osha.europa.eu
Falling Li-ion battery cost below USD 70/kWh
Battery pack prices crossing below USD 70/kWh enable opportunity charging strategies that keep fleets online around the clock. Automotive scale has pushed cell energy density higher, allowing heavy-payload robots to operate longer without adding chassis weight. Predictive battery management further reduces total cost of ownership by optimizing charge cycles.
AI-enabled swarm orchestration platforms
Fleet-level optimization boosts capacity beyond individual robot efficiency. Amazon’s DeepFleet algorithms cut redundant travel by crowd-sourcing route data from the entire fleet. A joint 5G-robotics testbed showed 15% energy savings when compute loads shifted to edge servers. Such orchestration is central as operators integrate multiple robot types in a single site.
Restraints Impact Analysis*
| Restraint | (~) % Impact on CAGR Forecast | Geographic Relevance | Impact Timeline |
|---|---|---|---|
| Fragmented interoperability standards | -1.90% | Global, particularly affecting multi-vendor deployments | Medium term (2-4 years) |
| Cyber-physical security vulnerabilities | -1.50% | Global, with heightened concern in critical infrastructure | Short term (≤ 2 years) |
| High up-front capex for heavy-payload AMRs | -1.20% | Global, particularly affecting SMEs | Short term (≤ 2 years) |
| Union push-back on robot density limits | -0.80% | Primarily North America & EU | Long term (≥ 4 years) |
| Source: Mordor Intelligence | |||
Fragmented interoperability standards
ISO 3691-4 and ANSI/RIA R15.08 detail safety, yet they omit fleet communication protocols, forcing buyers into single-vendor ecosystems and inflating integration cost. Middleware suppliers attempt to bridge gaps, but proprietary data formats slow deployment and reduce bargaining power. [3]ANSI, “ISO 3691-4 and R15.08 Safety Standards,” ansi.org
Cyber-physical security vulnerabilities
Robots now link operational technology with enterprise IT, widening the attack surface. The European Union’s NIS2 directive raises compliance hurdles, and a breach could hijack fleets or leak sensitive inventory data. Manufacturers increasingly mandate encrypted command channels and zero-trust architectures before approving new market projects.
*Our forecasts treat driver/restraint impacts as directional, not additive. The impact forecasts reflect baseline growth, mix effects, and variable interactions.
Segment Analysis
By Type: Humanoids Drive Next-Generation Versatility
Unmanned ground vehicles controlled 45.42% revenue in 2025. Humanoids, although young, are forecast to expand at 18.74% CAGR because they navigate human-designed spaces without layout changes. Amazon is piloting humanoid couriers that load parcels from Rivian electric vans, hinting at outdoor extension of the autonomous mobile robot market. Unmanned aerial and marine robots remain niche but critical for inspection in energy assets. The autonomous mobile robot market size for humanoids is likely to rise quickly once manipulation reliability reaches warehouse performance benchmarks.
Traditional fleets rely on specialized form factors that optimize one task but lack versatility. Humanoids promise fleet simplification because one platform can switch roles, from shelving to sorting. Investment has therefore shifted from pure mobility hardware to artificial intelligence vision and grasping capability that matches human dexterity. This transition will lower life-cycle cost and unlock new service models such as robot-as-a-service subscriptions.


By Navigation Technology: Vision Systems Challenge LiDAR Dominance
LiDAR SLAM held 40.88% share in 2025 because of millimetre-level repeatability in congested aisles. Vision-based systems, expanding at 20.64% CAGR, eliminate expensive sensors and reflective targets, which reduces capital outlay for mid-market operators. Geek+ demonstrated LiDAR-equivalent accuracy through Intel RealSense depth cameras and onboard AI. The autonomous mobile robot market size for vision navigation will further increase as edge processors handle real-time image segmentation at lower power budgets.
Hybrid sensor fusion combines cameras, LiDAR and inertial sensors so fleets can switch modes when dust, glare or bandwidth constraints appear. This adaptive approach supports mixed indoor-outdoor operations that warehouses at ports now demand. Standards that certify performance across modalities will accelerate multi-sensor adoption, ensuring safety as robots cross public walkways.
By Payload Capacity: Heavy-Duty Applications Accelerate Growth
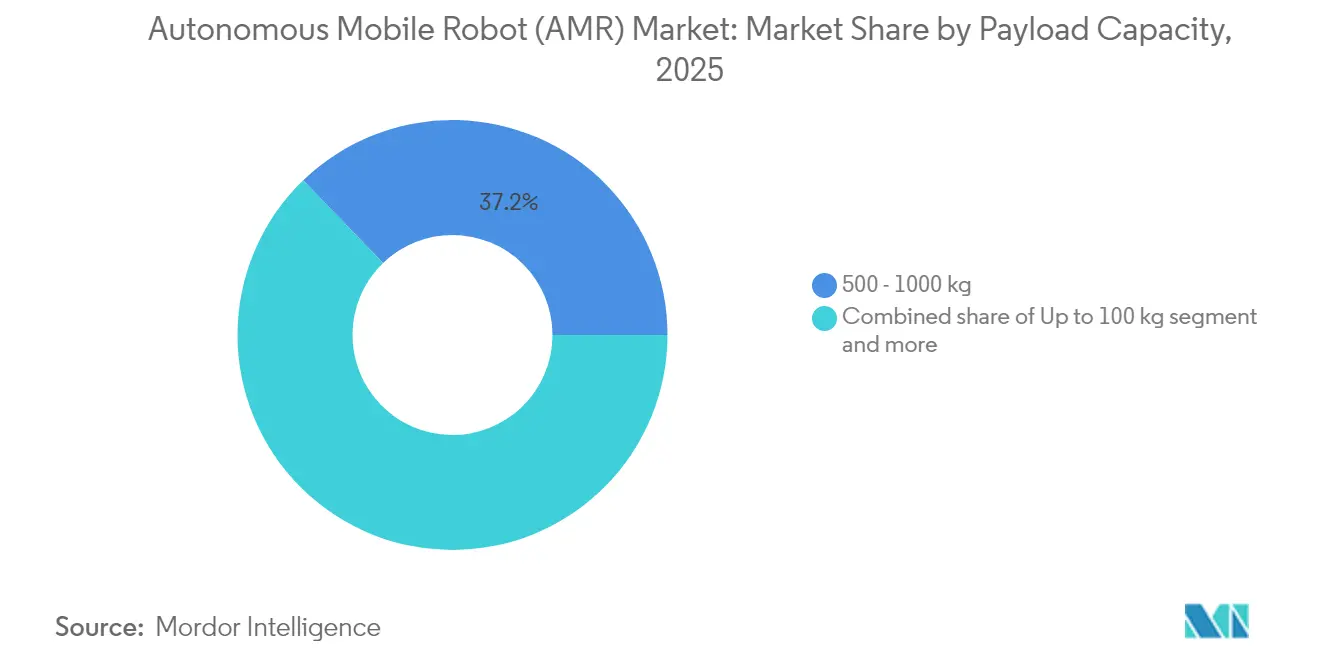
Robots that move between 100 kg and 500 kg hold 37.22% of autonomous mobile robot market share in 2025 because this weight class is ideal for shuttling totes, cartons and light parts around busy warehouses. The very largest machines—those rated above 1,000 kg—are catching up fast with an 18.21% CAGR through 2031 as car makers and other heavy industries look for mobile platforms that can carry engines, frames and other bulky loads that fixed conveyors cannot handle. At the opposite end, sub-100 kg units carve out niches in hospitals and labs where gentle, contamination-free transport matters more than brute strength.
The mid-range 500–1,000 kg category bridges warehouse and factory work. These robots can lift full pallets yet still weave through narrow aisles, giving operators the best of both worlds. Recent gains in lithium-ion battery density let every class, and especially the heavy rigs, run longer shifts without adding excess weight. Looking ahead, engineers are designing modular decks that let the same base unit switch between payload brackets, a change that should make the autonomous mobile robot market size grow as buyers invest in one platform instead of several.
By End-user Industry: Healthcare Leads Growth Transformation
Warehouse and logistics users remain the backbone of demand with 32.94% of the autonomous mobile robot market size in 2025, driven by e-commerce peaks that require fast, flexible picking lines. Healthcare, however, is the breakout story: hospitals are adopting cleaning and medicine-delivery robots at a 19.04% CAGR to curb staff shortages and improve infection control. Manufacturers follow close behind as assembly lines rely on fleets for just-in-time parts runs, while automotive plants add specialized mobile robots that can adjust when model mixes change.
Food and beverage processors favor stainless-steel robots that meet hygiene codes; KUKA’s automated cheese line, which doubled capacity while holding food-safety standards, shows the payoff. Defense sites use robots for base logistics and patrols, and mining and energy operators send them into zones too risky for people. Even oil and gas facilities now deploy explosion-rated units that inspect remote wellheads where traditional automation would be costly and hard to maintain. This widening spread of use cases underlines how far the technology has matured since the early single-task days.
Geography Analysis
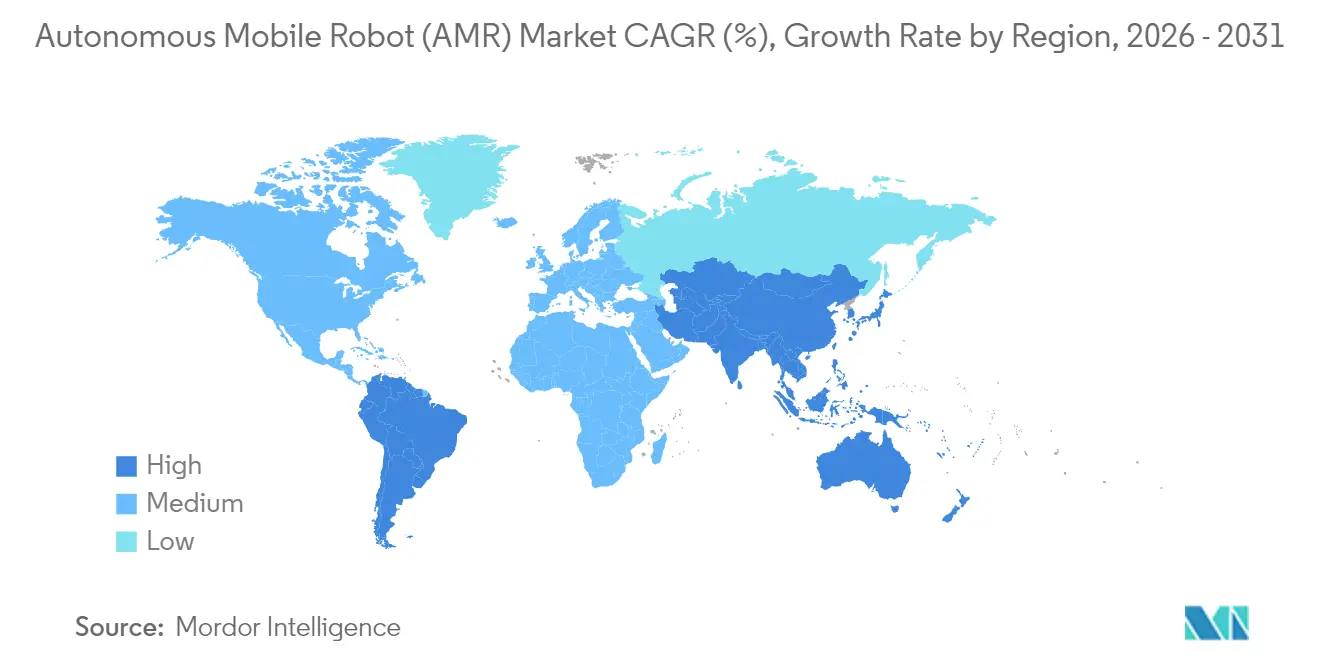
Asia-Pacific generated 37.12% of 2025 revenue. Chinese firms such as Geek+ export over one-third of production, leveraging cost advantages and government support programs that expedite piloting. Many Japanese and Korean factories now source robots from Chinese brands to cut payback periods. North America remains the second-largest autonomous mobile robot market owing to Amazon’s multi-site expansion and a deep ecosystem of software startups that tailor orchestration layers for third-party logistics providers.
Europe benefits from structured subsidies. The EU “Factory of the Future” initiative reimburses up to 20% of automation hardware capital expenditure, which accelerates adoption among mid-sized manufacturers. The autonomous mobile robot market share for Europe will rise as grants kick in post-2025. The Middle East and Africa is the fastest-growing region at a 18.46% CAGR, driven by Saudi Arabia’s Vision 2030 and NEOM’s USD 774.6 million commitment to construction robotics. High logistics spend and greenfield warehouses allow operators to design around robots from day one.
South America remains early stage. Duty exemptions on imported automation in Brazil and Mexico encourage pilots, yet currency volatility slows wide rollout. Africa’s uptake concentrates in South Africa and Morocco where automotive assembly plants demand just-in-time delivery to lineside.

Regulatory Landscape
Safety compliance for autonomous mobile robots is anchored by industrial truck and mobile robot standards, led by ISO 3691-4:2023 for driverless industrial trucks (commonly applied to AMRs) and the US voluntary consensus standard ANSI/RIA R15.08 for industrial mobile robots. In the United States, enforcement commonly routes through OSHA requirements and the General Duty Clause, with citations tied to broader workplace safety provisions such as machine guarding and lockout/tagout, rather than an AMR-specific federal rulebook.
In Europe, the compliance perimeter is expanding beyond machine safety into AI governance. The EU AI Act (Regulation (EU) 2024/1689) treats AI used as a safety component of machinery as a high-risk category, adding obligations for providers and deployers that operate AMR fleets with AI-driven perception and decision-making, with August 2026 a key operational milestone for high-risk requirements. Separately, the EU Machinery Regulation (EU) 2023/1230 resets conformity assessment expectations for machinery and safety components, with full application effective January 14, 2027, pushing AMR suppliers to align technical files and risk management across both machine safety and AI controls.
Value Chain Analysis
The AMR value chain begins with upstream components, including Li-ion cells and packs, motors, bearings and drivetrains, sensors such as LiDAR and cameras, compute modules, and AI chips, which feed robot OEMs and subsystem integrators building platforms, safety architectures, and navigation stacks (SLAM, perception, and motion planning). Midstream value increasingly shifts to software layers that orchestrate fleets, covering task allocation, traffic management, digital twins, and warehouse execution integrations, followed by system integrators and channel partners that design workflows, validate safety, and commission multi-robot operations across warehouses, factories, and hospitals; downstream, end users often contract for lifecycle services such as maintenance, spares, and uptime guarantees under robot-as-a-service models.
Procurement patterns point to supply-chain and deployment readiness as differentiators, not just robot performance. Hardware scale-up depends on component availability, including mechanical motion parts and AI compute, which can elongate lead times and raise unit costs when robotics competes with broader semiconductor demand. On the demand side, large deployment frameworks and partnership-led rollouts show how value moves from proof-of-concept to repeatable programs, including DHL Group signing an MoU with Boston Dynamics in May 2025 for deployment of more than 1,000 additional Stretch robots, and Melco Mobility Solutions ordering nearly 100 Cartken Hauler robots in June 2025 for industrial facility workflows in Japan.
Competitive Landscape
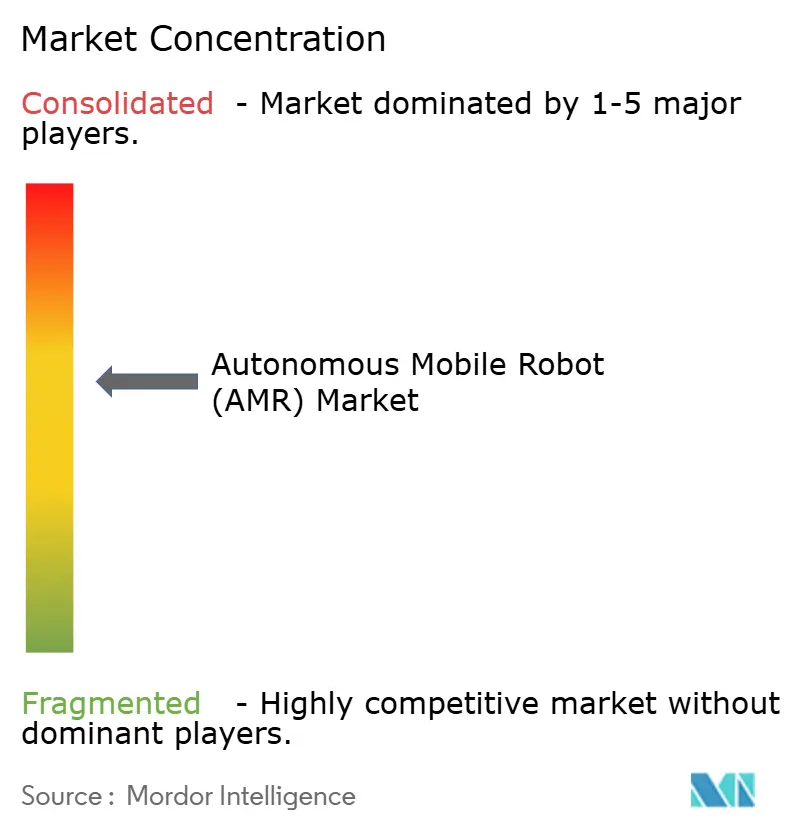
Competition is moderately fragmented. Amazon’s fleet of more than 1 million robots gives it scale benefits and proprietary data that trains DeepFleet traffic models. Teradyne integrates Mobile Industrial Robots with Universal Robots and AI vision to offer turnkey cells. Traditional automation giants such as ABB now bundle mobile platforms with collaborative arms for a complete order-to-pack solution.
Software is the new battleground. Locus Robotics, valued near USD 2 billion after its Series F round, licenses LocusOne to brands that prefer a hardware-agnostic route. Geek+ focuses on vision-only navigation to underprice LiDAR rivals by up to 20% while maintaining safety compliance. Siemens partners with Teradyne to showcase edge orchestration at its Chicago MxD center, signalling a move toward open ecosystems.
Start-ups carve niches in healthcare, mining and heavy payloads. However, consolidation pressure rises because global customers prefer vendors that can certify cybersecurity, provide 24/7 support and finance robot-as-a-service contracts. Expect more mergers as incumbents acquire AI route-planning or battery analytics specialists.
Autonomous Mobile Robot Industry Leaders
Zebra Technologies Corporation (Fetch Robotics)
Geek+ Technology Co., Ltd.
Teradyne Inc. – Mobile Industrial Robots A/S
Seegrid Corporation
Vecna Robotics, Inc.
- *Disclaimer: Major Players sorted in no particular order

Market Opportunities and Future Outlook
A notable whitespace is multi-vendor fleet interoperability and communication, where buyers want to avoid single-vendor lock-in while deploying mixed navigation modalities, including LiDAR SLAM, vision-based, and hybrid fusion, across large sites. Formalizing interoperability is supported by ISO/FDIS 21423 advancing in March 2026, which signals active standardization work for industrial mobile robot communication. This creates traction for orchestration software, middleware, and integrators able to operationalize mixed fleets while aligning with safety requirements such as ISO 3691-4 and ANSI/RIA R15.08.
Another opportunity is end-to-end automation of warehouse workflows that still rely on manual handling, especially inbound logistics from trailer unloading through palletizing and storage. In July 2026, Ambi Robotics and Pickle Robot Company integrated their AI-powered systems into an end-to-end inbound logistics solution, illustrating a shift from point solutions toward connected workflows where AMRs, perception, and manipulation technologies are packaged as a unified process outcome. Product activity also indicates demand for higher-throughput, lower-infrastructure deployments, including AMR launches such as OMRONs LD-150 and LD-300 (July 2026) and ABBs Flexley Stack F712 autonomous forklift with Visual SLAM (July 2026), reinforcing opportunities around vision-forward navigation, rapid commissioning, and scalable fleet management in dynamic facilities.
Recent Industry Developments
- June 2026: Zebra Technologies completed the sale of Fetch Robotics assets to Skild AI. The transaction moved Fetchs AMR capabilities under a physical AI platform strategy, tightening the link between advanced autonomy software and mobile robot deployment programs.
- May 2026: Geek+ partnered with Mindugar to accelerate warehouse automation adoption across Latin America. The agreement expanded Geek+ regional go-to-market reach through a local partner model, supporting deployments that emphasize fast commissioning and software-led fulfillment workflows.
- December 2025: Teradyne announced plans to open a US operations hub in Wixom, Michigan, to manufacture Universal Robots collaborative robots, with scope that could extend to future Mobile Industrial Robots production. The investment strengthened North American manufacturing and service capacity, helping shorten lead times and improve lifecycle support for automation customers standardizing on Teradynes robotics portfolio.


Research Methodology Framework and Report Scope
Market Definition and Coverage
For this study, the autonomous mobile robot market covers robot systems that can sense, plan routes, and move goods or perform tasks with minimal human driving, using navigation technologies such as mapping and localization to operate in real facilities.
Scope exclusions: We exclude purely manual carts, fixed industrial robots that do not travel, and general building automation equipment unless it is sold as part of an autonomous mobile robot system.
Segmentation Overview
- By Type
- Unmanned Ground Vehicles (UGV)
- Humanoids
- Unmanned Aerial Vehicles (UAV)
- Unmanned Marine Vehicles (UMV)
- By Navigation Technology
- LiDAR SLAM
- Vision-based (2D/3D camera)
- Magnetic / Inductive / QR Guided
- Hybrid & Multi-Sensor Fusion
- By Payload Capacity
- Up to 100 kg
- 100 - 500 kg
- 500 - 1,000 kg
- Above 1,000 kg
- By End-user Industry
- Warehouse and Logistics
- Manufacturing
- Automotive
- Food and Beverage
- Healthcare
- Retail and E-commerce
- Defense and Security
- Mining and Minerals
- Energy and Power
- Oil and Gas
- By Geography
- North America
- United States
- Canada
- Mexico
- Europe
- United Kingdom
- Germany
- France
- Italy
- Rest of Europe
- Asia-Pacific
- China
- Japan
- India
- South Korea
- Rest of Asia-Pacific
- Middle East
- Israel
- Saudi Arabia
- United Arab Emirates
- Turkey
- Rest of Middle East
- Africa
- South Africa
- Egypt
- Rest of Africa
- South America
- Brazil
- Argentina
- Rest of South America
- North America
Data Sources, Market Sizing, and Validation
Desk Research
Desk research was used to set the market boundaries, identify demand pools, and gather reference indicators that can be checked year after year. We relied on public sources such as the International Federation of Robotics publications, US Census Bureau and Bureau of Labor Statistics time series, Eurostat industrial activity datasets, and customs trade statistics for robotics related categories where available, along with patents and standards literature (for example, ISO pages and patent databases).
To make the numbers usable in a model, secondary reading also included annual reports, earnings decks, and product documentation from relevant manufacturers and integrators, plus reputable press coverage of warehouse automation and manufacturing investments. A paid subscription for company financials and news was used selectively to normalize revenue splits and validate timelines for capacity expansions and new deployments. These sources are illustrative only, and additional public references were also reviewed for data collection, cross-checking, and clarification.
Primary Interviews and Surveys
Primary work focused on interviews and short surveys with robot OEMs, component suppliers, system integrators, and end users operating large fleets in warehouses and factories. We used these discussions to confirm adoption rates, typical pricing ranges (robot and software), lead times, and how buyers define an AMR versus adjacent equipment, and then the feedback was used to reconcile gaps seen in desk research across APAC, EMEA, and the Americas.
Distribution of primary research fieldwork respondents
| Company type | Respondent position | Region |
|---|---|---|
| Top tier: 28% | CXOs: 13% | APAC: 45% |
| Mid tier: 56% | Functional/Unit leaders: 43% | EMEA: 37% |
| Smaller Players: 16% | Managers: 44% | Americas: 18% |
Market-Sizing & Forecasting
The sizing starts with a top-down build where shipment and deployment signals are translated into a global revenue pool using reasonable price ladders, and then split by end-use adoption patterns. To keep the totals realistic, we corroborated the output with selective bottom-up approximations, such as sampled average selling price times units for key use cases, along with channel checks from integrators, before final numbers were locked.
Inputs that mattered most included the pace of warehouse automation projects, manufacturing output trends, labor cost and labor availability indicators that influence payback periods, typical fleet sizes per site, and the share of deployments that are software-enabled (fleet management, navigation, and safety). We also tracked technology cues such as LiDAR and SLAM adoption and battery type preferences, since they affect pricing and replacement cycles.
For forecasting, scenario analysis was used to translate macro and industry signals into adoption paths, which were then tuned using expert consensus from interviews on purchasing cycles and budget plans. Where bottom-up detail was missing in smaller countries or newer applications, ratios from comparable markets were applied and adjusted for local industrial activity and logistics intensity.
Data Validation & Update Cycle
Validation is done through repeated cross-checks so the final series stays consistent with observable market signals. We compare outputs against independent indicators such as automation spending direction, manufacturing and warehousing activity, and stated deployment momentum, and then investigate any large jumps that do not match the story from stakeholders.
Before sign-off, the model goes through multi-step analyst review where assumptions, currency conversions, and year-to-year growth logic are checked, followed by re-contact triggers when a gap or variance looks material. The report is refreshed annually, and interim updates are made when major events impact demand or pricing. Right before delivery, a final pass is completed so clients receive the most current view.
Mordor Intelligence's Autonomous Mobile Robot Market Size Compared Against Other Published Estimates
Published market sizes for autonomous mobile robots can look far apart, even when they sound like they cover the same topic. The differences usually come from how each study draws the line around what counts as an AMR, which year is treated as the anchor, and how pricing and adoption are projected.
In this market, the key gap drivers tend to be whether adjacent categories are included (like broader mobile robotics platforms), how software and services are treated versus hardware-only pricing, and whether the estimate relies on optimistic rollout assumptions for warehouses and factories. Currency timing, the use of 2025 versus 2026 as the reference year, and how quickly pricing is assumed to fall with scale can also move the final number.
Benchmark comparison
| Source | Market Size | Gaps in Research Methodology |
|---|---|---|
| Mordor Intelligence | USD 4.49 B (2025) | |
| Industry Publisher A | USD 3.04 B (2025) | Often reflects a narrower revenue capture, where pricing and revenue attribution can lean toward core warehouse AMR use cases and may not consistently count broader autonomous robot types or full system value. |
| Industry Publisher B | USD 2.77 B (2025) | The estimate can trend lower when the scope is tighter on included revenues, and when software and services are treated cautiously or excluded from the counted spend in early adoption years. |
The table shows a spread for 2025 that is mainly explained by what is counted as revenue and how wide the robot coverage runs, and in Mordor Intelligence's model the sizing aligns to a broader autonomous robot scope plus related value elements that are validated through pricing and deployment checks. Once scope is normalized and assumptions are tied back to observable adoption signals, the remaining gap typically reduces to differences in ASP progression and refresh timing.


Key Questions Answered in the Report
What is the growth outlook for the autonomous mobile robot market through 2031?
The market is projected to expand from USD 5.18 billion in 2026 to USD 10.56 billion in 2031, registering a 15.31% CAGR.
Which region leads autonomous mobile robot adoption today?
Asia-Pacific holds 37.12% of 2025 revenue, driven by Chinese manufacturers that combine software differentiation with lower cost structures.
What segment shows the fastest growth by robot type?
Humanoid robots lead with a forecast 18.74% CAGR because they work in human-oriented spaces without infrastructure changes.
Why are vision-based navigation systems gaining share?
They remove pricey LiDAR and reflective targets, cutting commissioning time and capital cost while maintaining navigational accuracy.
How do AI fleet orchestration platforms improve performance?
Fleet-level algorithms optimize traffic flow and task allocation, reducing travel time by up to 10% and boosting overall throughput.
Page last updated on:


