
Autonomous Delivery Robots Market Size and Share
Market Overview
| Study Period | 2022 - 2031 |
|---|---|
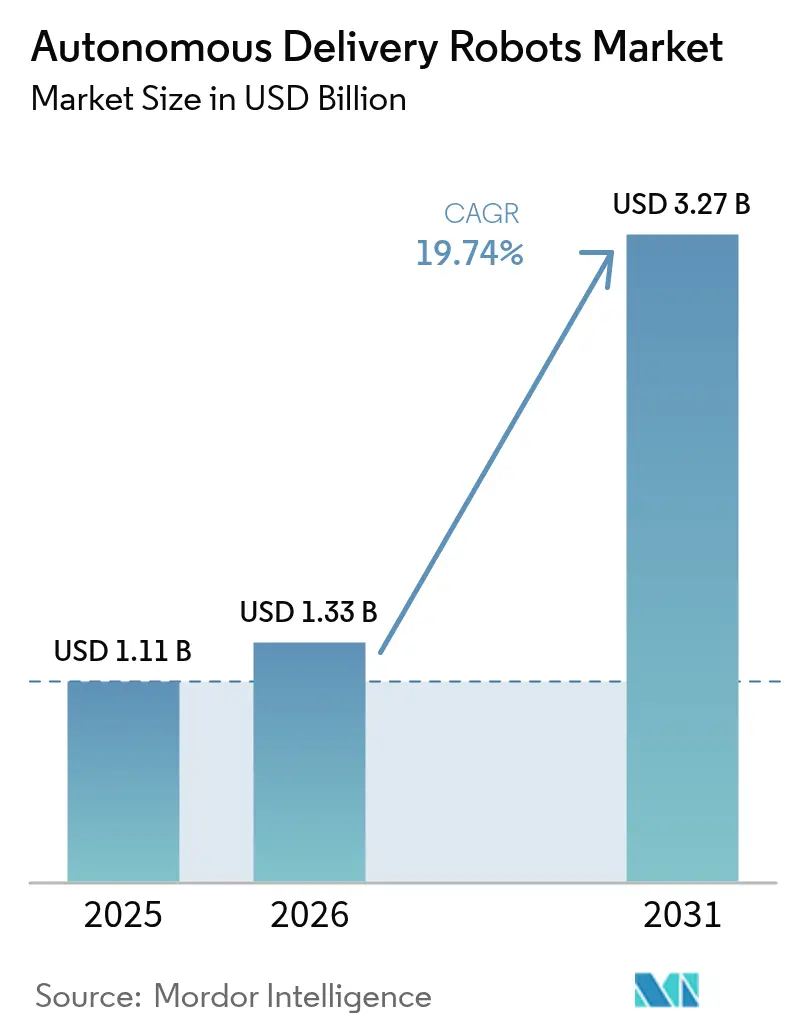
| Market Size (2026) | USD 1.33 Billion |
| Market Size (2031) | USD 3.27 Billion |
| Growth Rate (2026 - 2031) | 19.74 % |
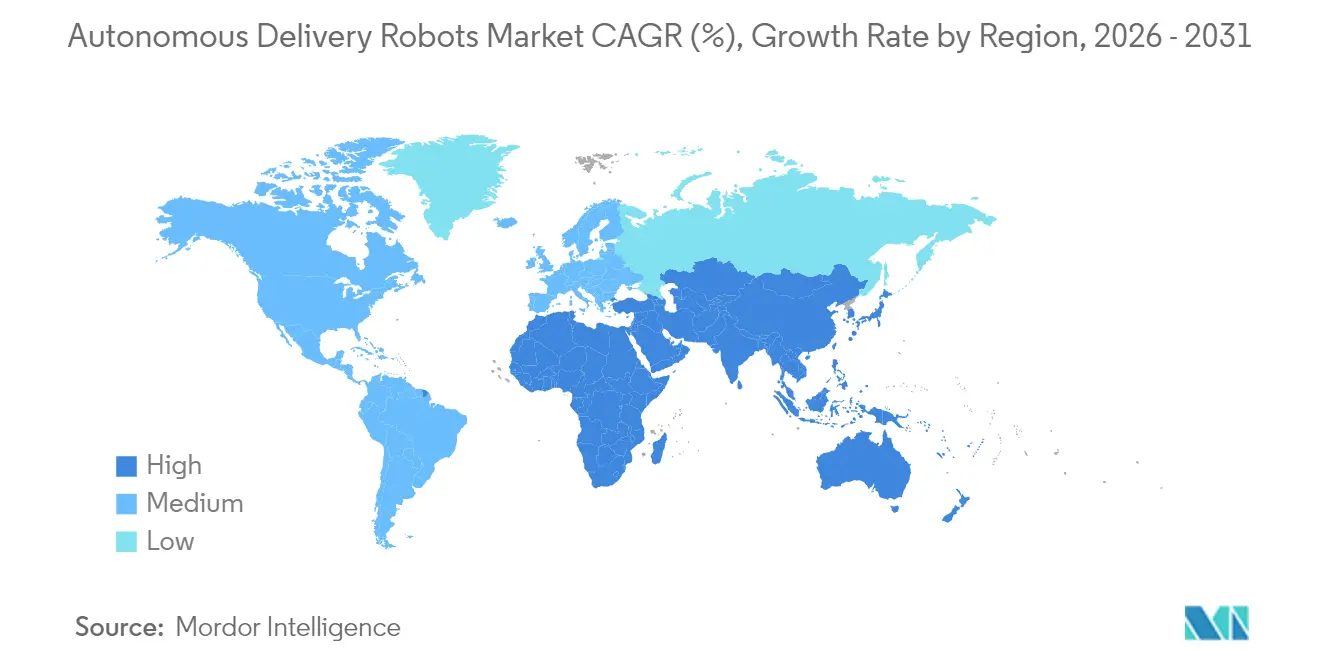
| Fastest Growing Market | Asia Pacific |
| Largest Market | North America |
| Market Concentration | Low |
Major Players *Disclaimer: Major Players sorted in no particular order Image © Mordor Intelligence. Reuse requires attribution under CC BY 4.0. | |
Autonomous Delivery Robots Market Analysis by Mordor Intelligence
The autonomous delivery robots market size is expected to grow from USD 1.11 billion in 2025 to USD 1.33 billion in 2026 and is forecast to reach USD 3.27 billion by 2031 at 19.74% CAGR over 2026-2031. Growth is grounded in rising labor shortages, swift technological maturation, and supportive regulations that ease sidewalk deployments. Major logistics spenders continue to view the technology as mission-critical; Amazon alone targets USD 200 billion of automation savings through robotic solutions. North America leads adoption thanks to 32.1% 2024 share, while Asia-Pacific follows at 25% as aging populations increase demand for contact-free healthcare logistics. Outdoor sidewalk robots dominate with 58% share, and hybrid all-terrain units post the fastest 27.8% CAGR, signaling a clear preference for platforms that handle both urban and indoor routes. Competitive activity remains intense as venture-backed specialists scale fleets in partnership with delivery platforms, while automotive incumbents pursue healthcare and industrial niches. Headwinds tied to payload limits and high LiDAR costs persist, yet rapid sensor price declines and new community-engagement strategies point to a wider addressable base over the forecast horizon.
Key Report Takeaways
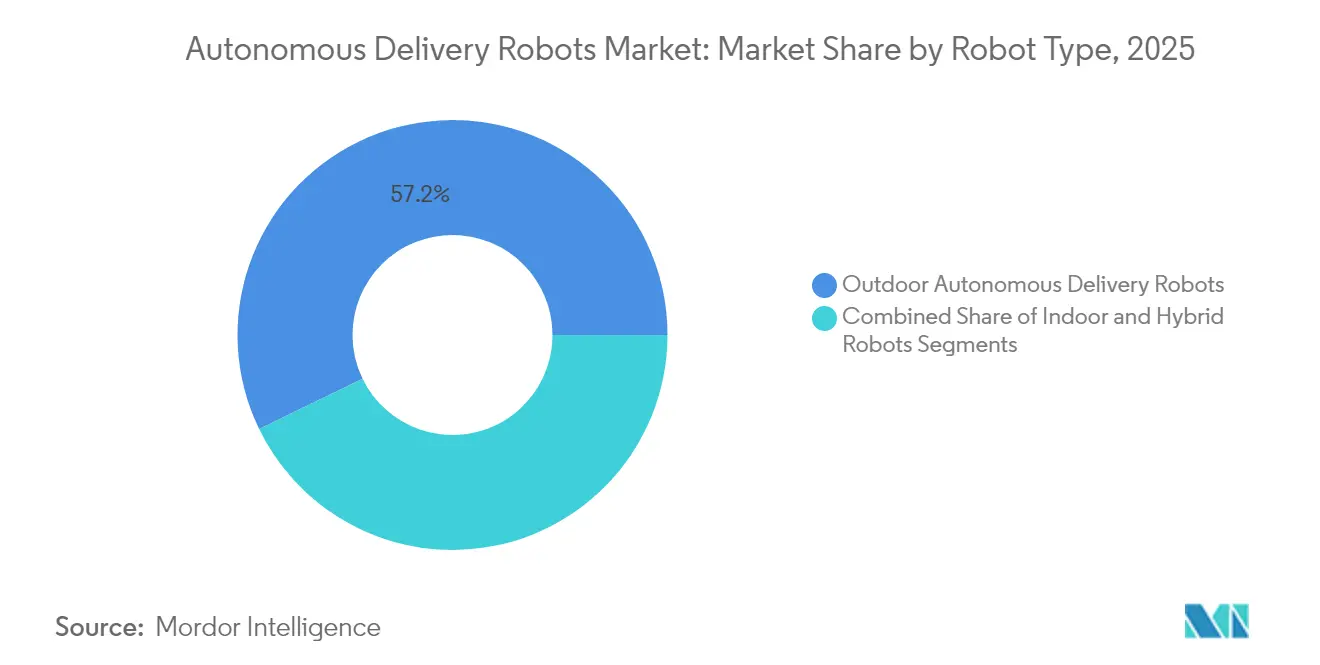
- By robot type, outdoor models held 57.20% of the autonomous delivery robots market share in 2025; hybrid all-terrain robots are forecast to expand at a 26.65% CAGR through 2031.
- By application, food delivery led with 42.10% revenue share in 2025; grocery and convenience deliveries are projected to record a 23.70% CAGR to 2031.
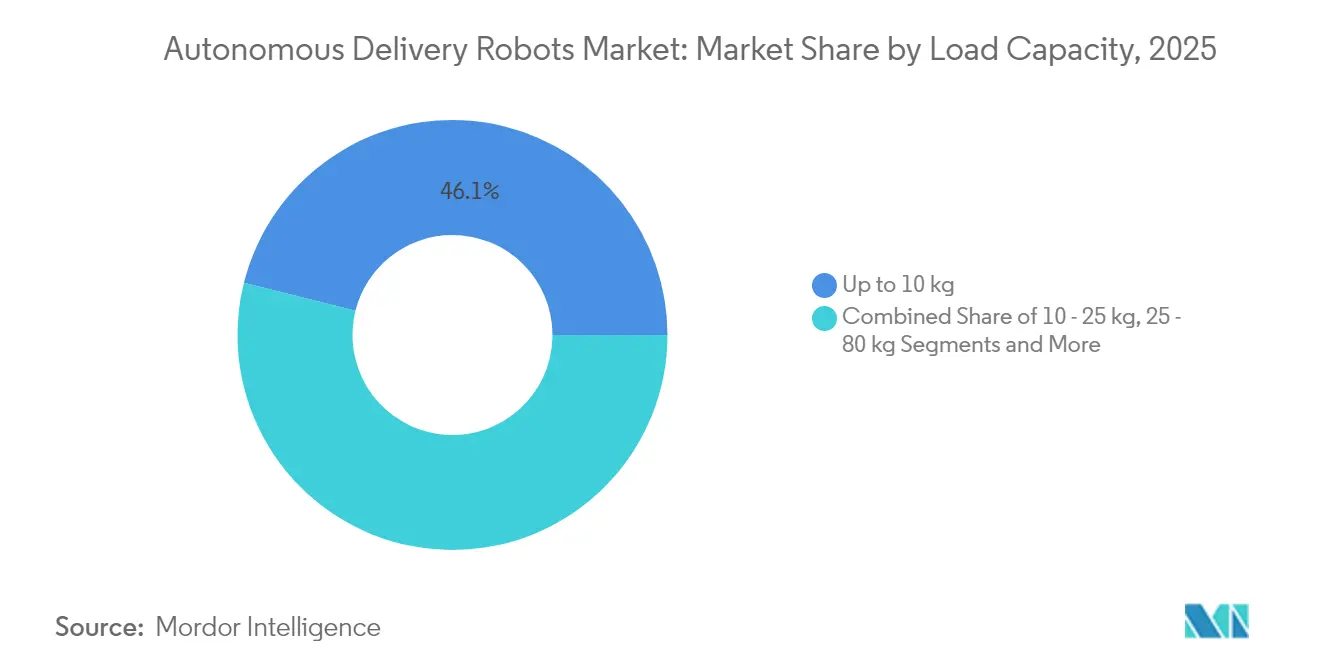
- By load capacity, units up to 10 kg accounted for 46.10% share of the autonomous delivery robots market size in 2025; robots above 80 kg show the highest 22.60% CAGR outlook.
- By end-user industry, retail and e-commerce logistics commanded 48.60% share in 2025, while healthcare facilities are advancing at a 24.90% CAGR to 2031.
- By propulsion, battery-electric systems captured 93.10% share in 2025; hydrogen fuel-cell platforms post a 30.20% CAGR from a small base.
- Serve Robotics, Starship Technologies, and Nuro collectively controlled 18% of global fleet deployments in 2024.
Note: Market size and forecast figures in this report are generated using Mordor Intelligence’s proprietary estimation framework, updated with the latest available data and insights as of 2026.
Market Trends and Insights
Drivers Impact Analysis of Autonomous Delivery Robots Market*
| DRIVER | (~) % IMPACT ON CAGR FORECAST | GEOGRAPHIC RELEVANCE | IMPACT TIMELINE |
|---|---|---|---|
| Rapid expansion of on-demand grocery delivery | +3.2% | Global, with concentration in North America & Europe | Medium term (2-4 years) |
| Rising labor shortages & wage inflation in North-American fulfillment | +4.1% | North America, spillover to Europe | Short term (≤ 2 years) |
| ESG-driven push for zero-emission last-mile vehicles in the EU | +2.8% | Europe, expanding to APAC | Long term (≥ 4 years) |
| Aging population spurring intra-hospital delivery automation in Japan | +1.9% | APAC core, particularly Japan & South Korea | Medium term (2-4 years) |
| 24/7 contact-free services demand in Middle-East luxury hotels | +1.4% | Middle East & Africa, premium segments globally | Short term (≤ 2 years) |
| 5G edge-compute enabling higher robot autonomy in dense city cores | +2.7% | Global, concentrated in tier-1 cities | Long term (≥ 4 years) |
| Source: Mordor Intelligence | |||
Rapid Expansion of On-Demand Grocery Delivery
On-demand grocery services now anchor sustainable unit economics for autonomous fleets because high order density offsets traditional driver costs. Kroger integrated driverless trucks into its Dallas operations to accelerate fulfillment and trim logistics spend. Retailers also embed in-store shelf-scanning robots to reduce the documented 4.5% revenue leakage linked to stock-outs, as shown by Simbe Robotics’ rollout across 60 SpartanNash stores. Together these moves confirm that grocery chains are shifting robotics from pilot status to core infrastructure, widening order volumes available to last-mile robots.[1]
Rising Labor Shortages and Wage Inflation
North American fulfillment centers face acute staffing gaps that push companies toward automated alternatives. The U.S. manufacturing sector projects a 2 million-worker shortage by 2030, and last-mile driver turnover amplifies cost pressure. Falling industrial robot prices—down 50% in the past decade—and further declines predicted by EY strengthen the investment case. High urban delivery density then allows operators to hit utilization targets that yield faster payback on autonomous assets.
ESG-Driven Push for Zero-Emission Last-Mile Vehicles
European rules that mandate carbon cuts in urban freight create structural advantages for compact electric robots over vans. Academic studies show potential energy savings above 40% when sidewalk robots replace traditional couriers. Starship Technologies already records 1.8 million kg of avoided CO₂ from more than 6 million completed orders, highlighting environmental payoffs aligned with EU climate goals. This alignment accelerates municipal permitting for zero-emission fleets.
Aging Population Spurring Intra-Hospital Delivery Automation
Japan’s demographic realities magnify nurse workload pressures, prompting hospitals to deploy autonomous couriers. Toyota’s Potaro robot now averages 170 medication runs per day by navigating ceilings-mounted cameras, freeing staff for patient care. South Korea complements the trend by legalizing sidewalk robots that meet strict safety caps, opening a path for wider healthcare and residential adoption.
Restraints Impact Analysis of Autonomous Delivery Robots Market*
| RESTRAINTS | (~) % IMPACT ON CAGR FORECAST | GEOGRAPHIC RELEVANCE | IMPACT TIMELINE |
|---|---|---|---|
| Limited payload capacity restricting ROI for bulk goods | -2.8% | Global, particularly affecting rural & suburban markets | Medium term (2-4 years) |
| High upfront cost of LiDAR & sensor suites | -3.4% | Global, with greater impact in price-sensitive markets | Short term (≤ 2 years) |
| Vandalism & theft incidents in S-American metros | -1.2% | Latin America, urban centers with security challenges | Short term (≤ 2 years) |
| Complex regulatory frameworks across jurisdictions | -2.1% | Global, particularly Europe & North America | Long term (≥ 4 years) |
| Source: Mordor Intelligence | |||
High Upfront Cost of LiDAR and Sensor Suites
Navigation hardware often accounts for the largest capital item in a delivery robot. Emerging ultrasonic alternatives such as Sonair cut sensor spend by up to 80% while keeping a 180 × 180 degree detection envelope. Cartken’s lidar-free vision stack already operates profitably on public sidewalks, proving that cost-efficient sensing can meet reliability thresholds. Even so, broad rollout waits on regulatory validation of these novel sensor mixes.[2]
Vandalism and Theft Incidents in South-American Metros
Security breaches increase operating costs through repairs, recovery, and real-time monitoring. Serve Robotics experienced vandalism during Uber Eats trials in Los Angeles, requiring police footage for incident resolution. Latin American cities pose similar challenges, where elevated theft risk necessitates hardened enclosures, GPS-locked cargo bays, and privacy-sensitive camera feeds—raising both capex and stakeholder engagement needs.
*Our forecasts treat driver/restraint impacts as directional, not additive. The impact forecasts reflect baseline growth, mix effects, and variable interactions.
Autonomous Delivery Robots Market Segment Analysis
By Robot Type:
Outdoor Dominance Drives Market EvolutionOutdoor robots generated 57.20% of 2025 revenue, anchoring the autonomous delivery robots market through well-tested sidewalk operations. This dominance reflects reliable partnerships with food aggregators and local regulators that allow scalable city deployments. Operators continue to refine chassis for curbs, crosswalks, and pedestrian interaction, reinforcing their urban stronghold.
Hybrid all-terrain units expand rapidly at 26.65% CAGR because retail and hospitality customers ask for seamless door-to-door service that crosses thresholds. Suppliers respond by integrating four-wheel steering, modular cargo pods, and ruggedized suspension, a trend evident in Avride’s pivot to NVIDIA-powered four-wheel platforms. Indoor service robots maintain niche roles in campuses and hospitals where controlled corridors permit higher autonomy without full street-grade sensing.

By Application:
Food Delivery Leadership Faces Grocery ChallengeFood delivery retained 42.10% revenue share in 2025, proving that frequent small-ticket orders still underpin the autonomous delivery robots market. High repetition optimizes asset utilization and simplifies route learning, supporting fleet-level profitability for platforms such as Serve Robotics.
Grocery and convenience segments rise 23.70% annually as retailers chase sub-hour fulfillment. Robots accommodate temperature-controlled totes and door-step protocols that boost basket size and tip-influenced economics. Parcel courier services also advance, but payload ceilings still limit heavier SKUs, keeping focus on lightweight e-commerce orders for now.
By Load Capacity:
Weight Limits Shape Market BoundariesUnits carrying ≤ 10 kg held 46.10% share of the autonomous delivery robots market size in 2025 because most meals and small parcels fall inside that envelope. Lightweight frames enable longer ranges on standard batteries and comply with sidewalk weight caps.
Demand for 80 kg-plus robots grows 22.60% per year as retailers test bulk grocery drops and campus mailcart equivalents. Development hinges on stronger drivetrains and denser batteries that do not breach curb weight laws. Mid-range categories stay important for pharmacy and multi-meal orders where single-trip value offsets additional energy draw.
By End-User Industry:
Retail Leadership Drives Ecosystem DevelopmentRetail and e-commerce companies captured 48.60% share in 2025, validating that shopper expectations for same-day delivery favor robotic help. Deployment at big-box grocers, convenience chains, and dark stores cements this segment’s primacy and steers vendor roadmaps toward food-safe containers and dynamic rerouting.
Healthcare facilities, rising at 24.90% CAGR, illustrate a premium niche where service reliability outweighs cost. Robots ferry medication, lab samples, and meals along predictable corridors, freeing staff and reducing infection exposure. Early wins at Japanese hospitals signal similar adoption prospects in Europe and North America as regulations mature.
Geography Analysis
North America Autonomous Delivery Robots Market
North America retained 31.60% share in 2025, reflecting high wage inflation and a supportive patchwork of state-level rules. California and Texas host the largest urban pilots, with Serve Robotics targeting 2,000 units by year-end 2025 under an Uber Eats framework. College-town deployments add scale; Grubhub and Yandex plan rollouts across 250 campuses, potentially forming the world’s densest robot network.
APAC Autonomous Delivery Robots Market
Asia-Pacific followed with a 25.40% stake as Japan and South Korea accelerate healthcare and smart-city programs. South Korea’s sidewalk-friendly legislation caps robot speed at 15 km/h and weight at 500 kg, unlocking commercial trials in apartment complexes and hospitals. Toyota’s Potaro system shows the model for intra-hospital use, highlighting APAC’s focus on aging-related logistics.
Europe Autonomous Delivery Robots Market
Europe contributes a solid revenue base, aided by stringent ESG mandates that penalize diesel vans in city centers. Starship Technologies operates in Germany and the UK under regulatory exemptions that let slow-moving robots share pedestrian zones. Operators still navigate complex, multi-jurisdiction approval processes, slowing scale, yet the environmental tailwinds keep adoption on a steady path.
Regulatory Landscape
Regulation for autonomous delivery robots continues to be shaped by local sidewalk rules alongside higher-level AV oversight, pushing operators to align safety cases and reporting practices across jurisdictions. In the United States, NHTSA advanced a national approach for automated driving systems (ADS) through the proposed ADS-equipped Vehicle Safety, Transparency, and Evaluation Program (AV STEP, RIN 2127-AM60) published in the Federal Register in January 2025, and reinforced ADS rulemaking as a priority in its July 2025 report to Congress, including work to expand the Automated Vehicle Exemption Program (AVEP) to domestic vehicles. USDOT also highlighted streamlining and safety in a new AV Framework announced in April 2025, and its 2026 Regulatory Agenda (July 2026 update) underscored accelerated federal activity aimed at reducing state-by-state fragmentation that complicates multi-city deployments.
International standards add another compliance anchor as vendors move from pilots to repeatable rollouts and procurement-driven certification. ISO standards used in mobile robotics safety (for example, ISO 3691-4) and telecommunications guidance relevant to connected autonomy (for example, ITU-T Y.4607 issued in July 2024 and ITU-T Y.4506 issued in January 2025) support interoperability and risk management for connected fleets. In Europe, the pipeline also includes work such as IEC 63281-2-2 (drafted in 2025), reflecting ongoing standardization efforts that help buyers, insurers, and municipalities evaluate safety and operational controls for sidewalk and mixed-environment robots.
Competitive Landscape
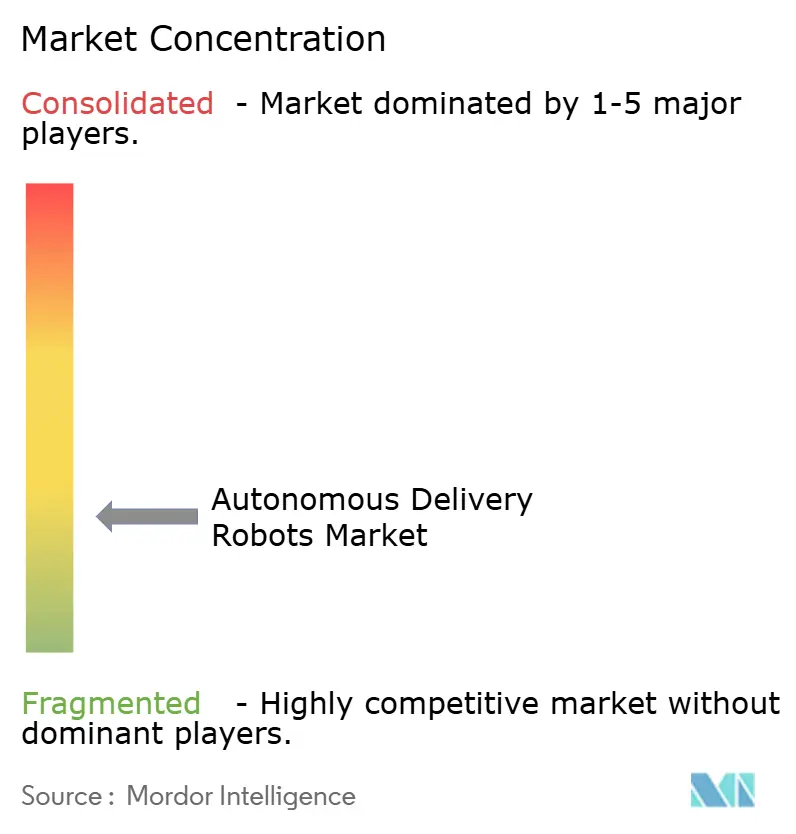
The autonomous delivery robots market remains fragmented, with top five vendors holding just under 25% of installed fleets. Venture-funded disrupters rely on rapid capital injections to finance production tooling and city launch costs. Serve Robotics raised USD 80 million in January 2025, lifting total funding above USD 247 million as it aims for breakeven on a 2,000-unit fleet. Starship Technologies secured USD 90 million in February 2024 to expand global operations and has logged 11 million robot miles to date.
Sensor strategy differentiates rivals. LiDAR-centric players tout millimeter-level mapping, while Cartken proves that computer-vision stacks without LiDAR can still achieve urban reliability at lower cost, having reached profitability with under USD 25 million raised. Automotive OEM entrants such as Toyota leverage deep manufacturing know-how to produce hospital-grade platforms and exploit existing service networks.
Partnerships with food aggregators or retailers often dictate deployment velocity. Uber Eats, Grubhub, Walmart, and Kroger each select hardware partners to secure exclusive city zones, creating de-facto geographic strongholds. In parallel, software-only firms license navigation stacks to white-label hardware made by contract manufacturers, signaling a move toward modular value chains.
Autonomous Delivery Robots Industry Leaders
-
Starship Technologies
-
Ottonomy.IO
-
Nuro Inc.
-
Serve Robotics Inc.
-
Kiwibot
- *Disclaimer: Major Players sorted in no particular order
Autonomous Delivery Robots Market Companies Covered in this Report
- Starship Technologies
- Nuro Inc.
- Kiwibot
- Serve Robotics Inc.
- Ottonomy.IO
- Relay Robotics Inc.
- Postmates Inc. (Serve by Uber)
- Aethon Inc.
- Segway Robotics Inc.
- Neolix
- Udelv Inc.
- JD Logistics (Jian Robots)
- Alibaba Cainiao (Xiaomanlv)
- Yandex Rover
- FedEx Roxo
- Amazon Scout
- Rival Robotics Inc.
- TeleRetail (Aitonomi AG)
- Daxbot
- Locus Robotics (campus variant)
- Kiwi Campus SAS
Market Opportunities and Future Outlook
Operators are shifting toward dense, repeatable missions where permitting, routing, and unit economics are easier to standardize, which creates room for grocery, convenience, and hot food delivery footprints beyond campus-centric deployments. Starship Technologies reported crossing 10 million deliveries in April 2026, with 3,000+ robots operating across 8 countries, indicating that scaled operational learning is being positioned for additional city launches and retailer or aggregator partnerships. In Washington, D.C., Coco Robotics initiated operations in the Logan Circle area in July 2026 with an initial fleet of about 25 robots, reflecting the move into urban neighborhoods where order density supports higher utilization.
At the state level, regulatory normalization is also expanding operating geographies, particularly in the United States where delivery-robot rules have been codified in many states and new bills continue to advance. Alongside sidewalk frameworks, suppliers that can bridge autonomy, connectivity, and fleet supervision stand to gain from procurement requirements that emphasize safety evidence, accessibility compliance, and remote-operations controls across jurisdictions. Demand is further emerging for orchestration software and integration into smart infrastructure, as customers increasingly manage robots as part of broader last-mile systems rather than standalone pilots, expanding needs around fleet management, compliance logging, and interoperability with lockers, store operations, and curbside workflows.
Recent Industry Developments in Autonomous Delivery Robots Market
- June 2026: Starship Technologies announced it would wind down U.S. university campus operations and redeploy more than 1,200 robots to focus on grocery and hot food delivery in the U.S. and Europe. The redeployment concentrates fleet assets on higher-density, revenue-generating routes and narrows the use-case focus as operators prioritize repeatable unit economics.
- January 2025: Serve Robotics secured USD 80 million in funding to expand its sidewalk delivery robot fleet toward 2,000 units by the end of 2025, supporting operations tied to partners such as Uber Eats and 7-Eleven. The capital raise reinforced a scale-up path where fleet size and geographic coverage become a competitive lever in city-level deployments.
- October 2024: Avride unveiled a next-generation four-wheel delivery robot design powered by NVIDIA Jetson Orin, featuring a detachable storage section and upgrades for maneuverability on inclines. The platform update aligned product roadmaps with tougher outdoor operating conditions and increased the addressable set of curb, crosswalk, and last-meter scenarios for sidewalk fleets.
Autonomous Delivery Robots Market Report Scope and Research Methodology
Market Definition and Coverage
This market covers autonomous, ground-based delivery robots that move goods without a human courier, typically for last mile and on-premise routes. Revenue is measured from these robotic delivery units and their directly attached software and support.
Scope exclusions: Aerial delivery drones and non-delivery mobile robots used only for internal material handling are excluded.
Segments Covered in This Report
- By Robot Type
- Indoor Service Robots
- Outdoor Autonomous Delivery Robots
- Hybrid All-Terrain Robots
- By Application
- Food Delivery
- Grocery and Convenience Deliveries
- Parcel and Courier (E-commerce)
- Healthcare Supply and Medication
- Hospitality Room-Service
- Industrial Campus Logistics
- By Load Capacity
- Up to 10 kg
- 10 - 25 kg
- 25 - 80 kg
- Above 80 kg
- By End-User Industry
- Healthcare Facilities
- Hospitality and Hotels
- Retail and E-commerce Logistics
- Corporates and Academic Campuses
- Airports and Transportation Hubs
- Smart Cities and Municipal Agencies
- By Component
- Hardware
- Software / AI Stack
- After-Sales Services and Fleet Management
- By Propulsion Type
- Electric Battery
- Hydrogen Fuel Cell
- Hybrid Energy Harvesting
- By Level of Autonomy
- Semi-Autonomous (Human-Supervised)
- Fully Autonomous (Level 4)
- Swarm/Clustered Autonomous Network (Level 5)
- By Geography
- North America
- United States
- Canada
- Mexico
- South America
- Brazil
- Argentina
- Chile
- Europe
- Germany
- United Kingdom
- France
- Italy
- Spain
- Middle East
- United Arab Emirates
- Saudi Arabia
- Turkey
- Africa
- South Africa
- Kenya
- Asia-Pacific
- China
- Australia
- Japan
- Singapore
- India
- South Korea
- North America
Data Sources, Market Sizing, and Validation
Desk Research
Desk research was used to build the fact base and keep assumptions tied to trackable signals. We referenced public guidance on transportation and sidewalk robot operations from city and state agencies, and safety and product standards from bodies such as ISO and IEC. For demand context, we reviewed e-commerce parcel trends and retail delivery activity from sources such as the US Census Bureau and the World Bank. Where available, customs and trade statistics were checked to directionally validate robot shipment timing.
To translate those signals into a usable market model, we then reviewed company filings, investor decks, press releases on deployments, and publicly available product specification sheets. This helped us identify typical unit pricing bands, payload ranges, and outdoor operating constraints used in the market. Where needed, paid subscriptions for company financials and intelligence, patent databases, and shipment-level import export data were used to cross-check timelines and technology focus, while keeping the sizing logic reproducible. The references listed above are illustrative, and we also consulted other public sources to clarify and complete the dataset.
Primary Interviews and Surveys
Primary interviews focused on separating pilot deployments from revenue generating rollouts, and on understanding how pricing and contracting change when fleets scale from single sites to multi-site operations. We spoke with manufacturers, fleet operators, last-mile service teams, and buyers in retail, logistics, hospitality, and healthcare across APAC, EMEA, and the Americas. Respondent input was used to confirm utilization assumptions and adoption pacing used in the forecast.
Distribution of primary research fieldwork respondents
| Company type | Respondent position | Region |
|---|---|---|
| Top tier: 31% | CXOs: 14% | APAC: 45% |
| Mid tier: 55% | Functional/Unit leaders: 38% | EMEA: 37% |
| Smaller Players: 14% | Managers: 48% | Americas: 18% |
Market-Sizing & Forecasting
Sizing started with a top-down build where delivery demand pools and deployment intensity were reconstructed using urban delivery activity, last-mile cost pressure, and the practical constraint of where sidewalk robots are permitted and can operate reliably. That view was then corroborated with selective bottom-up checks, including sampled fleet counts by use case, average selling price ranges by robot class, and channel conversations on typical order timing. These cross-checks were used to adjust the total when the first pass looked too optimistic.
Key inputs in the model included active fleet deployments versus pilot programs, average payload and duty-cycle patterns that drive how many robots are needed per route, and unit ASP movement as volumes scale. We also tracked battery and sensor cost direction, which influences pricing, and the pace of rulemaking for sidewalk operations in major cities. For smaller countries with thinner data, we used proxy indicators such as urban density, e-commerce penetration, and comparable regulation readiness. Interview feedback was then used to constrain the outputs.
For forecasting, scenario analysis was used so the base case reflected realistic ramp-up curves, and the faster case reflected quicker commercial rollouts. We also ran a slower case where permitting or sidewalk constraints delay scaling. Scenarios were guided by primary feedback on sales cycles, procurement triggers, and the typical time from pilot to expanded fleet rollouts.
Data Validation & Update Cycle
Outputs were checked against independent signals such as reported fleet expansions, public announcements of new service areas, and observed changes in unit price bands over time. When large variances appeared, we rechecked unit mix, geography weighting, and timing effects, then triggered follow-up calls to determine whether the shift was real or related to reporting differences.
Before sign-off, the work goes through multi-step internal review where assumptions, calculations, and year-to-year movements are stress-tested for consistency. Reports are refreshed annually, and interim updates are done when material events occur, such as a major regulatory shift or a step-change in deployment scale. Right before final delivery, an analyst performs a fresh scan to confirm that published numbers reflect the most recent developments.
Mordor Intelligence's Autonomous Delivery Robots Market Size Compared Against Other Published Estimates
Published market sizes for autonomous delivery robots often vary because the boundary of what counts as a delivery robot is not consistent, and some models assume faster scaling than what fleet operations typically allow. Differences can also come from whether sources combine hardware-only revenue with broader service revenue, plus variation in currency timing and inflation handling.
By tracking ground-only robot revenue and fleet deployments, Mordor Intelligence keeps the market total aligned to sidewalk and on-premise delivery use cases, which avoids overstating the market with aerial drone delivery and unrelated robotics categories.
Benchmark comparison
| Source | Market Size | Gaps in Research Methodology |
|---|---|---|
| Mordor Intelligence | USD 1.33 B (2026) | |
| Industry Research Publisher A | USD 2.80 B (2024) | This estimate appears to include aerial drones and other modes alongside ground robots, which expands the addressable revenue pool beyond sidewalk and campus delivery robots. The base year is earlier, and the scope looks broader across applications, which can push the headline number up. |
| Market Publisher B | USD 0.74 B (2024) | The scope reads closer to ground delivery robots, but the size can look lower if only hardware sales are counted and fleet software, support, or multi-year commercialization lags are treated conservatively. Differences can also come from how pilot deployments are filtered versus scaled rollouts. |
Taken together, the spread mainly comes from scope boundaries and what is treated as monetized deployment versus experimentation. When the model is anchored to observable fleet rollouts, pricing bands, and regulatory operability, the resulting market size becomes easier to trace back to clear, repeatable inputs.
Key Questions Answered in the Report
What is the current autonomous delivery robots market size?
The autonomous delivery robots market stands at USD 1.33 billion in 2026 and is projected to reach USD 3.27 billion by 2031 at a 19.74% CAGR.
Which segment holds the largest autonomous delivery robots market share?
Outdoor sidewalk robots led with 57.20% share in 2025, reflecting mature urban deployments.
How fast is the grocery segment growing within the autonomous delivery robots market?
Grocery and convenience deliveries are expanding at a 23.70% CAGR through 2031 as retailers seek faster, cost-efficient last-mile options.
Why are LiDAR costs viewed as a restraint for the autonomous delivery robots industry?
Traditional LiDAR units significantly raise robot price tags; although new ultrasonic and vision-based sensors can cut costs up to 80%, they still await wide regulatory acceptance.
Which regions are expected to adopt autonomous delivery robots most rapidly?
North America leads today due to labor shortages, while Asia-Pacific and Europe follow closely on the back of healthcare automation and zero-emission mandates, respectively.
What level of autonomy is most common in commercial fleets?
Semi-autonomous Level 3 robots with remote oversight account for 71% of active deployments, balancing operational readiness with current regulatory requirements.