
Autonomous Agents Market Size and Share
Market Overview
| Study Period | 2020 - 2031 |
|---|---|
| Market Size (2026) | USD 5.83 Billion |
| Market Size (2031) | USD 23.32 Billion |
| Growth Rate (2026 - 2031) | 31.95 % |
| Fastest Growing Market | Asia Pacific |
| Largest Market | North America |
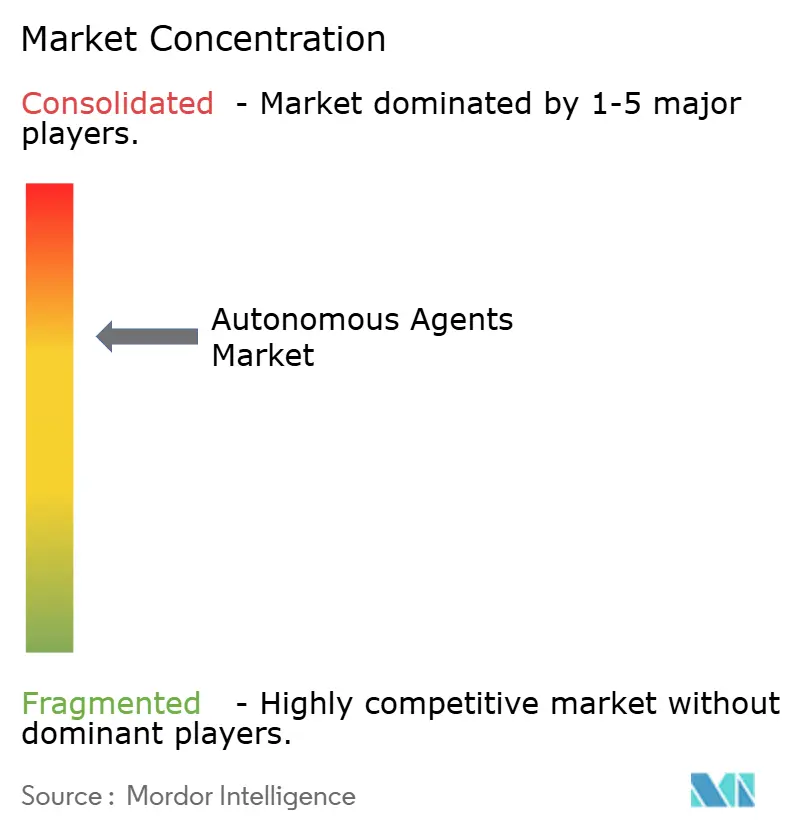
| Market Concentration | Medium |
Major Players *Disclaimer: Major Players sorted in no particular order Image © Mordor Intelligence. Reuse requires attribution under CC BY 4.0. | |
Autonomous Agents Market Analysis by Mordor Intelligence
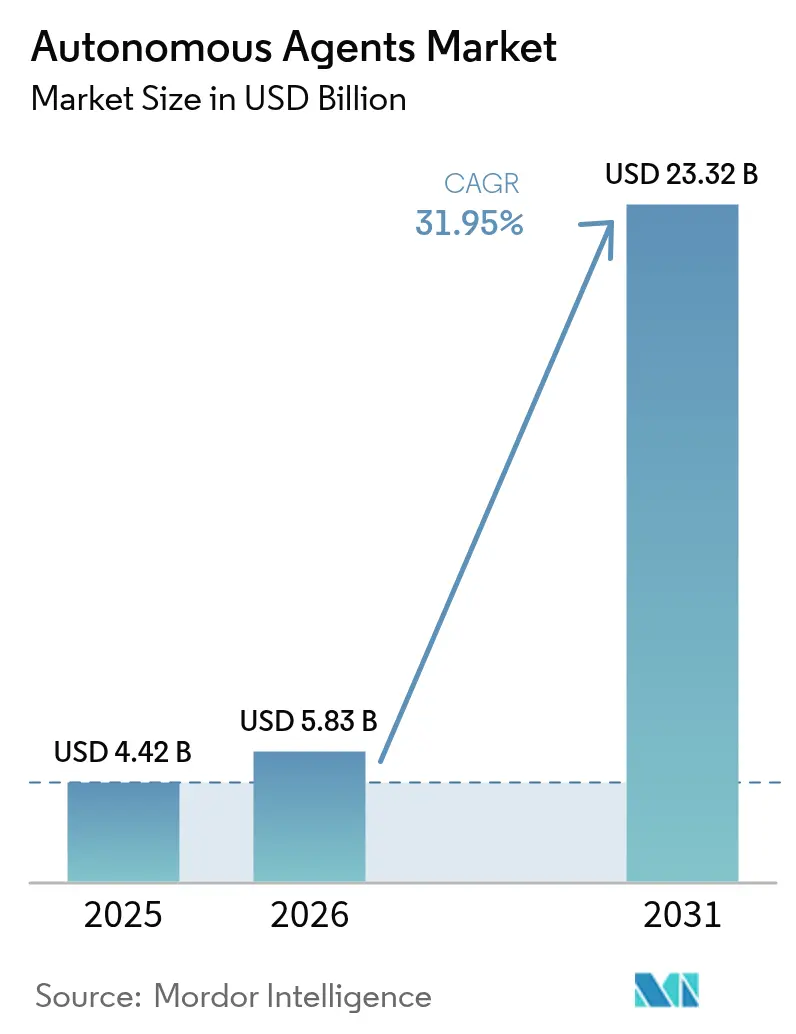
autonomous agents market size in 2026 is estimated at USD 5.83 billion, growing from 2025 value of USD 4.42 billion with 2031 projections showing USD 23.32 billion, growing at 31.95% CAGR over 2026-2031. Rapid enterprise digitalization, rising labor-cost pressures, and expanding AI capabilities are pushing autonomous agents beyond pilot projects into core business workflows. Companies are deploying software agents to streamline customer service, optimize networks, orchestrate complex workflows, and deliver analytics-driven decisions. Large language models linked with domain-specific data are widening the scope of tasks that agents can handle, while advances in cloud infrastructure reduce the compute barriers that once limited real-time agent execution. Regulatory clarity in key markets and increasing confidence in agent governance are further accelerating commercial rollout.
Key Report Takeaways
- By component, Solutions led with 67.20% revenue share in 2025 while Services is projected to advance at a 33.92% CAGR through 2031, reflecting rising demand for integration, training, and managed-service expertise.
- By deployment model, Cloud captured 81.10% of the autonomous agents market share in 2025; it is forecast to post the fastest 34.02% CAGR to 2031 as enterprises scale compute-intensive large-language-model workloads.
- By autonomy level, Reactive agents remain the largest installed base, yet Cognitive agents are the quickest climbers, improving decision accuracy by 35% and driving the highest growth rate through 2031.
- By organization size, Large enterprises accounted for 69.10% of market revenue in 2025, whereas SMEs are set to expand at a 32.76% CAGR thanks to no-code platforms and AI-as-a-Service pricing that lower entry barriers.
- By industry vertical, IT and Telecom held 29.40% of the autonomous agents market size in 2025; Healthcare and Life Sciences is projected to surge at a 36.25% CAGR between 2026-2031 as providers automate clinical and administrative workflows.
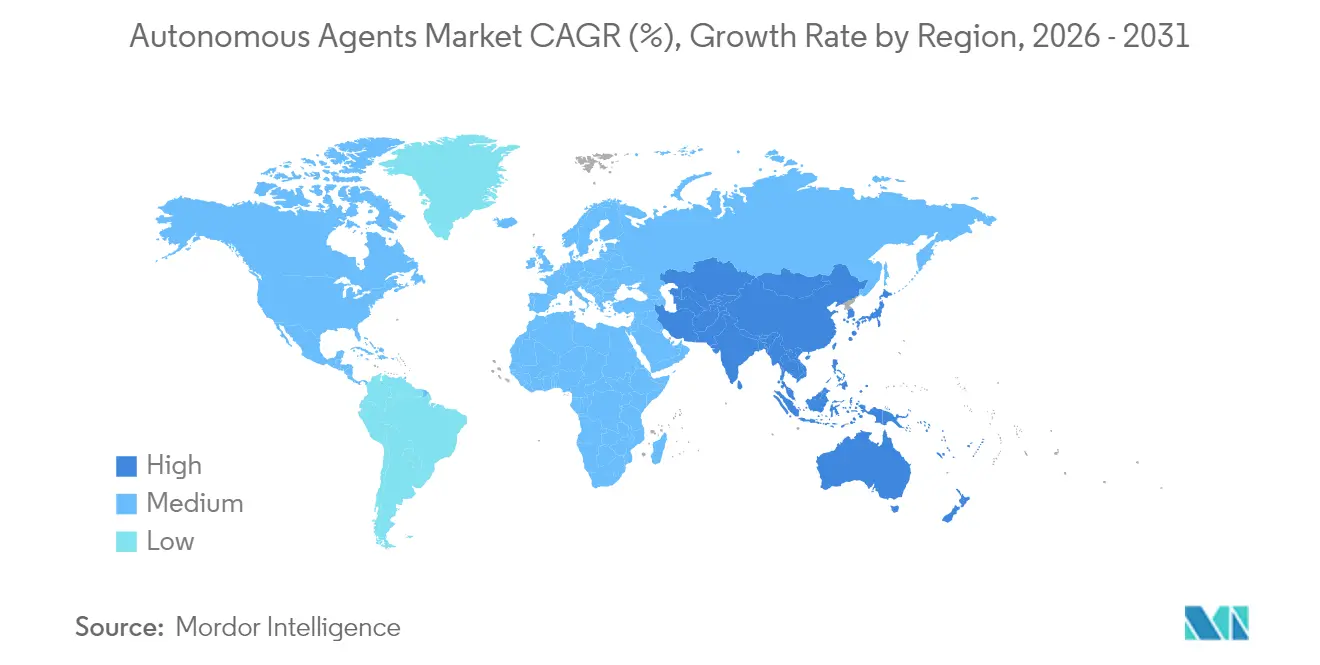
- By geography, North America led with a 40.30% revenue share in 2025, while Asia Pacific is poised to grow at a 35.10% CAGR through 2031 on the back of aggressive smart-factory and 5G edge-agent deployments
Note: Market size and forecast figures in this report are generated using Mordor Intelligence’s proprietary estimation framework, updated with the latest available data and insights as of 2026.
Market Trends and Insights
Drivers Impact Analysis of Autonomous Agents Market*
| Driver | ( ~ ) % Impact on CAGR Forecast | Geographic Relevance | Impact Timeline |
|---|---|---|---|
| Hyper-personalised customer engagement in BFSI | +7.40% | Global, led by North America and Europe | Medium term (2-4 years) |
| European automotive shift to software-defined vehicles | +5.80% | Europe, spillover to North America | Medium term (2-4 years) |
| Multi-agent RL for smart-factory optimisation | +6.20% | Asia Pacific, chiefly China, Japan, South Korea | Short term (≤ 2 years) |
| Regulatory mandates for explainable AI in US federal agencies | +4.50% | North America | Long term (≥ 4 years) |
| Rapid scaling of edge‑deployed agents in 5G private networks | +2.1% | Global | Medium term (2–4 years) |
| Source: Mordor Intelligence | |||
Hyper-personalised Customer Engagement Needs in BFSI Driving Agent Adoption
Banks are rolling out autonomous agents to deliver real-time, personalised recommendations across digital channels, with 78% of global institutions scheduling deployments by 2026. JPMorgan’s COIN platform now reviews 12,000 complex contracts a year, saving 360,000 human hours and raising accuracy by 30%. Integration with core banking systems lets agents make instant lending and fraud-monitoring decisions, turning reactive service into proactive engagement. Return on investment is strengthened by service-delivery savings of 25–30% and customer-satisfaction gains of 15–20%. Regulatory frameworks in the United States and the European Union are maturing, allowing agents to handle sensitive transactions with clear audit trails. These factors together are adding a 7.4% lift to the autonomous agents market CAGR.
European Automotive OEM Shift to In-Vehicle Software-Defined Architectures
Manufacturers are redesigning vehicles around software platforms that embed agents throughout the driving experience. Mercedes-Benz is integrating agents within MB.OS to adapt to driver habits and road conditions, boosting predictive-maintenance capability and cutting downtime by 20%.[1] The movement from hardware to software differentiation is opening space for secure, scalable agent ecosystems that comply with Europe’s strict privacy rules. Increased software R&D, now growing more than 35% each year among leading OEMs, underlies the 5.8% CAGR impact.
Surge in Multi-agent RL for Smart-Factory Optimisation in North Asia
Factories in Japan, South Korea, and China are adopting collaborative reinforcement-learning agents that drive 15–25% productivity gains over traditional automation. Samsung’s semiconductor lines achieved a 35% defect reduction and 12% throughput gain after multi-agent rollouts. Government incentives and acute labor shortages make deployment quick, placing the impact in the short-term window and adding 6.2% to market growth.
Regulatory Mandates for Explainable AI in U.S. Federal Agencies
The National Institute of Standards and Technology AI Risk Management Framework obliges federal systems to provide clear audit trails. The Department of Defense has budgeted USD 1.2 billion for explainable AI in 2025, fuelling demand for agents that can translate reasoning into human-readable form. Vendor investments in explainability layers are building competitive edges and adding 4.5% to the growth outlook over the long term.
Restraints Impact Analysis of Autonomous Agents Market*
| Restraint | ( ~ ) % Impact on CAGR Forecast | Geographic Relevance | Impact Timeline |
|---|---|---|---|
| Lack of interoperability standards | -3.20% | Global | Medium term (2-4 years) |
| High Training-data Sovereignty Barriers in EU Healthcare | -2.06% | Global, acute in Europe | Long term (≥ 4 years) |
| Energy-Efficiency Limits on On-device Inference for Mobile Agents | -1.83% | Global, acute in Asia Pacific and North America | Medium term (2–4 years) |
| Talent scarcity in multi-agent safety and alignment engineering | -3.90% | Global, acute in North America and Europe | Short term (≤ 2 years) |
| Source: Mordor Intelligence | |||
Lack of Interoperability Standards Across Heterogeneous Agent Platforms
Enterprises report cross-platform integration delays averaging 8.3 months, limiting multi-agent collaboration benefits. Only 23% of deployments manage to connect agents from more than one vendor, forcing lock-in or expensive custom work. Vendors pursuing common protocols, such as Google’s Agent2Agent, have yet to reach critical mass, restraining near-term adoption by 3.2%.
Talent Scarcity in Multi-Agent Safety and Alignment Engineering
Seventy-one percent of organizations cite skills gaps as the top barrier to autonomous agent projects. Advanced safety testing, reinforcement-learning oversight, and alignment tuning demand scarce expertise, delaying rollouts and trimming CAGR by 3.9%. Specialized training programs are expanding, yet the pipeline will take time to meet demand.
*Our forecasts treat driver/restraint impacts as directional, not additive. The impact forecasts reflect baseline growth, mix effects, and variable interactions.
Autonomous Agents Market Segment Analysis
By Component:
Solutions Dominate While Services AccelerateSolutions captured 67.20% of the autonomous agents market in 2025, showing enterprise preference for ready-made platforms that integrate security, governance, and workflow orchestration. IBM watsonx Orchestrate links to more than 80 business applications and lists over 150 pre-built agents in its catalog. The segment benefits from quick implementation and unified management consoles, making it the cornerstone of large-scale deployments. Services, however, are expanding quickly as firms seek consulting for complex rollouts. A 33.92% CAGR through 2031 indicates that integration, training, and managed-services partners are central to unlocking solution value.Growing adoption complexity is lifting demand for expert guidance.
Regulated sectors such as finance and healthcare need advisory services to meet compliance, and managed-services providers are stepping in to operate agents for customers lacking in-house talent. The autonomous agents market size allocated to services is predicted to multiply as enterprises migrate pilot projects into production and request ongoing optimization.


By Deployment Type:
Cloud Dominance AcceleratesCloud deployments owned 81.10% share in 2025, reflecting preference for elastic compute that supports large language models. Microsoft Azure AI Foundry gives users access to more than 1,900 AI models and auto-scales resources to match workload demand.The cloud’s 34.02% forecast CAGR confirms its role as the default environment, helped by growing confidence in virtual-private-cloud security controls. The autonomous agents market size attributed to cloud workloads is expected to widen further as model-size growth outpaces on-premises capacity.
On-premises systems remain important for defense, government, and financial services that demand control over sensitive data. Hybrid approaches are bridging the gap, routing inference to local infrastructure while training runs in the cloud. Edge computing is emerging as a complementary method where agents run latency-sensitive tasks near devices, blending security with scale.
By Autonomy Level:
Cognitive Agents Drive InnovationReactive agents still form the largest installed base because rules-based logic is predictable and simple to audit. They handle high-volume tasks such as basic chat support. Deliberative agents, which plan against internal world models, are spreading in sectors that need goal-based reasoning, including insurance underwriting and clinical triage. Cognitive agents are the breakout category. They combine large language models, reinforcement learning, and knowledge graphs to adapt to novel contexts. IBM testing shows cognitive agents reduce decision time by 70% and improve accuracy by 35% compared with scripted automation.
Hybrid agents blend reactive speed with deliberative planning. They suit mission-critical operations where reliability is essential. As specialization deepens, purpose-built cognitive agents for finance, retail, and logistics will expand the autonomous agents market beyond horizontal use cases.
By Organization Size:
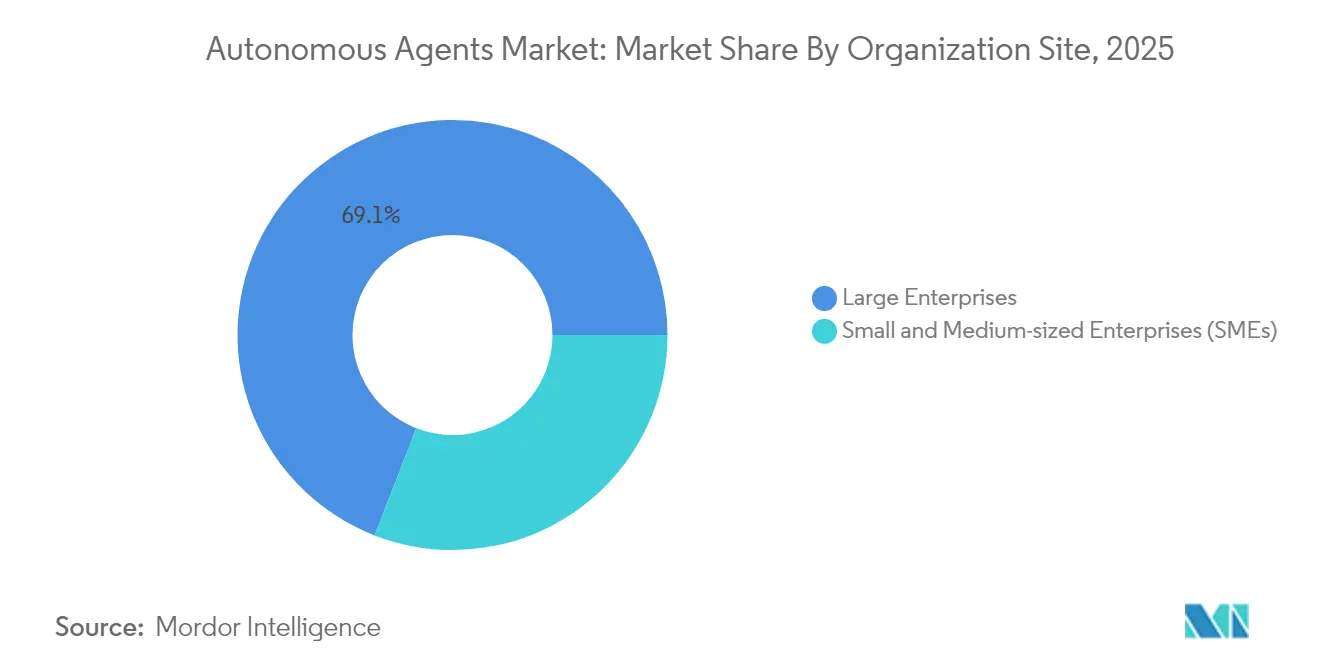
Large Enterprises Lead, SMEs AccelerateLarge enterprises contributed 69.10% of 2025 revenue, aided by ample budgets and robust digital infrastructure. Over 100,000 companies now create or refine agents in Microsoft Copilot Studio, many with complex multi-agent ecosystems. Deep integration into ERP, CRM, and supply-chain tools delivers measurable savings and data-driven insights. Small and medium-sized enterprises are closing the gap. A projected 32.76% CAGR shows that no-code platforms and AI-as-a-Service models are lowering entry barriers.
SME adoption focuses on immediate wins such as lead qualification, invoice matching, and HR onboarding. Pay-as-you-go pricing reduces risk, while marketplaces provide vertical templates that shorten deployment cycles. The result is broadening participation that diversifies the autonomous agents industry customer base.
By Industry Vertical:
IT and Telecom Leads, Healthcare AcceleratesIT and Telecom held 29.40% of total revenue in 2025, reinforcing its status as the proving ground for AI agents. Telecom operators report 40–60% reductions in mean-time-to-repair after adopting autonomous network-monitoring agents. IT service teams now rely on agents that self-heal infrastructure and triage tickets, freeing staff for higher-value work. Healthcare and Life Sciences is the fastest mover. A 36.25% CAGR through 2031 reflects mounting pressure to control costs and improve patient outcomes. Wipro introduced specialized healthcare agents that automate provider onboarding and insurance verification.Clinical decision-support agents integrate with electronic health records, enabling personalized treatment plans.
Pharmaceutical researchers employ agents to scan literature and design experiments. Privacy regulations remain strict, yet federated learning and synthetic data techniques are opening adoption pathways
Geography Analysis
North America Autonomous Agents Market
North America generated 40.30% of the autonomous agents market in 2025 thanks to heavy R&D investment and early corporate adoption. United States enterprises plan to spend more than USD 300 billion on AI research in 2025, with a sizeable portion aligned to agent technologies. Financial institutions and hospitals lead deployments, boosted by supportive federal frameworks that balance innovation with responsible AI. Concentrated venture funding and deep talent pools add further momentum.
Europe, APAC and GCC Autonomous Agents Market
Asia Pacific is the fastest-growing region, forecast to record a 35.10% CAGR between 2026 and 2031. China’s national AI strategy directs significant subsidies toward autonomous manufacturing agents, while Japan and South Korea back smart-factory pilots to address labor shortages. The Gulf region is attracting bespoke agent solutions, and joint ventures such as CNTXT AI and Beam AI estimate a regional market value of USD 4.2–5.4 billion in 2025. Scalable cloud infrastructure and 5G rollouts make the region conducive to edge-deployed agents, expanding scope in logistics and retail. Europe combines strong ethics oversight with practical deployment in automotive, finance, and industrial settings. The EU AI Act requires transparency and risk management, guiding product design toward trustworthy outcomes. Software-defined architectures in vehicles place Europe at the forefront of in-car agents. The regional AI market could hit USD 235.5 billion by 2031 at a 26.3% CAGR, illustrating robust potential. Data sovereignty rules in healthcare slow adoption but also catalyze advances in privacy-preserving AI that may turn into exportable strengths.
Regulatory Landscape
Autonomous agents are increasingly shaped by AI-wide risk and transparency regimes rather than agent-specific statutes, with near-term compliance focused on documentation, auditability, and secure operation of agent actions across connected systems. In the United States, the National Institute of Standards and Technology (NIST) launched the AI Agent Standards Initiative in February 2026 to advance voluntary technical standards and open protocols for secure, interoperable agents, reinforcing a standards-led approach referenced in 15 USC 278h-1 on AI standards.
Policy activity in 2026 also points to tighter attention on platform-agent interaction rules. In June 2026, Senator Mark Warner released the AI AGENT Act discussion draft, proposing requirements around interoperable access for third-party AI agents on large online platforms and an FTC-administered registration concept for agent providers. In the European Union, the EU AI Act (Regulation (EU) 2024/1689) establishes the umbrella risk-tiering framework for AI systems that agents fall under based on use-case risk, while the European Commission issued guidelines on transparency obligations in July 2026, ahead of the Article 50 transparency obligations becoming applicable in August 2026.
Value Chain Analysis
The autonomous agents value chain begins with foundational compute and model assets (hyperscale cloud infrastructure, model providers, and tooling for training and inference), then extends into agent frameworks and orchestration layers that connect models to tools, workflows, and enterprise systems. This middle layer typically includes identity, policy, and governance controls, along with interoperability and protocol work that allows agents to interact across heterogeneous ecosystems. Solution vendors package these elements into platforms, catalogs, and vertical agents, while systems integrators and managed service providers implement, secure, and operate agents in production across functions such as customer operations, network operations, and supply chain.
Downstream, enterprise deployment depends on data readiness and system connectivity, including connectors to ERP/CRM/OSS-BSS, knowledge bases, and digital twin environments used for planning, simulation, and safe action execution. Bottlenecks often arise when agents are integrated across multiple vendors, particularly around orchestrator-to-tool and agent-to-agent coordination, as well as when governance-by-design needs to be embedded through drift detection, rollback and safe recovery, and audit logging. Consulting and integration partners also influence deployment timelines as enterprises move from task automation to outcome-based delegation, especially in regulated verticals where auditability and data controls constrain architecture choices.
Competitive Landscape
The autonomous agents market is moderately concentrated around four large cloud and AI providers. Microsoft integrates Copilot across Azure, Dynamics 365, and M365, embedding agents into productivity suites and developer tools. Google pushes interoperability through its Agent2Agent protocol that aims to connect heterogeneous agent ecosystems. IBM emphasizes workflow orchestration with watsonx Orchestrate and holds 1,591 AI-related patents secured in 2024, many improving human-agent collaboration. AWS leverages its extensive cloud services catalog to give customers pre-built agents for common operational needs.
Specialists are carving out vertical niches. Salesforce’s Agentforce focuses on customer-centric automation, Oracle’s AI Agent Studio augments back-office processes, and ServiceNow deploys telecom-specific agents for network operations. Start-ups such as Fetch.ai in decentralized networks and Affectiva in emotion inference showcase innovation diversity. Partnerships and marketplaces are becoming decisive, with Siemens planning an industrial AI agent marketplace on the Xcelerator platform and Manhattan Associates launching Agent Foundry to let retailers build custom logistics agents.
Competitive intensity is rising as vendors race to set de facto standards. Security, explainability, and governance features are primary differentiators because they unlock enterprise trust. Vendors that supply both horizontal agent frameworks and specialist domain agents are best positioned to capture incremental spend as customers scale deployments.
Autonomous Agents Industry Leaders
-
IBM Corporation
-
Oracle Corporation
-
SAP SE
-
Amazon Web Services, Inc.
-
SAS Institute Inc.
- *Disclaimer: Major Players sorted in no particular order
Autonomous Agents Market Companies Covered in this Report
- IBM Corporation
- Google LLC
- Microsoft Corporation
- Amazon Web Services Inc.
- Oracle Corporation
- SAP SE
- Salesforce Inc.
- SAS Institute Inc.
- Intel Corporation
- Aptiv PLC
- Nuance Communications
- Infosys Limited
- Fair Isaac Corporation (FICO)
- Fetch.ai Ltd.
- Affectiva Inc.
- Baidu Inc.
- Huawei Technologies Co. Ltd.
- Bosch Global Software Technologies
- SAPEON Inc.
- DataRobot Inc.
Market Opportunities and Future Outlook
A major opportunity is reducing ecosystem fragmentation through practical interoperability and governance standards that make multi-vendor agent deployments operationally workable. The NIST AI Agent Standards Initiative (February 2026) and industry protocol work such as Open Standard Agents (OSSA), including its Agent Contract Standard v0.5.0 release in April 2026, show active efforts to define identity, skills, and contract layers that improve portability across platforms. Enterprises dealing with long cross-platform integration cycles and limited multi-vendor connectivity create room for platforms, integrators, and security vendors that deliver standardized orchestration, testing, and policy controls.
Security and auditability tooling around agent actions is another near-term opportunity as agents start executing cross-application tasks at scale. The EU AI Act transparency obligations coming into effect in August 2026, supported by July 2026 European Commission guidance, increase the need for traceable action logs, clear disclosures, and inventories of data flows and connected systems, particularly for agents handling sensitive workflows. Separately, demand for production readiness is visible in TMT organizations shifting in 2026 toward orchestration and operationalization at scale, which supports managed services, AgentOps tooling, and sector-specific templates aimed at shortening time-to-production while keeping human-in-the-loop governance.
Recent Industry Developments in Autonomous Agents Market
- July 2026: AWS and Aily Labs announced a strategic partnership to deploy Aily AI Decision Intelligence agents through AWS Marketplace and Amazon Bedrock. The move expands enterprise access to packaged agent capabilities and ties agent deployment to a scalable cloud procurement and distribution channel.
- May 2026: AWS announced general availability of the AWS for SAP MCP Server on Amazon Bedrock AgentCore, enabling AI agents to connect securely to SAP ERP environments. This strengthens the agent-to-enterprise-system integration layer and reduces friction for SAP-centric agent use cases that require controlled tool access.
- May 2025: IBM and Oracle expanded their partnership to advance agentic AI and hybrid cloud, aligning IBM watsonx and IBM Consulting capabilities with Oracle Cloud Infrastructure. The collaboration reflects growing enterprise demand for agent deployments that span application suites and cloud environments, with integration and governance delivered through joint go-to-market execution.
Autonomous Agents Market Report Scope and Research Methodology
Market Definition and Coverage
For this methodology, the autonomous agents market covers revenue earned from software-based agents that can perceive context, decide actions, and execute tasks with limited human input across enterprise and consumer workflows.
Scope exclusions: We exclude general AI infrastructure and chips, and we also exclude non-autonomous automation tools that do not make decisions or take actions independently.
Segments Covered in This Report
- By Component
- Solution
- - Platforms
- - Frameworks and Toolkits
- Services
- - Professional Services
- - Managed Services
- By Deployment Type
- Cloud
- On-Premises
- By Autonomy Level
- Reactive Agents
- Deliberative Agents
- Hybrid Agents
- Cognitive Agents
- By Organization Size
- Small and Medium-sized Enterprises (SMEs)
- Large Enterprises
- By Industry Vertical
- BFSI
- IT and Telecom
- Healthcare and Life Sciences
- Manufacturing
- Transportation and Mobility
- Retail and E-commerce
- Energy and Utilities
- Others
- By Geography
- North America
- United States
- Canada
- South America
- Brazil
- Rest of South America
- Europe
- Germany
- United Kingdom
- France
- Nordics
- Rest of Europe
- Middle East
- GCC
- Turkey
- Rest of Middle East
- Africa
- South Africa
- Rest of Africa
- Asia Pacific
- China
- Japan
- South Korea
- India
- Rest of Asia
- North America
Data Sources, Market Sizing, and Validation
Desk Research
Desk research was used to build the basic fact base on AI adoption, cloud spending patterns, and enterprise software procurement behavior that influences agent deployments. We reviewed public sources such as OECD AI policy and measurement work, NIST AI risk management guidance, US Bureau of Labor Statistics occupational data, and USITC trade publications where relevant to automation intensity.
To anchor the industry shape and company-side signals, we also relied on sources such as SEC filings, earnings call transcripts, product documentation, reputable technology press, and developer ecosystem updates. For targeted cross-checks, we selectively used paid subscriptions for company financials and intelligence, news and financials, and patent databases to map activity levels and confirm timing of product expansion. The specific desk sources listed here are illustrative, and many other public and paid references were used for data collection, validation, and clarification.
Primary Interviews and Surveys
Primary work focused on validating what is actually being purchased and deployed, and what gets counted as agent revenue versus adjacent AI software. We spoke with a mix of solution teams, IT buyers, implementation partners, and domain specialists, covering demand patterns in the Americas, EMEA, and APAC so assumptions were stress-tested across different maturity levels.
Distribution of primary research fieldwork respondents
| Company type | Respondent position | Region |
|---|---|---|
| Top tier: 33% | CXOs: 15% | APAC: 48% |
| Mid tier: 51% | Functional/Unit leaders: 38% | EMEA: 29% |
| Smaller Players: 16% | Managers: 47% | Americas: 23% |
Market-Sizing & Forecasting
Our sizing starts with a top-down demand-pool build where enterprise software and AI spending signals are reconstructed into likely agent adoption, and then filtered by deployment readiness and use-case intensity. To keep totals realistic, the output is corroborated with selective bottom-up checks like sampled vendor revenue disclosures, channel conversations on deal sizes, and a volume-by-ASP sanity check for common agent deployments.
Key inputs include cloud migration pace, enterprise AI budget allocation, the share of workflows being automated, typical per-seat or per-task pricing behavior, and the rollout speed of orchestration and governance practices that enable production use. Where bottom-up visibility is incomplete for smaller suppliers, gaps are handled through penetration assumptions tied to buyer interviews and normalized pricing bands.
For forecasting, we used scenario analysis supported by near-term signals from interviews, followed by a multivariate regression overlay to keep growth aligned with macro IT spend, cloud expansion, and AI software adoption. Assumptions were revisited until short-term growth and long-term saturation were consistent with procurement cycles and implementation lead times.
Data Validation & Update Cycle
Model outputs are checked against independent signals such as enterprise AI spend direction, hiring trends for automation roles, and release cadence patterns that indicate how quickly agent capabilities are maturing. Variances are investigated in multiple review steps, and we re-contact respondents when a key assumption shifts or when an outlier appears in pricing, adoption, or growth.
The report is refreshed annually, and interim updates are made when material events occur that can alter demand or pricing. Before delivery, an analyst completes a fresh pass across inputs and assumptions so clients receive the most current view available at that time.
Mordor Intelligence's Autonomous Agents Market Size Compared With Other Published Estimates
Published market sizes for autonomous agents often do not match because each publisher draws the market boundary differently and then applies different pricing and adoption assumptions. Differences also come from how fast the forecast is allowed to ramp, and whether the estimate is tied to paid deployments or includes wider AI tooling that looks similar on the surface.
By tracking deployment-based revenue signals and refreshing scope rules annually, Mordor Intelligence keeps the total tied to agent functionality that takes actions, rather than broad AI software that only assists users.
Benchmark comparison
| Source | Market Size | Gaps in Research Methodology |
|---|---|---|
| Mordor Intelligence | USD 4.42 B (2025) | |
| Industry Research Publisher A | USD 8.00 B (2025) | This figure appears to use a wider definition that bundles agent platforms, adjacent AI assistants, and enabling tools, which expands the counted revenue pool in the same year. |
| Tech Market Tracker B | USD 7.84 B (2025) | The estimate looks closer to a revenue run-rate view that can include early pilots and mixed monetization, and it may apply less filtering on what qualifies as an autonomous agent deployment. |
The spread across sources mainly reflects where the line is drawn between autonomous agents and nearby AI software, plus how pricing and ramp-up speed are treated in the early years. Using explicit inclusion rules, repeatable demand indicators, and cross-checks from interviews, the final number stays easier to reconcile with real procurement behavior.
Key Questions Answered in the Report
What is the current size of the autonomous agents market?
The autonomous agents market was valued at USD 5.83 billion in 2026 and is set to grow rapidly through 2031.
Which component segment dominates revenue?
Solution platforms held 67.20% market share in 2025, reflecting demand for turnkey agent frameworks.
Why is healthcare the fastest-growing vertical?
Healthcare agents cut administrative burdens and aid clinical decisions, driving a 36.25% CAGR outlook under stringent cost-control pressures.
How important is cloud deployment for autonomous agents?
Cloud accounts for 81.10% of deployments thanks to its elastic compute capacity and expansive AI model libraries.
What are the biggest hurdles to adoption?
Talent shortages in safety engineering and the absence of interoperability standards delay projects and add integration costs.
Which region will grow fastest by 2031?
Asia Pacific is forecast to expand at a 35.10% CAGR due to strong government backing, smart-factory initiatives, and 5G edge infrastructure.