
Automotive Wheel Market Size and Share
Market Overview
| Study Period | 2019 - 2031 |
|---|---|
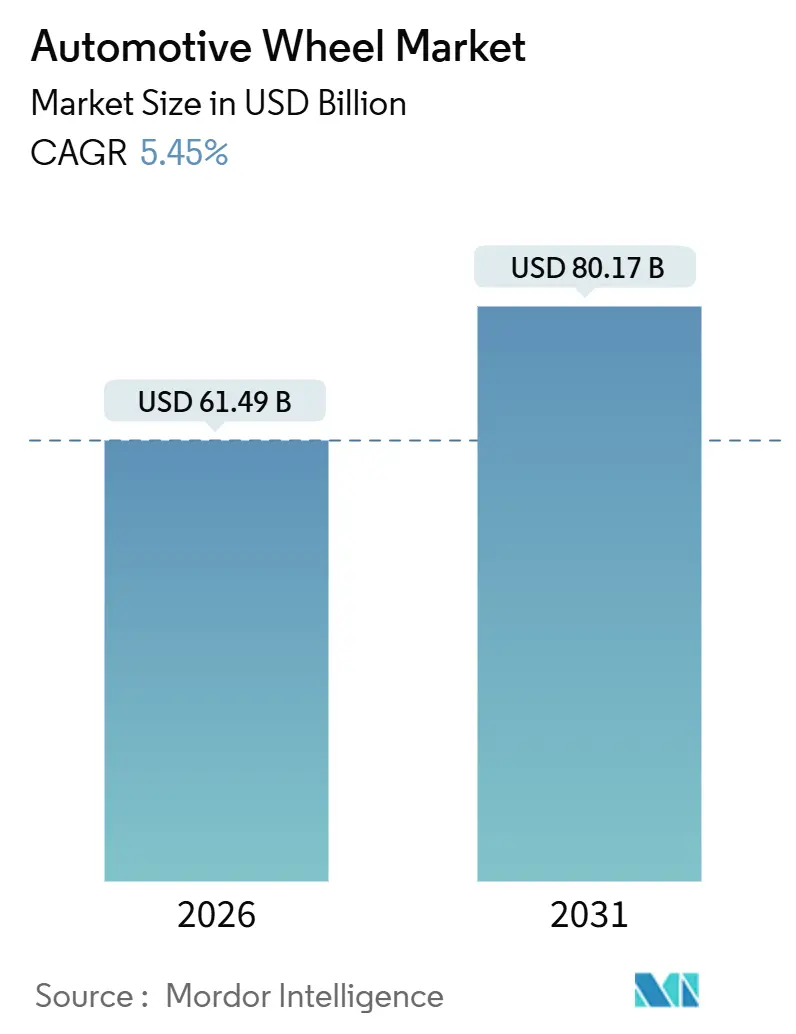
| Market Size (2026) | USD 61.49 Billion |
| Market Size (2031) | USD 80.17 Billion |
| Growth Rate (2026 - 2031) | 5.45 % |
| Fastest Growing Market | Asia Pacific |
| Largest Market | Asia Pacific |
| Market Concentration | Medium |
Major Players *Disclaimer: Major Players sorted in no particular order Image © Mordor Intelligence. Reuse requires attribution under CC BY 4.0. | |
Automotive Wheel Market Analysis by Mordor Intelligence
The automotive wheel market size was USD 61.49 billion in 2026 and is projected to reach USD 80.17 billion by 2031, growing at a 5.45% CAGR. Fuel-economy mandates and the roll-out of battery-electric vehicles (BEVs) are steering suppliers toward lighter materials, larger diameters, and greater process automation. Passenger cars dominate the volume, yet BEVs are recording double-digit growth, which accelerates demand for forged-aluminum and carbon-fiber rims. The Asia-Pacific region holds the largest regional share and benefits from cost-efficient, low-pressure casting capabilities. At the same time, Europe pivots to flow-formed alloy wheels to meet tightening CO₂ and particulate-abrasion limits.
Key Report Takeaways
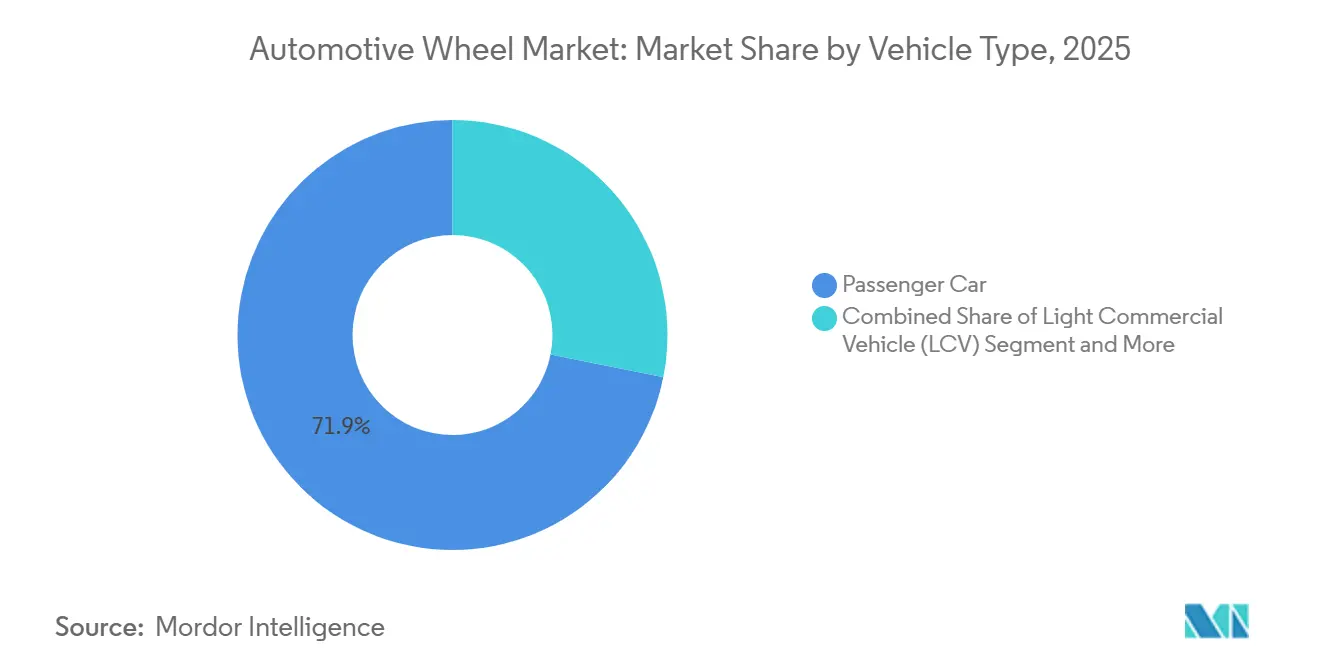
- By vehicle type, passenger cars held 71.87% of the automotive wheel market share in 2025 and are projected to post a 5.96% CAGR to 2031.
- By material, aluminum alloy accounted for 64.99% of the automotive wheel market size in 2025; carbon fiber is set to post an 11.56% CAGR to 2031.
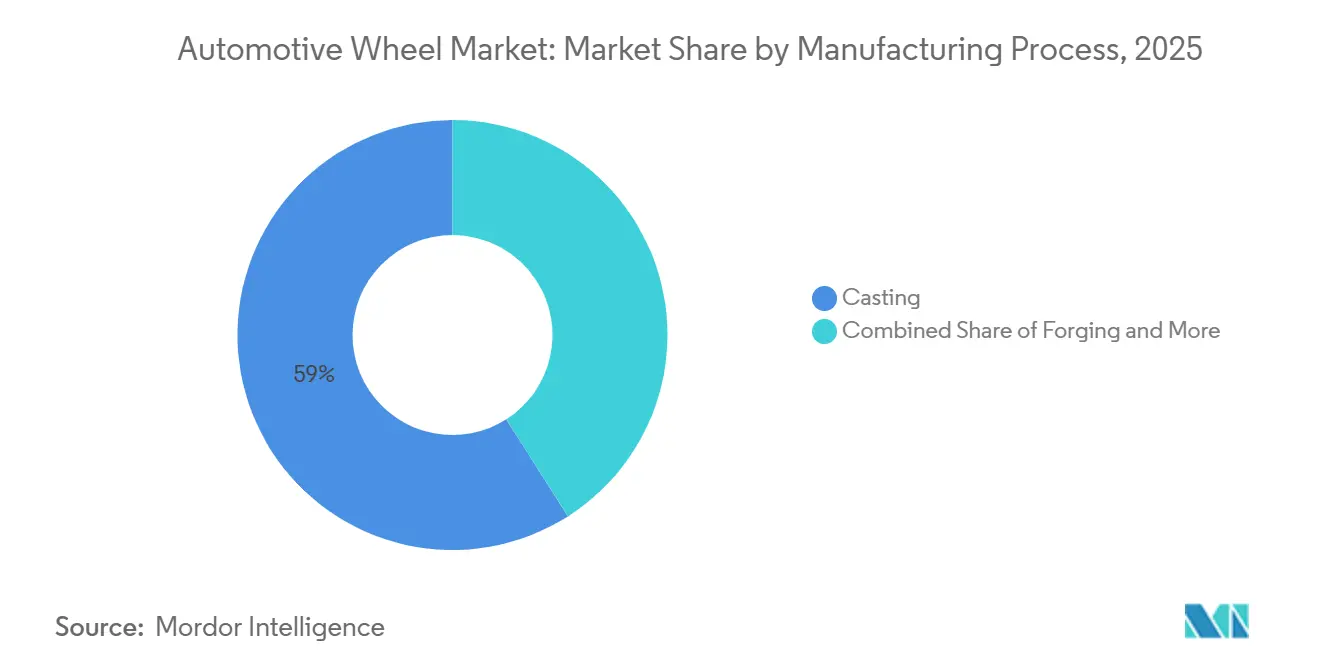
- By manufacturing process, casting retained 59.02% share of the automotive wheel market share in 2025, whereas flow-forming is projected to grow at 8.75% CAGR through 2031.
- By rim size, the 16–18 inch bracket captured 47.28% of the automotive wheel market share in 2025, while rims over 21 inches are set to advance at 7.75% CAGR.
- By coating, powder-coated wheels led with 44.44% of the automotive wheel market share in 2025; diamond-cut finishes are set to expand at a 7.37% CAGR to 2031.
- By propulsion, the internal combustion engines (ICEs) captured 76.33% of the overall market share in 2025, while BEVs posted a 13.93% CAGR through 2031.
- By sales channel, the OEM segment represented 79.57% of the automotive wheel market size in 2025; the performance aftermarket is projected to grow at a 6.83% CAGR through 2031.
- By geography, Asia-Pacific remains the production stronghold with a 40.59% share and is projected to witness the steepest 5.76% CAGR to 2031.
Note: Market size and forecast figures in this report are generated using Mordor Intelligence’s proprietary estimation framework, updated with the latest available data and insights as of January 2026.
Global Automotive Wheel Market Trends and Insights
Drivers Impact Analysis*
| Driver | (~)% Impact on CAGR Forecast | Geographic Relevance | Impact Timeline |
|---|---|---|---|
| EV Lightweighting Needs | +1.8% | Asia-Pacific core, spill-over to Europe and North America | Medium term (2-4 years) |
| EU CO₂ Compliance | +1.2% | Europe, with regulatory influence extending to UK and Turkey | Short term (≤ 2 years) |
| Custom-Wheel Aftermarket Boom | +0.9% | North America, concentrated in United States | Medium term (2-4 years) |
| Cost-Efficient Low-Pressure Casting | +0.7% | Global, led by China exports to APAC, MEA, and South America | Long term (≥ 4 years) |
| Autoclave-Free Resin Transfer | +0.5% | Global, early adoption in Europe and North America premium segments | Long term (≥ 4 years) |
| Advanced Wheel Sensor Integration | +0.3% | Global, with early gains in Europe and North America | Medium term (2-4 years) |
| Source: Mordor Intelligence | |||
EV Lightweighting Needs Accelerating Forged-Aluminum and Carbon-Fiber Rim Adoption in Asia-Pacific
Battery-electric platforms prompt OEMs to reduce unsprung mass to enhance efficiency, range, and ride quality. Chinese and Japanese producers have therefore scaled forged-aluminum lines and invested in carbon-fiber rim technology, which delivers significant weight savings compared to steel. Regional OEM supply contracts covering multi-year model cycles shield suppliers from commodity volatility and anchor capacity utilization. Flow-formed aluminum wheels, validated in urban drive-cycle studies, demonstrated significantly lower energy consumption, thereby bolstering the business case. Academic collaborations have shown that magnesium wheels now meet ISO impact standards, suggesting a pipeline of further weight-reduction options. Asia-Pacific’s growth rate underscores how material science aligns with regional BEV demand.
EU CO₂ Compliance Forcing OEM Shift from Steel to Flow-Formed Alloy Wheels
Europe’s fleet-average CO₂ ceiling of 93.6 g/km from 2025 to 2029 and 49.5 g/km from 2030 to 2034 has compelled automakers to reduce curb weight. Flow-formed designs can reduce wheel mass versus conventional cast/steel designs, supporting efficiency gains. Major OEMs have awarded multi-year supply deals to alloy specialists who can validate durability at a lower cost than forging. Euro 7 also introduces tighter non-exhaust limits; brake particle emissions (PM10) are tightened to 3 mg/km per vehicle from January 2035. Suppliers expanded flow-forming capacity across Germany and Eastern Europe to localize production for premium EV lines.
Custom-Wheel Aftermarket Boom in North America Driven by Pick-ups and SUVs
Light-truck buyers in the United States increasingly retrofit 20–22 inch wheels, seeking visual differentiation and higher load ratings. Financing packages that roll wheels and tires into a single payment boost affordability, lifting aftermarket demand. Trade-association shipment forecasts show sustained growth in replacement tires, confirming robust wheel-swap cycles. Performance wheel brands target price points of USD 200–500, supported by forged monoblock introductions that deliver both aesthetics and weight savings. The regional CAGR is therefore anchored in discretionary customization spend that OEM channels seldom monetize.
Cost-Efficient Low-Pressure Casting Scaling Out of China
Low-pressure casting now reaches cycle times in a relatively shorter time frame, granting Chinese exporters a significant landed-cost edge. Certification to global sustainability standards reassures overseas OEMs on environmental performance. Government dual-carbon goals encourage energy-efficient casting, aligning commercial and policy incentives. Research by a U.S. public agency indicates that the process reduces plant energy use by up to 40% compared to high-pressure die-casting. Western suppliers respond by consolidating and offloading commodity lines while focusing investments on advanced forming.
Restraints Impact Analysis*
| Restraint | (~)% Impact on CAGR Forecast | Geographic Relevance | Impact Timeline |
|---|---|---|---|
| Volatile Commodity Prices | -0.8% | Global, with acute exposure in Asia-Pacific and Europe | Short term (≤ 2 years) |
| EU Particulate-Abrasion Norms | -0.5% | Europe, with potential extension to UK and UNECE member states | Medium term (2-4 years) |
| High Tooling CAPEX | -0.3% | Global, concentrated in premium segments | Long term (≥ 4 years) |
| Supply Chain Disruptions | -0.2% | Global, with bottlenecks in magnesium and rare-earth supply | Short term (≤ 2 years) |
| Source: Mordor Intelligence | |||
Volatile Aluminum and Magnesium Commodity Prices Hurting OEM Margin Planning
Aluminum prices swung between USD 2,200 and USD 2,900 per ton during 2024-2025, driven by shifts in Chinese power policy and bauxite supply risk[2]. Magnesium shortages amplified the challenge as China controls more than 80% of global output. Tier-1 suppliers rarely hedge long-term magnesium exposure, forcing dual-sourcing and higher working-capital needs. Reported margin erosion of 150 basis points prompted acquisitions aimed at securing regional metal supply. The resulting cost variability deters OEMs from signing fixed-price wheel contracts, tempering near-term growth.
EU Particulate-Abrasion Norms Adding Compliance Cost to Wheel Surface Coatings
Euro 7 (Regulation (EU) 2024/1257), requirements apply from 29 November 2026 for new M1/N1 types and from 29 November 2027 for new M1/N1 vehicles, compelling coatings to withstand greater thermal cycling. Powder formulators now meet the updated ISO migration limits for heavy metals, but unit coating costs have increased by 5–8%. Suppliers invested in dual-cure UV and thermal lines, although cycle-time extensions dampen throughput. Smaller firms lacking capital are likely to exit or pivot to non-regulated export markets.
*Our forecasts treat driver/restraint impacts as directional, not additive. The impact forecasts reflect baseline growth, mix effects, and variable interactions.
Segment Analysis
By Vehicle Type: Passenger Cars Anchor Volume, Commercial Segments Lag
Passenger cars generated 71.87% of automotive wheel market revenue in 2025 and are on track for a 5.96% CAGR through 2031. Growth is concentrated in SUVs and crossovers that integrate 19–21-inch flow-formed rims to accommodate larger brake packages, house sensor hardware, and reinforce upscale styling cues. Within these body styles, wheel diameters are increasing as ride-height preferences intersect with regenerative braking requirements that favor larger calipers. Light commercial vehicles move more gradually because fleet buyers emphasize life-cycle costs, which discourages premium wheel upgrades, even when lightweighting would marginally reduce fuel use. Heavy trucks and buses remain deeply rooted in steel designs, while off-highway equipment follows infrastructure cycles that dictate a steady but gradual replacement demand.
The popularity of SUVs and crossovers amplifies demand for forged-aluminum wheels that offset the mass of batteries in hybrid trims, and OEM platform standardization ensures larger diameters across multiple nameplates, simplifying sourcing. In the aftermarket, these same body styles invite style-driven upgrades that funnel additional volume into 20–22 inch forged or flow-formed SKUs, reinforcing a virtuous circle for suppliers able to serve both channels. Commercial fleet managers continue to prioritize durability over weight, making steel the default despite higher fuel costs per mile, while municipal procurement rules add another layer of conservatism. Off-highway users, such as quarry and agricultural operators, specify corrosion-resistant coatings and reinforced flanges, yet overall unit demand remains relatively small.

By Material: Aluminum Alloy Dominates, Carbon-Fiber Gains Traction
Aluminum alloy held 64.99% of the automotive wheel market share in 2025, due to mature scrap recycling networks, well-understood metallurgy, and the broad availability of low-pressure casting capacity. Magnesium alloys progress cautiously; even with recent fire-safety milestones, insurers and homologation agencies still require additional validation before green-lighting volume programs. Carbon-fiber rims, however, are projected to post an 11.56% CAGR by 2031, as autoclave-free resin transfer molding reduces costs enough for premium BEVs to recoup the price delta in range or acceleration gains. Hybrid composite formats that bond aluminum centers to carbon barrels provide a middle ground, capturing buyers who demand significant weight savings without absorbing the complete sticker shock of a full-carbon product.
Producer strategies mirror these material dynamics. Large Tier-1 suppliers invest in capital expenditures (capex) for low-carbon aluminum smelters to stabilize input costs. In contrast, emerging specialists focus on automated carbon preform placement or rapid-cure resin systems that aim to achieve cycle-time parity with metal forming. As OEMs set stricter lifecycle CO₂ targets, the use of recycled aluminum ingots continues to climb, aided by closed-loop agreements that guarantee scrap returns. Carbon-fiber plants invest heavily in robotic trimming and non-destructive inspection to slash labor minutes per wheel, aligning overhead structures with auto-grade volume expectations. The overall mix suggests aluminum remains the baseline, but composite adoption will steadily expand as regulatory and performance pressures intensify.
By Manufacturing Process: Casting Holds Share, Flow-Forming Surges
Casting processes represented 59.02% of the automotive wheel market size in 2025 and continue to dominate because tooling is inexpensive, foundry footprints scale easily, and cycle-time improvements keep narrowing the performance gap with more advanced routes. Low-pressure casting is the standout within this family, posting faster growth than gravity or high-pressure variants due to significant weight reductions that satisfy mainstream OEM emissions targets at nominal cost uplift. Forging sustains its elite status in luxury coupes and performance sedans, where customers accept a significant premium for finer microstructures that enhance fatigue strength. Flow-forming, meanwhile, advances at an 8.75% CAGR by 2031, eroding the gravity-cast share by thinning barrel walls after initial casting or forging while preserving structural integrity.
Competitive positioning hinges on mastering multiple processes. Chinese suppliers lean on low-pressure casting for cost leadership, yet several are adding flow-forming cells to chase incremental content per wheel as EV platforms proliferate. European incumbents defend brand equity with forged and flow-formed portfolios backed by ISO-grade quality systems, while North American players weigh consolidation to fund re-tooling. Forgers invest in servo presses and heated-die lubrication to shave seconds off cycle times, whereas casting lines deploy AI vision to cull porosity defects before machining.
By Rim Size: Mid-Range Dominates, Oversized Gains Momentum
The 16–18 inch band accounted for 47.28% of the automotive wheel market share in 2025 because it aligns with mainstream compact and midsize passenger platforms that comprise global unit leaders. Tire availability is the widest in this segment, keeping replacement costs manageable for consumers and total cost of ownership metrics attractive for fleets. Yet the 19–21 inch range is advancing briskly as SUV and crossover penetration deepens, pushing wheel arches larger and brake packages bulkier. For luxury and performance EVs, OEM engineers specify diameters above 21 inches to accommodate massive calipers that manage regenerative braking and minimize aerodynamic drag through aero-cover integration. Meanwhile, the 13-15-inch bracket shrinks each year as subcompact ICE programs are retired or localized to emerging economies where purchasing power is more limited.
Growth at the upper end is reinforced by styling trends that equate larger wheels with premium cues, and by sensor packages that need extra real estate for TPMS antennas or load cells. Aftermarket buyers eagerly retrofit full-size trucks with 20–22 inch forged sets that combine aesthetics with payload credentials, sustaining a profitable niche for specialty brands. Tire makers accommodate the trend with reinforced sidewalls and low rolling-resistance compounds specifically tuned for heavy BEV curb weights, essentially locking the ecosystem into an upsize cycle. In contrast, cost-sensitive fleets such as last-mile delivery vans cling to 16-inch sizes to maintain parity across regional distribution centers. Taken together, rim-size dynamics reveal how vehicle mix, regulatory drag-area targets, and consumer taste dovetail to redefine sweet spots every planning cycle.
By Coating: Powder-Coated Leads, Diamond-Cut Accelerates
Powder coatings captured 44.44% of the automotive wheel market share in 2025, owing to their robust corrosion resistance, efficient material utilization, and compatibility with automated spray booths that operate at high line rates. The chemistry continues to evolve as suppliers strip out heavy metals to comply with REACH and Euro 7 requirements without sacrificing chip resistance. Diamond-cut finishes, cut via CNC lathes after base coating, are expected to exhibit a 7.37% CAGR by 2031, as their metallic sheen and contrasting surfaces resonate with mid-premium buyers who view wheels as a primary design canvas. Chrome-plated and polished styles keep declining because trivalent chrome alternatives still cost more and deliver thinner layers that struggle in harsh winter salt conditions. Painted wheels, primarily on steel rims, fade slowly as aluminum penetration rises and base-coat-only jobs struggle to command attention in dealer showrooms.
Regulatory headwinds intensify the need for durable surfaces that minimize particulate shedding under Euro 7’s abrasion caps, driving up R&D outlays and favoring well-capitalized coaters. Dual-cure UV and thermal lines balance energy consumption with throughput, but the capital bill places smaller vendors at a disadvantage, triggering consolidation. Color personalization gains ground in the aftermarket, prompting suppliers to deploy quick-change cartridge systems that swap shades in minutes, though OEMs still limit palette breadth for logistical simplicity.
By Vehicle Propulsion: Electrification Alters Wheel Design and Demand
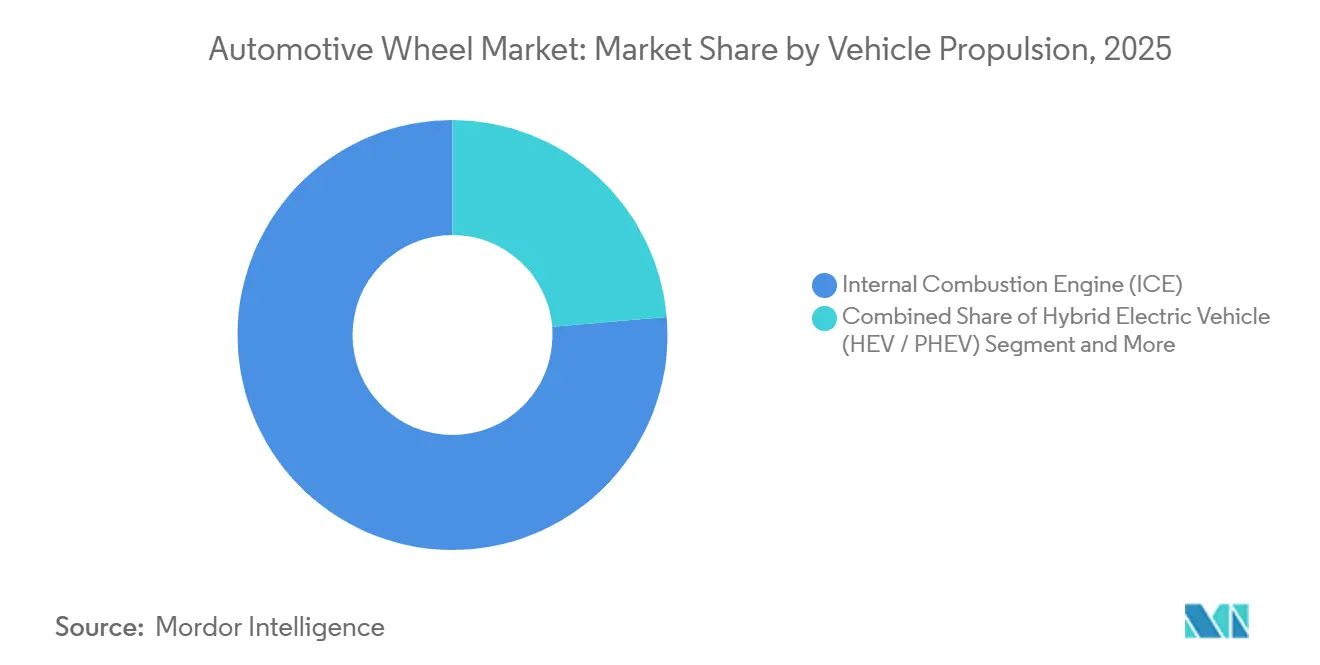
Internal-combustion engine vehicles represented 76.33% of the 2025 market share. However, BEVs surge at 13.93% CAGR through 2031 as zero-emission policies, falling battery costs, and expanding charging networks shift purchase decisions toward electrified nameplates. OEMs equip premium BEVs with forged-aluminum or carbon-fiber wheels to increase range by reducing unsprung mass, and they utilize flow-formed alloys on mass-volume EVs where price sensitivity remains a concern. Hybrid and plug-in hybrids trail BEVs in growth but still adopt lighter wheels to offset battery weight, making material migration a broad theme across propulsion types.
Supply-chain impacts differ by propulsion. Aluminum billet demand spikes alongside the adoption of BEVs, prompting smelters to negotiate long-term renewable-energy contracts that lower embedded CO₂ emissions. Meanwhile, magnesium use in niche BEV wheels remains volatile due to supply concentration risks. Carbon-fiber producers court electric-only programs because the absence of exhaust heat simplifies resin selection and reduces thermal-shock stress. Conversely, ICE vehicles in emerging markets stick with steel or gravity-cast aluminum to conserve capex, delaying advanced material penetration. In aggregate, propulsion mix dictates not only unit volume but also the technological frontier of wheel design, pushing suppliers to flex manufacturing portfolios in step with drivetrain shifts.
By Sales Channel: OEM Anchors Volume, Aftermarket Performance Gains
OEM contracts accounted for 79.57% of the automotive wheel market revenue in 2025, as automakers own platform engineering decisions, lock in multi-year volumes, and enforce rigorous validation that filters out smaller suppliers. Pricing pressure is relentless; Tier-1s compete on delivered cost per kilogram, dimensional tolerance, and just-in-sequence logistics that mesh with lean assembly lines. As OEMs target fleet-average weight reductions, suppliers pitch flow-formed or forged options but must prove total-cost superiority within five-year sourcing windows. Compliance documentation now includes recycled content audits, Scope 3 emission disclosures, and ESG scorecards, adding overhead yet deepening stickiness for certified partners.
The performance aftermarket, expanding at 6.83% CAGR, supplies enthusiasts who retrofit wheels for appearance, stance, or towing-capacity upgrades, particularly in North American truck culture. Gross margins of 30–40% attract regional brands that differentiate themselves via limited-edition finishes, proprietary spoke patterns, or rapid drops, which are often marketed on social media. Distribution remains fragmented; specialty retailers, e-commerce portals, and tire chains all vie for share, pushing suppliers to juggle package sizes, SKU proliferation, and return logistics. Replacement aftermarket growth relies on vehicle-parc aging and road-hazard damage, retaining a predictable baseline even during economic slowdowns.
Geography Analysis
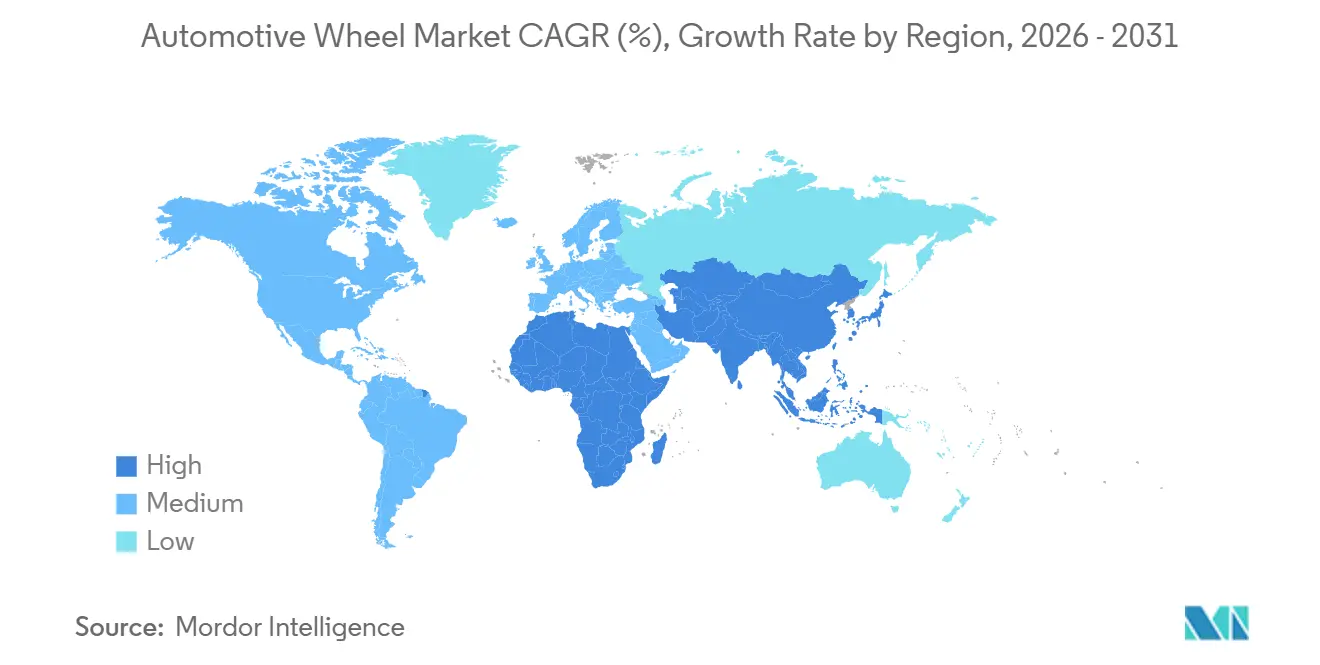
Asia-Pacific held 40.59% of the automotive wheel market share in 2025 and will advance at a 5.76% CAGR through 2031. Chinese producers utilize vertical integration in aluminum smelting and low-pressure casting to achieve a significant price advantage. India’s component manufacturers expand alloy-wheel capacity under production-linked incentives, while Japanese players focus on premium forged products exported across ASEAN. South Korea aligns wheel technology roadmaps with domestic OEM electrification targets.
North America is driven by resilient light-truck production and aftermarket customization. Mexican plants supply regional OEMs under nearshoring strategies, while private-equity-backed consolidation improves cost structures among U.S. suppliers. Tire-shipment forecasts confirm healthy replacement cycles that underpin aftermarket rims. However, mature vehicle-parc dynamics and price-sensitive OEM sourcing temper overall expansion.
Europe's declining ICE production and stringent CO₂ targets increase compliance costs, but flow-formed aluminum wheels gain market share as OEMs seek mass reductions. Investment in advanced coating lines prepares suppliers for Euro 7 particulate limits. Emerging clusters in Turkey and Eastern Europe offer labor-cost relief while maintaining proximity to EU assembly plants.
Regulatory Landscape
Automotive wheels and replacement rims are shaped by safety and fitment standards that refer to dimensional and labeling specifications from designated technical bodies. In the United States, NHTSA administers Federal Motor Vehicle Safety Standards under 49 CFR Part 571, including FMVSS No. 110 for passenger-car tire selection and rims, and FMVSS No. 120 for vehicles other than passenger cars. These requirements tie rim compliance to recognized specifications, such as those from the Tire and Rim Association and ETRTO, influencing OEM sourcing and aftermarket validation.
In Europe and other UNECE markets, the UNECE WP.29 type-approval framework is the reference point, including UN Regulation No. 124 for new replacement wheels. Trade and compliance requirements have intensified for steel road wheels, with the European Commission imposing a definitive anti-dumping duty on imports of steel road wheels from China under Commission Implementing Regulation (EU) 2026/428 (February 2026). In parallel, the US Department of Commerce initiated a circumvention inquiry in March 2026 covering steel wheels finished in Thailand using hot-rolled steel from China, which increases the value of traceable origin documentation and regional manufacturing footprints.
Value Chain Analysis
The automotive wheel value chain begins with raw materials and semi-finished inputs, including steel coil and plate, aluminum primary metal and recycled scrap, and, for lightweight premium applications, carbon-fiber and resin systems. Aluminum wheel supply is split between primary smelting and secondary recycling, with foundry-grade scrap availability and chemistry control (often for alloys in the A356 family) shaping yield and mechanical performance. Upstream volatility in aluminum and magnesium pricing, along with limited availability for specialty alloys, can flow quickly into OEM RFQs and contract structures.
Manufacturing covers casting (gravity, low-pressure, and high-pressure/die-cast), forging, and flow-forming/spin forging, followed by machining, surface finishing (powder coat and diamond-cut), inspection and traceability, packaging, and just-in-sequence delivery to OEM plants or aftermarket distribution through wholesalers, retailers, and e-commerce. Capability upgrades increasingly rely on technical collaborations and licensing, such as Wheels India signing a technical assistance agreement with Topy Industries in December 2025 for cast aluminum alloy wheel design and manufacture, and Borbet partnering with Dymag and AIM in June 2025 to industrialize carbon-hybrid wheel technology for OEM and aftermarket use. Regionalization requirements, including North America sourcing expectations and tariff exposure, have also elevated the role of localized capacity, dual sourcing, and validated alternative SKUs across both OEM and replacement channels.
Competitive Landscape
Market concentration is moderate, with the top five suppliers holding the majority of the market share, yet facing pressure from both commodity volatility and new entrants. Tier-1 companies pursue vertical integration in the upstream aluminum sector to protect their margins. Carbon-fiber specialists target premium EV programs that justify high unit prices, while regional players carve out niches in performance aftermarket or motorsport.
Technology acts as a key differentiator; leaders implement digital-twin simulations and automated defect detection to shorten development cycles and ensure traceability. Sensor-embedded wheels open a service-revenue frontier tied to predictive maintenance. Mid-tier companies unable to absorb rising compliance and R&D costs may consolidate or exit, enabling larger groups to capture share through capacity rationalization.
Strategic moves in 2025 include the establishment of new forged-aluminum truck-wheel plants, capacity expansions for alloy wheels in India, and joint ventures aimed at securing local access to aluminum billets. Suppliers also align ESG credentials with OEM purchasing criteria by adopting certified low-carbon aluminum and closed-loop recycling programs.
Automotive Wheel Industry Leaders
-
BORBET GmbH
-
Ronal Group AG
-
Iochpe-Maxion SA
-
CITIC Dicastal (CITIC Group)
-
Superior Industries Intl.
- *Disclaimer: Major Players sorted in no particular order

Market Opportunities and Future Outlook
Alloy wheel and adjacent lightweight chassis investments point to near-term whitespace in regional hubs supplying OEM electrification programs and premium trim migration toward larger diameters. In India, Uno Minda approved an expansion for a four-wheeler alloy wheel facility at Chhatrapati Sambhajinagar, Maharashtra, with 1.8 million units of annual capacity supported by an investment of INR 7.64 billion (February 2026). Steel Strips Wheels Limited advanced a related aluminum wheel and knuckle project in Bhuj, Gujarat, involving INR 5 billion to add 1.2 million units of annual alloy wheel capacity alongside 1.1 million units of knuckle capacity (June 2026). Together, these investments align with the market shift toward aluminum alloy, which already leads by share, and with OEM efforts to reduce unsprung mass in BEVs.
Opportunities are also emerging around compliance-led differentiation and supply-chain reconfiguration. Euro 7 timing for new type approvals and vehicles (late-2026 onward for M1/N1 types and 2027 for new vehicles) increases demand for coatings and process controls that reduce surface wear and particulate contribution, favoring suppliers that can industrialize advanced coating lines at scale. In parallel, trade actions on steel road wheels, including the EU definitive anti-dumping duty on Chinese-origin steel road wheels (Regulation (EU) 2026/428) and the US circumvention inquiry initiated in March 2026, are pushing OEMs and distributors to tighten origin traceability and diversify sourcing. This creates space for regional producers with compliant documentation, localized machining and finishing, and established homologation pathways, including UNECE R124 for replacement wheels.
Recent Industry Developments
- July 2026: Wheels India announced an INR 250 crore investment for FY26-27 to expand alloy wheel manufacturing capacity, targeting demand tied to electric bus and passenger vehicle applications. The company move highlights accelerating domestic sourcing of higher-value alloy wheels and reinforces India as a growing production hub for OEM supply programs.
- November 2025: Iochpe-Maxion announced the acquisition of a 50.1% stake in Polimetal in Argentina to expand light vehicle aluminum wheel capacity in South America. The transaction strengthens regional manufacturing access and supports localization strategies for OEMs that are tightening supply-chain resilience and cost-to-serve.
- August 2024: Borbet acquired Dymag Group Limited, including its brand, patents, and production facilities, expanding Borbet’s reach into carbon and magnesium rim technologies. This acquisition broadened Borbet’s lightweight-material portfolio for premium OEM and performance applications, positioning it closer to carbon-hybrid wheel industrialization efforts.
Research Methodology Framework and Report Scope
Market Definition and Coverage
The automotive wheel market covers the value of wheels and rims sold for on-road and off-road vehicles, including OEM fitment and replacement demand. It includes common materials such as steel and light alloys, and it counts complete wheel units sold across major regions.
Scope exclusions: We exclude tires, tire wheel assemblies sold as a bundled kit, and service revenue such as refinishing, alignment, or general repair labor.
Segmentation Overview
- By Vehicle Type
- Passenger Car
- Hatchback
- Sedan
- SUV / Crossover
- Sports and Luxury
- Light Commercial Vehicle (LCV)
- Heavy Commercial Vehicle (HCV)
- Trucks
- Buses and Coaches
- Off-Highway Vehicle
- Construction and Mining Equipment
- Agricultural Tractors
- Passenger Car
- By Material Type
- Steel
- Aluminum Alloy
- Magnesium Alloy
- Carbon-Fiber
- Hybrid Composite (Al-CF)
- By Manufacturing Process
- Casting
- Gravity Cast
- Low-Pressure Cast
- High-Pressure / Die-Cast
- Forging
- Flow-Forming / Spin-Forged
- Others (Spinning, 3-D Printed)
- Casting
- By Rim Size
- 13 to 15 inch
- 16 to 18 inch
- 19 to 21 inch
- Over 21 inch
- By Coating
- Powder-Coated
- Diamond-Cut / Machined
- Chrome / Polished
- Painted
- By Vehicle Propulsion
- Internal Combustion Engine (ICE)
- Hybrid Electric Vehicle (HEV / PHEV)
- Battery Electric Vehicle (BEV)
- Fuel-Cell Electric Vehicle (FCEV)
- By Sales Channel
- Original Equipment Manufacturer (OEM)
- Aftermarket
- Replacement
- Performance / Customization
- By Geography
- North America
- United States
- Canada
- Rest of North America
- South America
- Brazil
- Argentina
- Rest of South America
- Europe
- Germany
- United Kingdom
- France
- Italy
- Spain
- Rest of Europe
- Asia-Pacific
- China
- India
- Japan
- South Korea
- Rest of Asia-Pacific
- Middle East and Africa
- Turkey
- Saudi Arabia
- United Arab Emirates
- South Africa
- Nigeria
- Rest of Middle East and Africa
- North America
Data Sources, Market Sizing, and Validation
Desk Research
To set a reliable base, we start with public production and parc signals and then connect them back to wheel demand. Common inputs include vehicle production and registration series published by sources such as OICA (International Organization of Motor Vehicle Manufacturers) and national transport agencies, which help set the yearly build and replacement pool.
We also review trade and tariff codes for wheels and parts from sources such as UN Comtrade and national customs dashboards, followed by technical and safety references from bodies such as NHTSA and UNECE where relevant. Company filings, investor decks, and industry association updates are used to understand mix shifts like steel versus alloy and typical rim size migration. Where needed, paid subscriptions for company financials and patent databases are used to cross-check revenue splits and technology direction, without depending on any one dataset. The specific desk sources listed here are illustrative, and many other references were used for data collection, validation, and clarification.
Primary Interviews and Surveys
Primary work was used to confirm how wheel shipments split between OEM and aftermarket, and how pricing moves with material costs and design upgrades. We spoke with a mix of wheel makers, distributors, and vehicle OEM-side sourcing contacts across major regions, so assumptions on rim size, finish trends, and channel margins could be corrected where secondary data was thin.
Distribution of primary research fieldwork respondents
| Company type | Respondent position | Region |
|---|---|---|
| Top tier: 32% | CXOs: 19% | APAC: 43% |
| Mid tier: 49% | Functional/Unit leaders: 27% | EMEA: 36% |
| Smaller Players: 19% | Managers: 54% | Americas: 21% |
Market-Sizing & Forecasting
Sizing starts from a demand pool build based on vehicle production and in-use fleet, which are then translated into wheel units using fitment rates by vehicle type and typical wheels-per-vehicle. The top-down step is grounded in production, registration, and trade signals, and then value is built by applying price decks that reflect material mix and rim size bands.
To keep totals realistic, we corroborate them with selective bottom-up checks, such as sampled supplier revenue splits, channel checks on replacement volumes, and simple ASP x volume tests for key regions. Inputs tracked in the model include passenger versus commercial output, alloy penetration by region, rim size mix (for example 13-15 inch versus 16-18 inch and above), OEM versus aftermarket share, and indicators tied to replacement cycles such as vehicle parc age. Where gaps exist in company-level disclosure, the missing portions are handled through peer averages and region-level mix, and then re-tested with interviews.
For forecasting, scenario analysis is used so growth can be flexed based on vehicle build outlook, lightweighting adoption, and expected price movement for metals. Assumptions are adjusted after checking with practitioners on likely OEM sourcing direction and aftermarket demand resilience.
Data Validation & Update Cycle
Outputs are checked against independent signals, including vehicle production totals, trade direction, and the implied wheels-per-vehicle logic so extreme results get flagged early. Large variances are reviewed in steps, first by re-checking the input series, then by revisiting mix and pricing assumptions, and finally by doing a short re-contact with sources when the gap cannot be explained.
Before sign-off, the model and write-up go through a second analyst review so arithmetic, unit conversions, and regional totals align. The report is refreshed annually, and interim updates are made when a material event changes vehicle output, material pricing, or major sourcing behavior. Right before delivery, we run a fresh pass so clients receive an updated view, not an older snapshot.
Mordor Intelligence's Automotive Wheel Market Size Versus Other Published Estimates
Published market numbers for wheels often vary because the counted products and channels are not always the same, and the pricing logic can be handled differently across studies. Differences also come from the vehicle set included, currency timing, and whether the estimate is refreshed when production and metal costs move.
The main gap comes from whether off-highway and agricultural wheels are counted, and how OEM plus aftermarket volumes are priced across rim size and material shifts. This is where Mordor Intelligence keeps the scope limited to wheel and rim revenue and updates ASP assumptions as mix migrates from steel to alloy.
Benchmark comparison
| Source | Market Size | Gaps in Research Methodology |
|---|---|---|
| Mordor Intelligence | USD 61.49 B (2026) | |
| Trade Journal A | USD 34.42 B (2024) | Often centers on on-road passenger and commercial wheels, with a shorter scope that can undercount off-highway and agricultural fitments, and it can use a single-year price point without fully reflecting rim size upshift. |
| Industry Bulletin B | USD 41.87 B (2024) | Reported as wheel rims and can include adjacent applications such as two-wheelers, which changes the mix, while forecast logic may lean on a higher near-term growth rate and broader application pool. |
The spread in values mostly traces back to scope choices and how price and mix are carried through the model. By tying demand to vehicle output plus replacement cycles, and then validating with channel and supplier checks, the estimate stays traceable to clear drivers and can be reproduced when new inputs become available.
Key Questions Answered in the Report
What is the projected value of the automotive wheel market by 2031?
The automotive wheel market is forecast to reach USD 80.17 billion by 2031.
Which rim size segment is growing the fastest toward 2031?
Rims over 21 inches record the highest growth at 7.75% CAGR due to luxury EV and aftermarket demand.
How are Euro 7 rules influencing wheel design?
The rules cap brake-dust emissions, encouraging flow-formed aluminum wheels and advanced coatings that lower weight and particulate release.
Why are carbon-fiber wheels gaining traction?
Autoclave-free resin transfer molding has cut production costs significantly, enabling OEM adoption on premium EV models.
Which region currently leads automotive wheel production?
Asia-Pacific leads with 40.59% share, driven by China’s extensive low-pressure casting capacity and BEV penetration.