
Automotive Safety Systems Market Size and Share
Market Overview
| Study Period | 2020 - 2031 |
|---|---|
| Market Size (2026) | USD 151.79 Billion |
| Market Size (2031) | USD 223.61 Billion |
| Growth Rate (2026 - 2031) | 8.05 % |
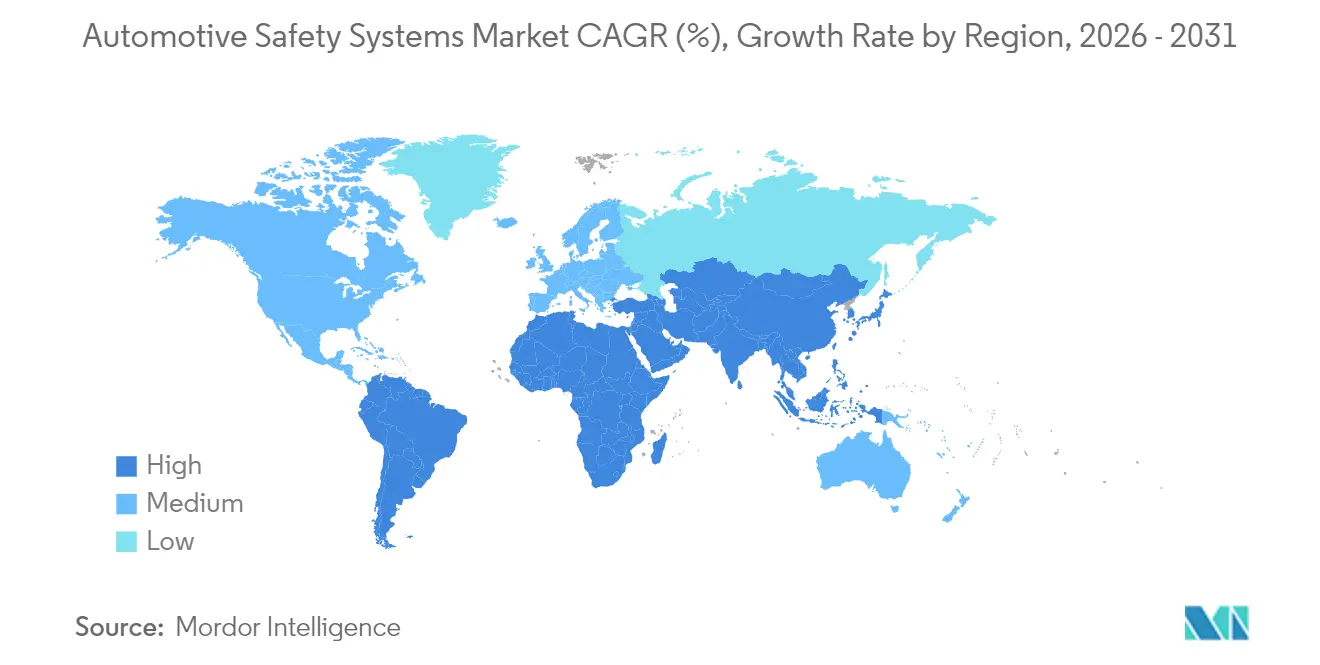
| Fastest Growing Market | South America |
| Largest Market | Asia Pacific |
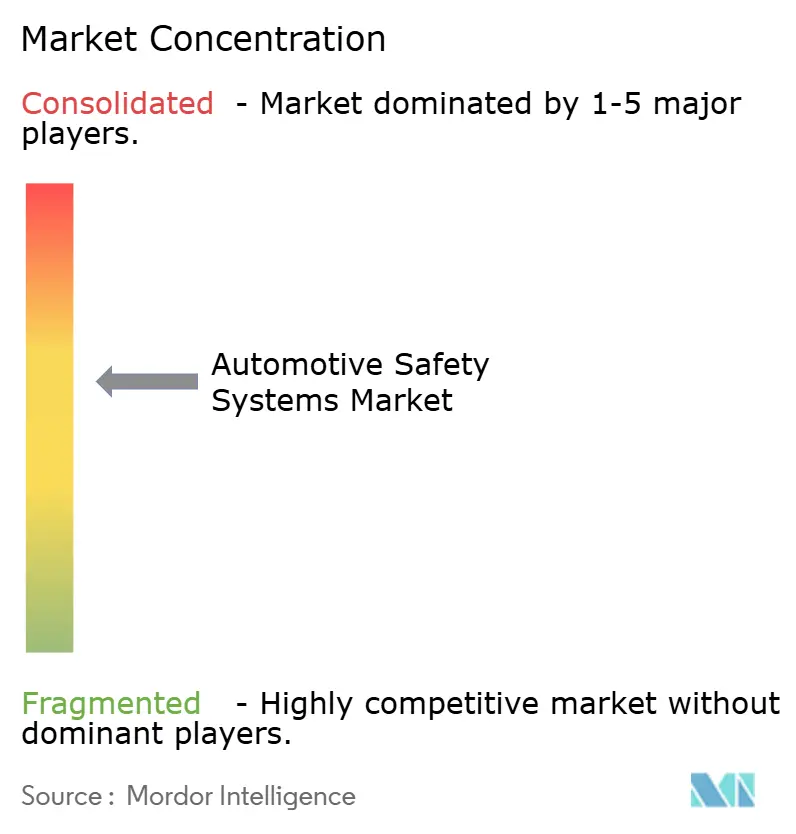
| Market Concentration | Medium |
Major Players *Disclaimer: Major Players sorted in no particular order Image © Mordor Intelligence. Reuse requires attribution under CC BY 4.0. | |
Automotive Safety Systems Market Analysis by Mordor Intelligence
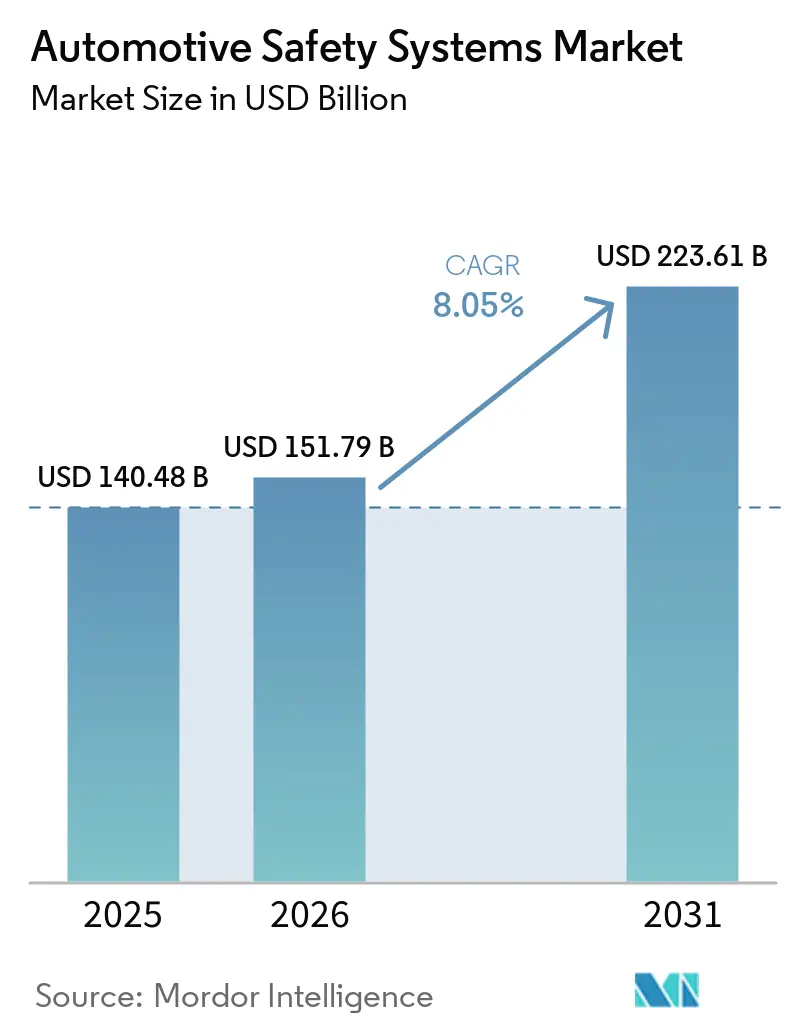
The Automotive Safety Systems market size is expected to grow from USD 140.48 billion in 2025 to USD 151.79 billion in 2026 and is forecast to reach USD 223.61 billion by 2031 at 8.05% CAGR over 2026-2031. Demand reflects simultaneous progress in global safety regulation, rapid sensor price erosion, and the rise of software-defined vehicles that permit over-the-air upgrades. The shift from hardware-only restraint devices toward integrated sensor-plus-software platforms allows vehicles to predict, avoid, and mitigate collisions in real time. Automakers now package active braking, lane keeping, driver monitoring, and cyber-secure update pathways as standard content, especially in markets where star-rating programs influence buying behavior.
Key Report Takeaways
- By system type, Active Safety Systems led with 66.62% of the automotive safety system market share in 2025; in-cabin biometric analytics is projected to expand at an 8.27% CAGR through 2031.
- By technology component, radar commanded 34.08% revenue share in 2025, while LiDAR is on track for an 8.49% CAGR to 2031.
- By end-user, OEM factory-fit solutions represented 83.05% share in 2025; the aftermarket is forecast to grow at an 8.55% CAGR.
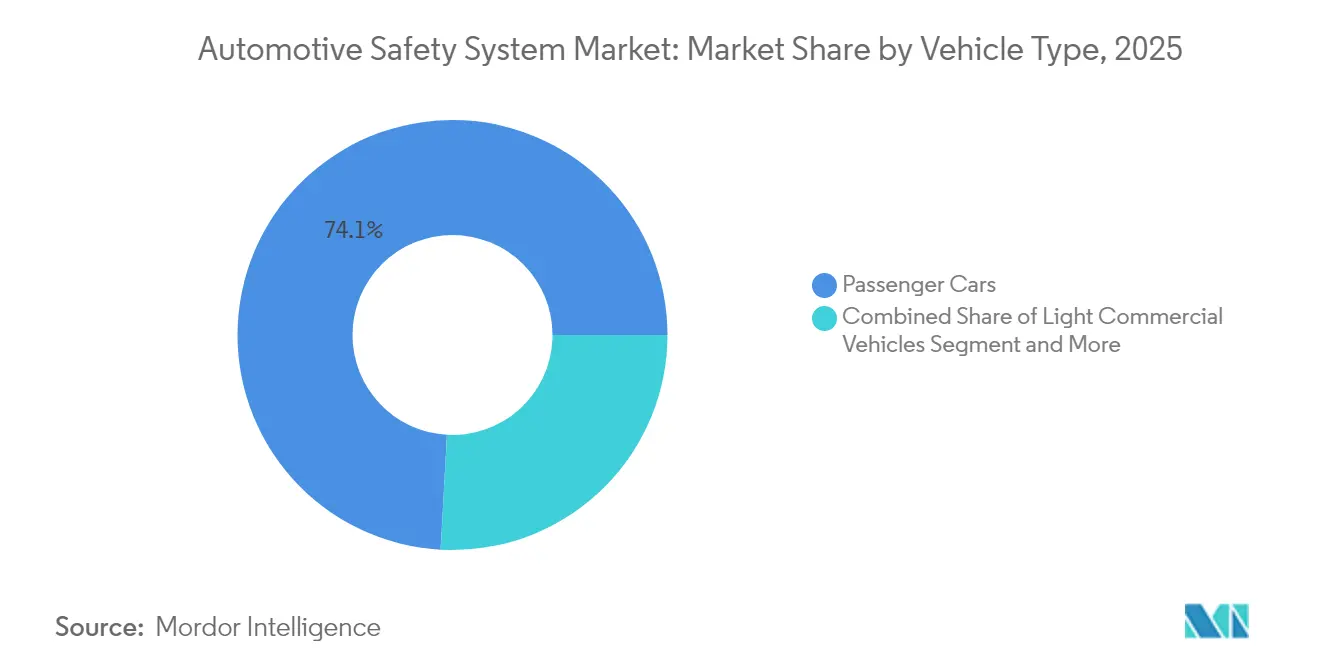
- By vehicle type, passenger cars held 74.12% share in 2025, whereas heavy commercial vehicles are expected to register an 8.16% CAGR through 2031.
- By propulsion, ICE models captured 77.65% share in 2025, while battery-electric vehicles are poised for a 8.98% CAGR to 2031.
- By geography, Asia Pacific accounted for 39.42% revenue in 2025; South America shows the fastest expansion at an 8.51% CAGR through 2031.
Note: Market size and forecast figures in this report are generated using Mordor Intelligence’s proprietary estimation framework, updated with the latest available data and insights as of 2026.
Market Trends and Insights
Drivers Impact Analysis of Automotive Safety Systems Market*
| Driver | (~) % Impact on CAGR Forecast | Geographic Relevance | Impact Timeline |
|---|---|---|---|
| Tightening Global NCAP and UNECE Safety | +2.1% | Global, with early adoption in EU and China | Short term (≤ 2 years) |
| Rapid Sensor-Cost Deflation | +1.8% | Global, with strongest impact in APAC and North America | Medium term (2-4 years) |
| Boom in Software-Defined Vehicles | +1.5% | North America and EU, expanding to APAC | Medium term (2-4 years) |
| Shift Toward Level-2+ Autonomy | +1.3% | North America and EU core markets | Long term (≥ 4 years) |
| Rise of AI-Based in-Cabin Biometric Safety Analytics | +0.9% | Global, with premium segment leadership | Medium term (2-4 years) |
| Bundling of Vehicle-Safety Data into Usage-Based Insurance | +0.7% | North America and EU, selective APAC markets | Long term (≥ 4 years) |
| Source: Mordor Intelligence | |||
Tightening Global NCAP & UNECE Safety Mandates
Euro NCAP protocols for 2026 require pedestrian automatic emergency braking and driver monitoring across all model classes, creating a common compliance baseline. China’s Ministry of Industry and Information Technology introduced rules in 2025 that obligate type approval for every software update touching safety functions. The EU General Safety Regulation II, in force since July 2024, obliges intelligent speed assistance and emergency lane keeping on every new vehicle. NHTSA updated its New Car Assessment Program to add blind-spot warning, lane keeping assistance, and pedestrian AEB for 2026 models, signaling a decade-long push for active safety. Global alignment lets manufacturers spread development cost across larger volumes and catalyzes faster diffusion of advanced functions.
Rapid Sensor-Cost Deflation Enabling ADAS Standardisation
Automotive radar prices now fall nearly 18% each year, while processor capability doubles every 18 months, permitting high-performance perception at entry-segment price points. Four-dimensional imaging radar brings centimeter-grade detection accuracy at cost levels close to legacy 3-D units, broadening use beyond adaptive cruise control. Image sensors benefit from smartphone supply chains: 8-megapixel automotive chips with HDR are available below USD 10. NITI Aayog projects semiconductor value per vehicle to double to USD 1,200 by 2030, led by ADAS content. The declining cost curve allows the automotive safety system market to extend Level-1 and Level-2 features to compact cars sold in Asia and Latin America.
Boom in Software-Defined Vehicles (OTA Safety Feature Upgrades)
Centralised compute architectures decouple safety logic from fixed hardware, enabling continual feature growth after sale. HARMAN OTA 12.0 already manages secure updates for more than 40 brands, coordinating high-performance computers and legacy ECUs in the same vehicle domain.[1] Sibros Deep Updater, certified to ISO 26262 ASIL-D, uses delta files to trim download size, lowering cellular data cost while keeping critical functions current.[2] UNECE Regulation R156 now requires a software-update management system on every new model, giving cybersecurity parity with the physical safety layer. Subscription pricing for premium AEB algorithms is emerging, creating fresh revenue streams inside the automotive safety system market.
Shift Toward Level-2+ Autonomy in Commercial Vehicles (Fleet TCO Play)
Fleet operators adopt advanced safety packages that cut collision claims by up to 90% and trim yearly accident-related costs by roughly USD 6,000 per heavy truck. The 2024 Work Truck Fleet Safety Study shows that majority of fleets ranking well-maintained vehicles with ADAS as their top priority, and nearly half already equip backup cameras and air-disc brakes. Automated driving systems reduce fatigue-related incidents and let fleets experiment with capacity-as-a-service models that increase asset utilisation. While true driverless operations remain long-term, Level-2+ functionality offers tangible cost benefits that propel the automotive safety system market in commercial segments.
Restraints Impact Analysis of Automotive Safety Systems Market*
| Restraint | (~) % Impact on CAGR Forecast | Geographic Relevance | Impact Timeline |
|---|---|---|---|
| High Validation and Homologation Cost | -1.2% | Global, with highest impact in emerging markets | Medium term (2-4 years) |
| Chip-Set Supply Volatility | -0.8% | Global, with acute impact in APAC manufacturing | Short term (≤ 2 years) |
| Cyber-Physical Attack Risk | -0.6% | Global, with highest exposure in connected vehicle markets | Medium term (2-4 years) |
| High-Voltage Electromagnetic Interference and Thermal Loads | -0.4% | Global, concentrated in premium EV segments | Long term (≥ 4 years) |
| Source: Mordor Intelligence | |||
High Validation & Homologation Cost for Multicountry Compliance
Manufacturers must reconcile China’s C-NCAP 2024 test matrix with Euro NCAP 2026 requirements, often repeating crash and software validation for similar scenarios. TÜV SÜD now runs mandatory penetration testing under EU rules, adding months of cybersecurity reviews before market release. ISO/SAE 21434 demands threat analysis across the full vehicle lifecycle, lengthening development schedules and raising costs for small automakers. These factors slow the spread of cutting-edge features in cost-sensitive markets, restraining part of the automotive safety system market until harmonisation improves.
Chip-Set Supply Volatility Delaying OEM Safety Roll-Outs
Automotive-grade radar and vision chips must withstand extended temperature ranges and meet zero-defect targets, limiting the pool of qualified suppliers. Geopolitical events and natural disasters tighten allocation for key image sensors, while domain-controller processors carry lead times beyond 30 weeks. OEMs adopt dual-sourcing and buffer inventory strategies, yet sporadic shortages still force feature de-contenting on high-volume models. Supply uncertainty particularly disrupts APAC plants that rely on just-in-time logistics, creating a headwind for the automotive safety system market in the near term.
*Our forecasts treat driver/restraint impacts as directional, not additive. The impact forecasts reflect baseline growth, mix effects, and variable interactions.
Automotive Safety Systems Market Segment Analysis
By System Type:
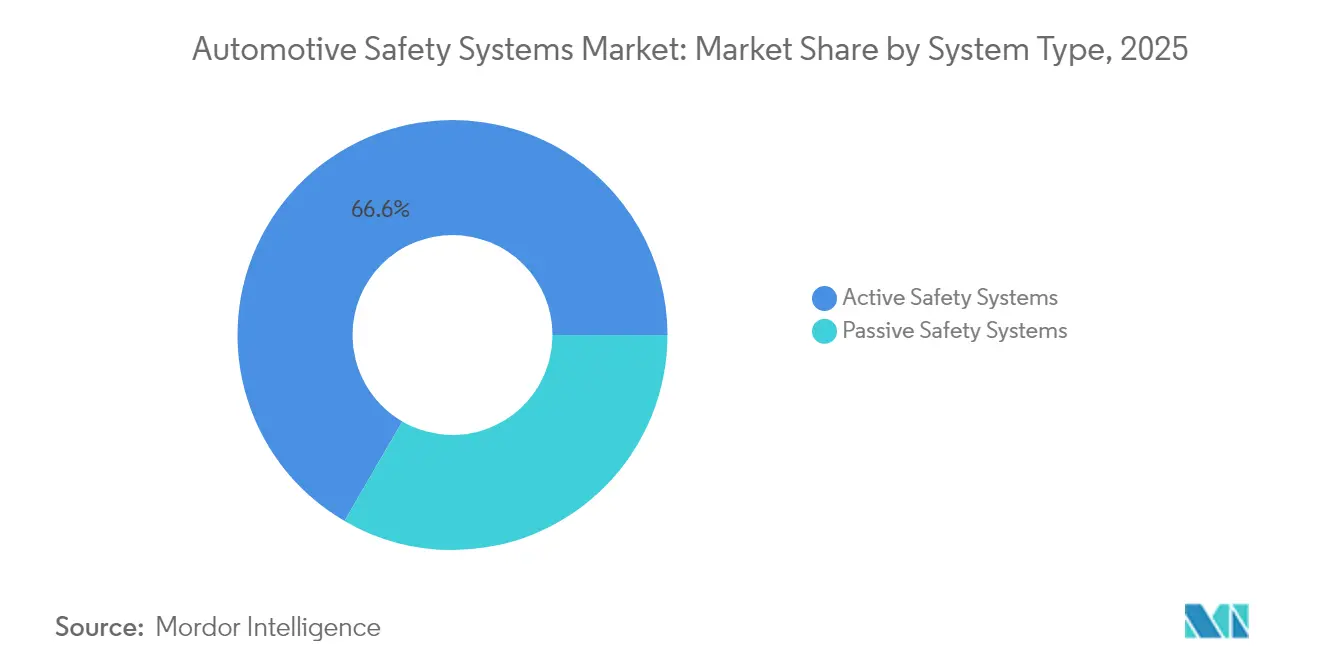
Active Safety Systems Cement LeadershipActive Safety Systems generated the largest slice of the automotive safety system market size at 66.62% in 2025. Automated emergency braking, adaptive cruise, lane keeping, and driver monitoring now appear in mid-range trims as Euro NCAP and NHTSA protocols grow stricter. Competitive intensity rises as suppliers integrate radar, camera, and LiDAR data through domain controllers that run machine-learning models in real time. The segment also benefits from fleet demand, with insurers offering premium discounts for trucks equipped with crash-avoidance technology.
In-cabin biometric platforms stand out as the fastest subsegment, advancing at an 8.27% CAGR to 2031. These solutions track driver alertness, heart rate, and even oxygen saturation, issuing proactive warnings before dangerous conditions emerge. As cabin sensors link with active braking controllers, occupants receive a closed-loop safety envelope that anticipates both external and internal threats. Passive safety remains relevant through smart airbags and adaptive seat belts that fit new seat layouts in autonomous vehicles, yet growth stays moderate.

By Technology Component:
Radar Dominates as LiDAR ScalesRadar modules accounted for 34.08% of the automotive safety system market in 2025, underpinned by cost-effective 77-GHz chipsets that function reliably in rain, snow, and fog. The move to 4-D imaging radar sharpens angle resolution and permits object classification, narrowing the performance gap with LiDAR at a lower bill of materials. Camera systems continue to leverage smartphone economics, letting OEMs add 360-degree vision for parking and low-speed manoeuvres.
LiDAR registers the quickest expansion at an 8.49% CAGR, supported by solid-state architectures that trim moving parts and cut price per sensor. Level-3 highway-pilot launches in premium sedans rely on forward-facing LiDAR for redundant depth perception and road debris detection, accelerating adoption. Control units merge braking, steering, and perception data into single chips, reducing wiring and weight. Software innovations that apply self-learning algorithms on edge processors differentiate suppliers as the automotive safety system market transitions toward predictive safety.
By End-User:
OEM Factory-Fit Dominance Meets Retrofit DemandOEM factory-fit installations captured 83.05% of the automotive safety system market in 2025 thanks to platform-wide integration of sensors, controllers, and software validated under strict quality gates. Centralised sourcing reduces warranty exposure and unlocks scale economics, allowing automakers to meet regulatory mandates without unplanned cost spikes. Continuous over-the-air improvement further cements the OEM channel as vehicles gain value throughout the service life.
Aftermarket solutions, though smaller, expand at an 8.55% CAGR through 2031. Fleet operators retrofit collision-warning cameras, side radar, and driver monitoring units to older trucks, achieving immediate insurance savings and compliance with tightening safety rules. Suppliers now offer plug-and-play kits that integrate with telematics gateways, easing installation time. Usage-based insurance carriers promote adoption by lowering premiums for vehicles that transmit verified safe-driving metrics, adding momentum to this slice of the automotive safety system industry.
By Vehicle Type:
Passenger Cars Remain Core as Trucks AcceleratePassenger cars controlled 74.12% of the automotive safety system market in 2025, reflecting sheer volume and consumer expectation for high safety scores. Automakers standardise AEB and lane keeping on entry hatchbacks, while premium badges add highway-pilot functions with redundant LiDAR sensing. Interior innovation targets occupant status detection to secure future Euro NCAP stars.
Heavy commercial vehicles represent the quickest-growing class with an 8.16% CAGR to 2031. Fleet economics favour investment in lane centring, adaptive steering, and camera-based blind-spot elimination that together reduce collision frequency by majority. The automotive safety system market size for trucks is further buoyed by driver shortages and hours-of-service restrictions, pushing operators toward partially automated mileage that keeps rigs rolling longer without compromising safety.
By Propulsion:
Electrification Introduces New Safety LayersICE models still dominate, holding 77.65% share of the automotive safety system market in 2025. The legacy fleet and mature supply chains ensure consistent demand for airbags, seat belts, and cost-optimised ADAS. Hybrid and fuel-cell platforms add battery management and hydrogen leak detection, but account for modest volume today.
Battery-electric vehicles form the fastest-moving propulsion group at a 8.98% CAGR. High-energy packs demand thermal runaway suppression, while chassis layouts with skateboard batteries alter crash kinematics and sensor field-of-view requirements. The growing adoption of battery-electric vehicles is also supporting acoustic vehicle alerting system market growth, as AVAS technologies help enhance pedestrian awareness around low-noise electric vehicles at low speeds. Hyundai Mobis unveiled a self-extinguishing battery that activates within five minutes of temperature spike, integrating seamlessly with existing airbag controllers. Extra weight from packs also drives adoption of brake-by-wire and regenerative coordination to shorten stopping distance, enriching opportunities across the automotive safety system market.
Geography Analysis
APAC Automotive Safety Systems Market
Asia Pacific retained the largest regional position with 39.42% share of the automotive safety system market in 2025. China’s MIIT rules compelling approval for every ADAS software update foster a robust compliance ecosystem that speeds feature rollout. Technology – auto convergence appears in partnerships such as Huawei and Xpeng, which co-develop domain controllers integrating radar, camera, and LiDAR on a common software stack. Japan nurtures AI-driven start-ups that pilot autonomous shuttles for urban centres, while India’s tighter crash regulations boost demand for cost-optimised airbags and AEB in compact cars.
South America Automotive Safety Systems Market
South America posts the highest growth, advancing at an 8.51% CAGR through 2031. Stellantis committed EUR 5.6 billion between 2025 and 2030 to launch more than 40 models from local plants, each aligned with Euro NCAP test protocols. Brazil, Argentina, and neighbouring markets harmonise safety laws, letting global suppliers replicate validated sensor suites without custom tuning. Bio-hybrid powertrains that blend ethanol engines with battery packs open fresh integration tasks for thermal and electrical safety systems.
North America and EMEA Automotive Safety Systems Market
North America and Europe uphold mature positions with high per-vehicle content and software-defined vehicle regulations. The automotive safety system market share in these regions remains stable, yet value per unit rises as UNECE Regulation 155 enforces full cybersecurity, obliging every safety ECU to meet anti-hacking standards. The Middle East and Africa progress from low baselines, stimulated by infrastructure expansion, yet local climate extremes drive demand for robust sensor housings and dust-proof radar enclosures.
Regulatory Landscape
Vehicle safety requirements are tightening through a mix of global technical rules and consumer-test protocols that increasingly target active safety, software integrity, and automated-driving readiness. In Europe, the EU General Safety Regulation II (Regulation (EU) 2019/2144) has been in force since July 2024, establishing mandatory fitment of functions such as intelligent speed assistance and emergency lane keeping on new vehicles, while Euro NCAP 2026 protocols elevate pedestrian AEB and driver monitoring as cross-segment expectations. In the US, NHTSA has been expanding the scope of safety performance requirements around advanced driver assistance and automated driving, including 2026 activity to modernize FMVSS frameworks to better accommodate ADS-equipped vehicles.
Regulation is also moving from hardware-centric compliance toward lifecycle governance of software and cybersecurity for safety functions. UNECE Regulation R156 requires a software-update management system on new models, and China’s MIIT introduced 2025 rules that obligate type approval for software updates that touch safety functions, which raises the compliance burden for OTA-enabled safety features. In 2026, UNECE WP.29 approved a global regulatory framework enabling fully autonomous driving systems (ADS), giving suppliers a harmonization anchor to scale validated perception, braking, and monitoring stacks across markets under a more consistent legal baseline.
Value Chain Analysis
The automotive safety systems value chain spans semiconductor and sensor IP, module manufacturing (radar, cameras, airbags, ECUs/domain controllers), software and algorithm development, vehicle integration and homologation, and then distribution primarily through OEM factory-fit channels (which represented 83.05% of installations in 2025) plus a growing retrofit ecosystem for fleets. Upstream dependencies on automotive-grade semiconductors and safety-certified software toolchains remain structural, as components must meet functional safety and cybersecurity requirements (e.g., ISO 26262, ISO/SAE 21434, and UNECE R156 processes for software updates). Switching suppliers can also trigger extensive re-validation for safety-critical modules.
Recent sourcing moves show how suppliers and OEMs are tightening relationships around critical inputs and localization. Continental Automotive and NOVOSENSE signed a memorandum of cooperation in November 2024 to co-develop automotive-grade sensor ICs for functional safety applications, while onsemi and DENSO strengthened a long-term partnership in December 2024 to secure semiconductor procurement for autonomous driving and ADAS. Supply chain fragility persists for non-interchangeable chips and qualified packages, reinforcing dual-sourcing, direct supply assurance, and regional manufacturing footprints for restraint systems and electronics to protect SOP schedules and compliance testing timelines.
Competitive Landscape
The automotive safety system market features moderate consolidation led by Bosch, Continental, ZF, and Autoliv, each running global manufacturing and software-engineering hubs. Continental’s new Aumovio brand highlights its pivot to software-centric offerings, combining cameras, high-performance controllers, and cloud analytics into a unified package.[4] ZF merged its Active Safety and Chassis units into a single division, rolling out brake-by-wire on 5 million vehicles and delivering China’s inaugural steer-by-wire system for the Nio ET9. Autoliv collaborates with XPENG AEROHT to create dual-use restraint solutions for both road and low-altitude e-VTOL vehicles.
Semiconductor companies deepen their role. Qualcomm’s acquisition of Autotalks extends its V2X capabilities, embedding direct vehicle-to-infrastructure communication inside the Snapdragon Digital Chassis. Bosch works with Microsoft to infuse generative AI into automated-driving software development pipelines. Volkswagen’s Cariad and Bosch co-develop a Level-3 highway pilot for mass-production vehicles from 2026. Start-ups focused on in-cabin biometrics attract OEM pilots, while Aptiv showcases a modular ADAS stack tailored for commercial fleets that need quick retrofit in regional depots.
Cybersecurity expertise becomes a prerequisite as UN R155 mandates continuous monitoring of attack vectors across the connected vehicle. Suppliers invest in secure gateway architectures and intrusion-detection analytics to maintain homologation. Partnership models extend to cloud providers for safe over-the-air update pipelines, underscoring the convergence between information security and functional safety across the automotive safety system industry.
Automotive Safety Systems Industry Leaders
-
Continental AG
-
ZF Friedrichshafen AG
-
Magna International
-
Robert Bosch GmbH
-
Autoliv Inc.
- *Disclaimer: Major Players sorted in no particular order
Automotive Safety Systems Market Companies Covered in this Report
- Robert Bosch GmbH
- Continental AG
- ZF Friedrichshafen AG
- Autoliv Inc.
- Denso Corporation
- Aptiv PLC
- Magna International Inc.
- Joyson Safety Systems
- Mobileye N.V.
- Valeo SA
- Hitachi Astemo
- Hyundai Mobis
- NXP Semiconductors
- Infineon Technologies AG
- Texas Instruments Inc.
- Renesas Electronics Corp.
- Veoneer AB
- WABCO (ZF CV Systems)
- Bendix Commercial Vehicle Systems
- Lear Corporation (E-Systems)
Market Opportunities and Future Outlook
Opportunities are concentrated where regulation, software-defined vehicle architectures, and localization investments intersect. The July 2026 European Commission implementation step under the General Safety Regulation (GSR 2) expands mandated content for new registrations, including advanced emergency braking for pedestrians and cyclists and driver distraction warning. This raises baseline penetration for sensors, perception software, and in-cabin monitoring. In parallel, UNECE WP.29 progress on a global framework for fully autonomous driving systems in 2026 adds a clearer pathway for scalable safety validation packages that combine redundancy in sensing with software update governance.
Capacity additions and regional manufacturing upgrades create whitespace for localized supply, faster validation loops, and tailored feature bundling for OEM platforms and fleet retrofits. Autoliv expanded production capacity through Phase II of its Jiading plant in China (January 2026) and inaugurated an extension at its El Fahs facility in Tunisia for integrated steering wheel manufacturing (June 2026), while ZF LIFETEC started a 150 million euro expansion in Xi’an to increase hybrid inflator output (March 2026). These moves support higher availability of passive and active safety content near vehicle assembly hubs and align with OEM pressure to reduce supply risk for safety-critical components amid longer qualification cycles and evolving software compliance requirements.
Recent Industry Developments in Automotive Safety Systems Market
- May 2026: Magna was awarded a driver and occupant monitoring system (DMS/OMS) program with a European OEM, using mirror-based sensing as part of the vehicle architecture. This design consolidates interior sensing into an existing component to reduce packaging complexity and supports broader deployment of driver monitoring as safety protocols tighten.
- June 2025: Qualcomm acquired Autotalks to strengthen V2X communications within the Snapdragon Digital Chassis. The transaction deepens chipset-level integration of safety messaging and creates a more direct route for V2X to pair with ADAS stacks and fleet safety applications.
- May 2024: Continental Automotive and NOVOSENSE signed a memorandum of cooperation to co-develop automotive-grade sensor ICs for functional safety applications, including airbag triggers and battery monitoring. Co-development at the IC level improves access to qualified components for safety modules and helps suppliers manage re-validation burdens when electronics are redesigned for new vehicle platforms.
Automotive Safety Systems Market Report Scope and Research Methodology
Market Definition and Coverage
For this study, the automotive safety systems market covers revenue generated from vehicle safety features and related hardware that help prevent accidents or reduce injury severity, across passenger and commercial vehicles sold through OEM fitment and aftermarket channels.
Scope exclusions: Standalone insurance services, roadside assistance services, and pure software subscriptions that are not sold as part of a vehicle safety system are excluded.
Segments Covered in This Report
- By System Type
- Active Safety Systems
- Collision-Avoidance (AEB, FCW)
- Driver Monitoring & HMI Alerts
- Chassis Control (ESC, ABS)
- Passive Safety Systems
- Airbags (Frontal, Side, Curtain, Far-side)
- Seat-belt & Pretensioners
- Active Safety Systems
- By Technology Component
- Sensors
- Radar
- Camera
- LiDAR/Ultrasonic
- Control Units and Domain Controllers
- Software & Algorithms
- By End-User
- OEM Factory-Fit
- Aftermarket / Retrofit
- By Vehicle Type
- Passenger Cars
- Light Commercial Vehicles
- Heavy Commercial Vehicles & Buses
- By Propulsion
- Internal Combustion Engine (ICE)
- Battery-Electric Vehicles (BEV)
- Hybrid Electric Vehicle (HEV)
- Fuel-Cell Electric Vehicle (FCEV)
- By Geography
- North America
- United States
- Canada
- Rest of North America
- South America
- Brazil
- Argentina
- Rest of South America
- Europe
- Germany
- United Kingdom
- France
- Italy
- Russia
- Rest of Europe
- Asia-Pacific
- China
- Japan
- India
- South Korea
- Rest of Asia-Pacific
- Middle East and Africa
- Saudi Arabia
- United Arab Emirates
- Turkey
- South Africa
- Rest of Middle East and Africa
- North America
Data Sources, Market Sizing, and Validation
Desk Research
Desk research was used to set the backbone of the market model and to keep assumptions realistic before we spoke to industry participants. We relied on public road-safety and vehicle-parc references such as government transport safety agencies, vehicle registration and production statistics, and road fatality databases, along with international trade statistics where component flows helped sanity check demand.
We also reviewed technical and regulatory context from sources such as UNECE vehicle safety regulations, NCAP program publications, SAE technical papers, and patent databases to understand adoption timing for key systems and sensing stacks. Company filings, earnings decks, and press releases were used to track mix shifts between active and passive safety features, and to understand OEM fitment priorities by region. The sources listed above are illustrative, and many other public documents were also used for data collection, cross-checks, and clarification.
Primary Interviews and Surveys
Primary discussions were used to confirm what gets counted as a safety system sale, how pricing moves as sensing content increases, and how OEM and aftermarket shares differ by region. We spoke with component suppliers, system integrators, distribution partners, and informed buyers, so gaps from public sources could be closed and assumptions stress-tested for APAC, EMEA, and the Americas.
Distribution of primary research fieldwork respondents
| Company type | Respondent position | Region |
|---|---|---|
| Top tier: 29% | CXOs: 16% | APAC: 47% |
| Mid tier: 50% | Functional/Unit leaders: 29% | EMEA: 31% |
| Smaller Players: 21% | Managers: 55% | Americas: 22% |
Market-Sizing & Forecasting
Sizing starts with a top-down build that reconstructs demand from vehicle production and sales by region, and then applies system fitment rates and typical content per vehicle for core safety technologies. Once the demand pool is formed, pricing assumptions are applied using observed ASP ranges by system category and by channel (OEM versus aftermarket), and then totals are summed to arrive at the market value.
To keep the model grounded, we corroborate the top-down output with selective bottom-up approximations. This includes supplier revenue roll-ups for key safety sub-systems, sampled ASP times estimated unit shipments for sensors and control units, and channel checks on aftermarket replacement rates. Inputs that most affect the numbers include light-vehicle and commercial-vehicle production volumes, penetration of ADAS-related functions, airbag and seatbelt content per vehicle, sensor mix shifts (camera, radar, and LiDAR), and regulatory or NCAP-driven fitment timelines. When a sub-segment has thin public disclosure, gaps are handled through conservative ranges, then narrowed using interview feedback and cross-checked against vehicle platform launch cadence.
For forecasting, we mainly use scenario analysis supported by short time-series smoothing on vehicle output and fitment curves, since adoption often steps up around regulations and new model cycles. The forward view is adjusted only after penetration and ASP progression assumptions are confirmed as reasonable by primary respondents.
Data Validation & Update Cycle
Validation is done through triangulation across independent signals, so that no single dataset drives the final number. We run variance checks by region and by system type, and any outliers are reviewed against production shifts, regulation timing, and pricing movements before sign-off.
A second analyst reviews the logic, the math, and the reasonableness of key assumptions, and we re-contact respondents when a change in fitment rules, sensing content, or vehicle output can materially shift results. Reports are refreshed annually, and interim updates are made when major events occur, such as new safety mandates or sharp vehicle production changes. Before delivery, a final pass is completed to ensure clients receive the latest updated view.
Mordor Intelligence's Automotive Safety Systems Market Size Measured Against Other Published Estimates
Published market sizes for automotive safety systems often differ because the scope line is drawn differently, and because adoption and pricing assumptions are refreshed at different times. In this space, the biggest sources of variation usually come from what is counted inside active safety versus passive safety, whether OEM and aftermarket are both included, and how currency conversion timing is handled.
Some external estimates also fold adjacent telematics-only offerings and broader mobility safety services into the same total, which can inflate the value for the same year. In Mordor Intelligence, the total is limited to automotive safety systems sold into vehicles and replacement channels, and pricing is tied back to fitment and sensing-content progression that was rechecked through interviews before finalizing the market value.
Benchmark comparison
| Source | Market Size | Gaps in Research Methodology |
|---|---|---|
| Mordor Intelligence | USD 140.48 B (2025) | |
| Industry Research House A | USD 131.60 B (2025) | Uses a narrower system basket in its stated splits, and its 2025 value appears to rely more on prior-year ASP and unit-growth assumptions with fewer explicit checks for OEM versus aftermarket mix by region. |
| Global Research Publisher B | USD 154.05 B (2025) | Likely applies a broader safety definition and higher content-per-vehicle pricing progression, and it does not clearly state how it separates safety systems from adjacent electronics or service revenues in the base year. |
The spread across the three figures mainly comes down to scope choices and how fast penetration and ASP are assumed to rise as sensing content increases. By keeping the calculation traceable to vehicle output, fitment rates, and channel mix, the estimate stays practical to replicate and easier to reconcile when new regulation or production data is released.
Key Questions Answered in the Report
What is the current size of the automotive safety system market?
The market generated USD 151.79 billion in 2026 and is projected to reach nearly USD 223.61 billion by 2031.
Which system type leads revenue?
Active Safety Systems dominate with 66.62% share in 2025, reflecting regulatory pressure for collision-avoidance functions.
Why is LiDAR gaining momentum despite radar dominance?
LiDAR delivers higher depth accuracy for Level-3 autonomy, leading to an 8.49% CAGR that outpaces other components within the automotive safety system market.
How fast is the aftermarket for safety technology growing?
Retrofit solutions for fleets are expected to rise at an 8.55% CAGR as operators chase insurance savings and regulatory compliance.
Which region shows the strongest growth outlook?
South America leads with an 8.51% CAGR to 2031, supported by major OEM investments and harmonised safety standards.
What role do over-the-air updates play in vehicle safety?
OTA platforms allow automakers to fix vulnerabilities and add new safety features post-sale, aligning with UNECE R156 requirements and expanding recurring revenue opportunities.