
Market Overview
| Study Period | 2020 - 2031 |
|---|---|
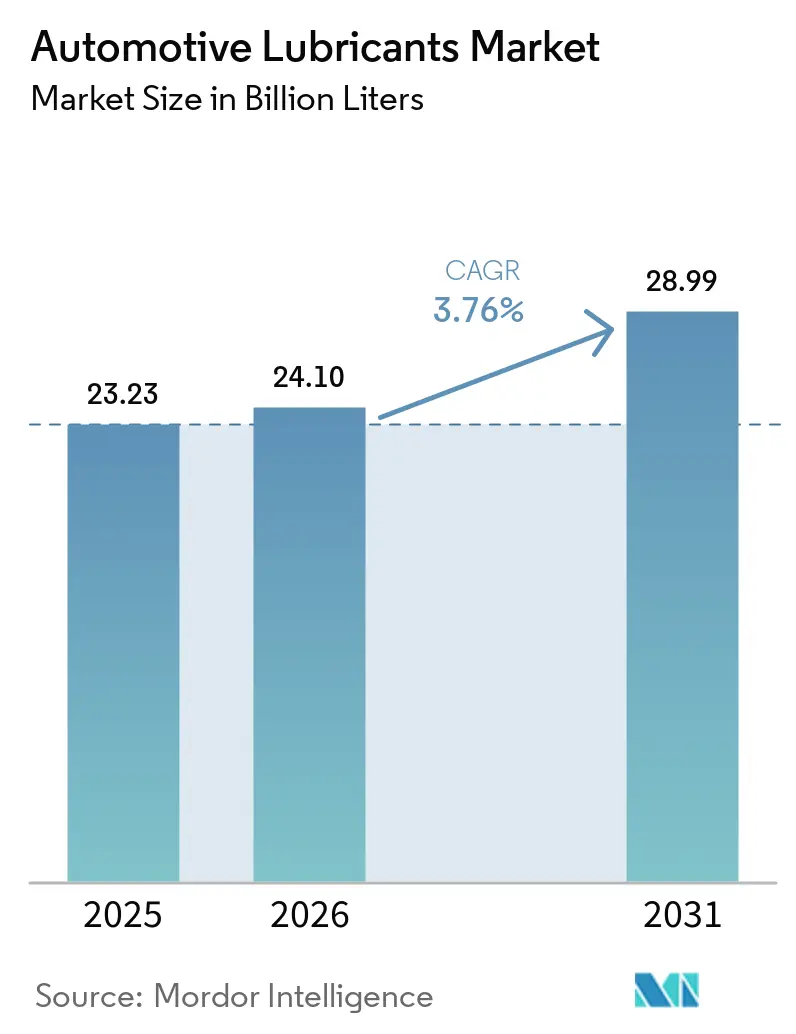
| Market Volume (2026) | 24.10 Billion liters |
| Market Volume (2031) | 28.99 Billion liters |
| Growth Rate (2026 - 2031) | 3.76 % |
| Fastest Growing Market | Asia Pacific |
| Largest Market | Asia Pacific |
| Market Concentration | Medium |
Major Players *Disclaimer: Major Players sorted in no particular order Image © Mordor Intelligence. Reuse requires attribution under CC BY 4.0. | |
Automotive Lubricants Market Analysis by Mordor Intelligence
The Automotive Lubricants Market size was valued at 23.23 billion liters in 2025 and estimated to grow from 24.1 billion liters in 2026 to reach 28.99 billion liters by 2031, at a CAGR of 3.76% during the forecast period (2026-2031). Growth is anchored by an aging global vehicle parc in developed regions, a steady influx of two-wheelers and commercial vehicles in emerging economies, and the sector’s pivot toward premium synthetics that improve fuel economy and extend drain intervals. Asia-Pacific remains the core demand center thanks to rising ownership levels and local manufacturing investments, while North America and Europe rely on vehicle longevity to sustain aftermarket sales. Competitive intensity stays moderate: Shell led for the 18th straight year in 2024, but regional blenders gain ground through local capacity additions and tailored formulations. Headwinds such as accelerating electric-vehicle (EV) penetration—31.4 million units on Chinese roads in 2024—and OEM-specified long-drain intervals are mitigated by the higher unit values of API SQ and similar low-viscosity synthetics.
Key Report Takeaways
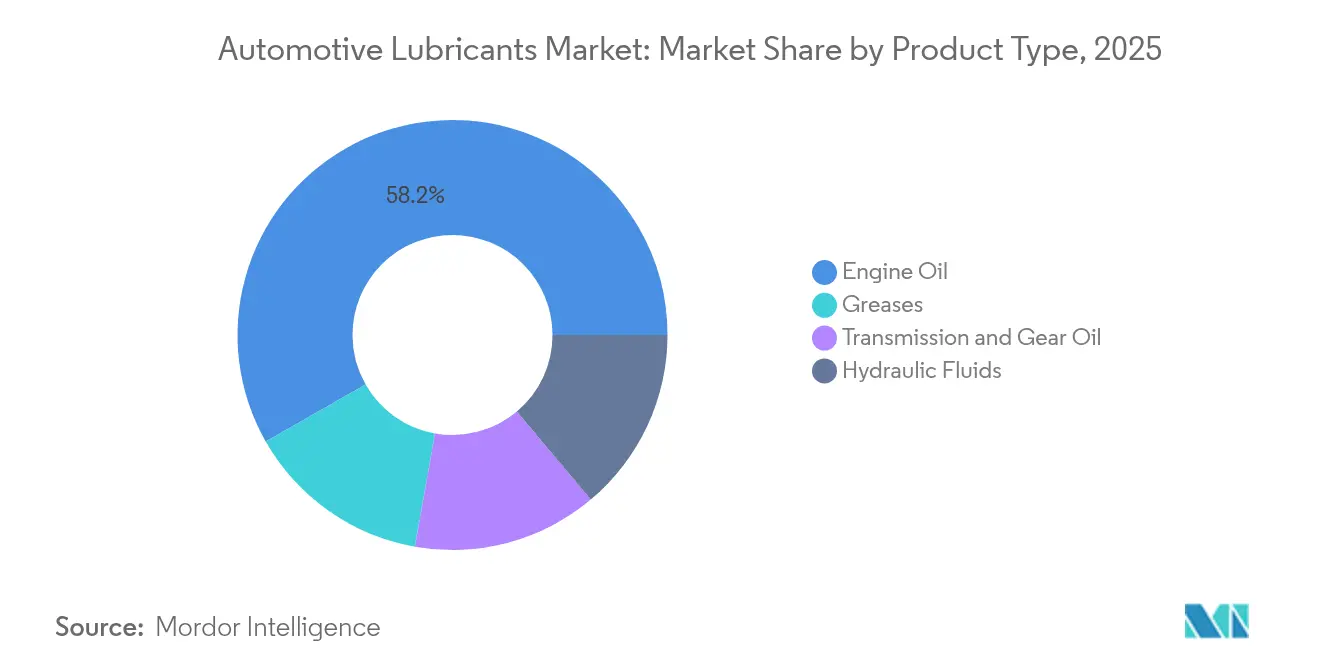
- By product type, engine oil led with 58.24% revenue share in 2025, while greases posted the fastest 4.12% CAGR through 2031.
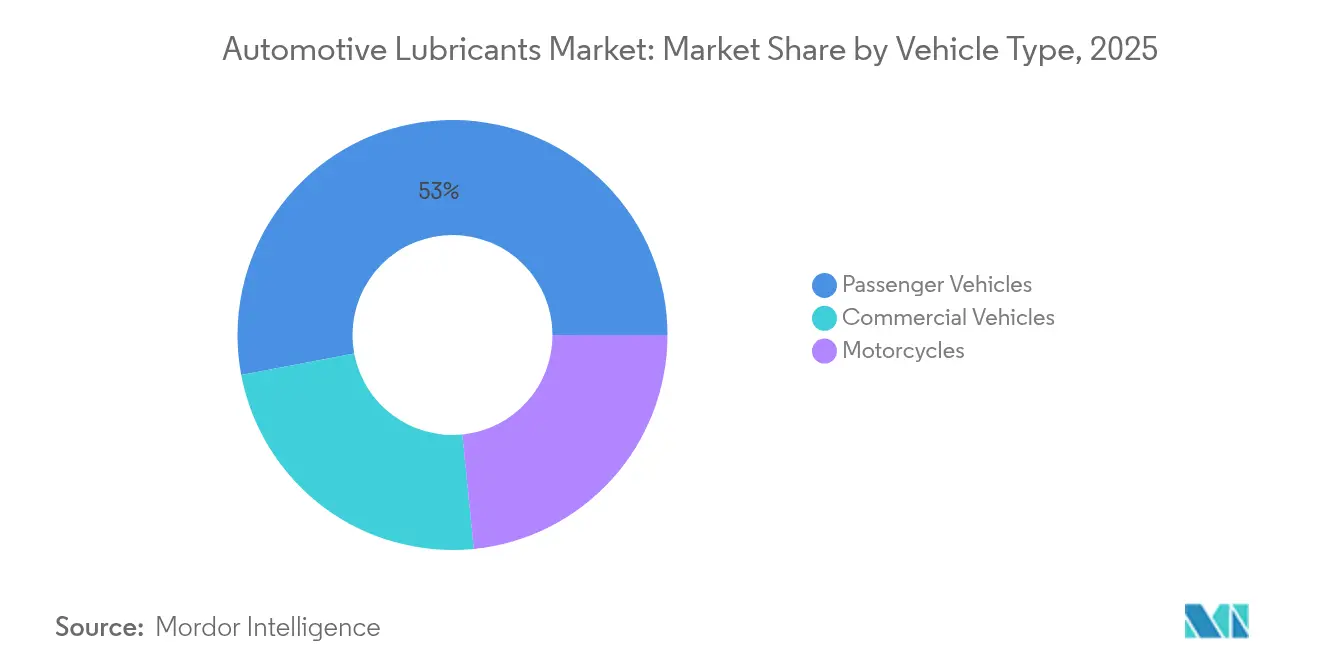
- By vehicle type, passenger vehicles held 52.97% of the automotive lubricants market share in 2025, whereas motorcycles recorded the highest projected 5.68% CAGR to 2031.
- By geography, Asia-Pacific accounted for 42.10% of the automotive lubricants market size in 2025 and is advancing at a 4.10% CAGR through 2031.
Note: Market size and forecast figures in this report are generated using Mordor Intelligence’s proprietary estimation framework, updated with the latest available data and insights as of 2026.
Market Trends and Insights
Drivers Impact Analysis of Automotive Lubricants Market*
| Driver | (~) % Impact on CAGR Forecast | Geographic Relevance | Impact Timeline |
|---|---|---|---|
| Growing average vehicle age in major economies | +0.80% | North America, Europe, developed APAC | Long term (≥ 4 years) |
| Rising global vehicle parc in emerging markets | +0.90% | APAC core, MEA, Latin America | Medium term (2-4 years) |
| OEM factory‐fill volume recovery post-pandemic | +0.70% | Global | Short term (≤ 2 years) |
| Rapid shift toward lower-viscosity synthetics | +1.20% | North America, Europe | Medium term (2-4 years) |
| Local blending investments in Africa and SE Asia | +0.60% | Sub-Saharan Africa, Southeast Asia | Long term (≥ 4 years) |
| Source: Mordor Intelligence | |||
Growing Average Vehicle Age in Major Economies
Vehicle longevity is reshaping lubricant demand profiles. Semiconductor shortages and inflation have slowed vehicle replacement rates in the US, prompting owners to increase oil-change frequency and invest in higher-quality synthetic oils. Europe’s fleet is even older—18.1 years in the West and 28.4 years in the East—driving more workshop visits and raising per-vehicle lubricant consumption. Older engines suffer seal degradation, thermal stress, and contamination, all of which accelerate oil degradation and spur demand for premium base stocks. Maintenance outlays for vehicles aged 6-15 years rose from USD 514 to USD 537 in just one year, underscoring the link between age and spend[1]. Scrappage has fallen to 4.20%, the lowest in two decades, prolonging aftermarket revenue streams. Higher-value synthetics now dominate service bays as owners seek extended protection and lower total cost of ownership.
Rising Global Vehicle Parc in Emerging Markets
Emerging economies offset EV-related volume erosion in mature markets. China’s motor-vehicle stock reached 453 million units, supported by 35.83 million new registrations in 2024. Two-wheeler ownership continues to surge in India and Southeast Asia, propelled by urban congestion relief and affordable mobility. Commercial fleets running e-commerce and last-mile delivery routes accumulate higher mileage, boosting drain-frequency multiples. Domestic automakers in these regions collaborate with local blenders, allowing agile development of cost-effective oils tailored to varied fuel quality and climate extremes. As a result, the automotive lubricants market keeps expanding even amid global moderation.
OEM Factory-Fill Volume Recovery Post-Pandemic
Automotive production rebounded in 2025 as chip supply stabilized and assembly lines returned to two-shift operations. The restart of Chevron’s Pascagoula base-oil unit removed a key bottleneck, easing additive shortages and restoring fill-rate norms. More than 90% of newly built vehicles now ship with fully synthetic factory fills to comply with emissions and warranty targets. API SQ entered force in March 2025, adding timing-chain wear metrics and low-speed pre-ignition defenses to the test slate. For suppliers, OEM recovery offers multi-year supply-agreement opportunities and positions synthetic blends for higher per-liter margins.
Local Blending Investments in Africa and SE Asia
Localization reduces freight costs, shortens lead times, and accommodates regional fuel chemistry. Shell tripled Thai grease output to 15,000 t, meeting over half of national demand while exporting to 40 Asia-Pacific markets. Vivo Energy extended Shell and Engen distribution across 23 African countries, adding carbon-neutral product lines such as Helix Ultra. TotalEnergies now operates 37 lube plants worldwide, using regional hubs to tailor additive packages for tropical climates. These moves align with government industrial-content policies and insulate suppliers from currency volatility.
Restraints Impact Analysis of Automotive Lubricants Market*
| Restraint | (~) % Impact on CAGR Forecast | Geographic Relevance | Impact Timeline |
|---|---|---|---|
| Accelerating EV penetration | -0.40% | Global, led by China and Europe | Medium term (2-4 years) |
| Counterfeit & adulterated engine oils | -0.30% | APAC, Africa | Short term (≤ 2 years) |
| OEM long-drain interval specifications | -0.30% | Global, heavy-duty | Long term (≥ 4 years) |
| Source: Mordor Intelligence | |||
Accelerating EV Penetration
EVs remove crankcase oils and many driveline fluids from service menus. China logged 31.4 million new-energy vehicles on its roads by end-2024, up 51.49% year-on-year. The IEA projects global stock could eclipse 250 million by 2030, cutting oil demand by up to 4.3 million bbl/d[2]. Nonetheless, EVs introduce new niches: esters for e-motor bearings, dielectric coolants, and gear greases optimized for high RPM and electromagnetic compatibility. For suppliers, the challenge shifts from volume to value as specialized fluids command two-to-three-fold price premiums over conventional engine oil.
OEM Long-Drain Interval Specifications
Detroit Diesel and comparable heavy-duty platforms now permit 75,000-mile oil intervals, with passenger cars commonly stretching to 7,500 miles on synthetics. Longer gaps reduce bulk sales but raise additive demand per liter to combat oxidation, soot, and rust. Studies caution that extended drains can spike abrasive wear if filtration is sub-optimal, posing warranty risks for fleets. Consequently, fleet managers weigh lower service frequency against potential maintenance surprises, sustaining interest in premium formulations.
*Our forecasts treat driver/restraint impacts as directional, not additive. The impact forecasts reflect baseline growth, mix effects, and variable interactions.
Automotive Lubricants Market Segment Analysis
By Product Type:
Engine-Oil Scale Meets Grease MomentumEngine oil held 58.24% of 2025 volumes, anchoring the automotive lubricants market through ubiquitous use in spark-ignition and compression-ignition engines. Larger sump capacities in light trucks and off-highway machinery amplify its share. Transmission fluids, hydraulic oils, and automotive gear oil serve narrower applications yet remain vital for manual boxes, wet brakes, and power-steering circuits. Greases, though just a fraction of the automotive lubricants market size, are the fastest riser at a 4.12% CAGR as EVs require dedicated bearing greases that handle high RPM and electrical pitting. Suppliers blend synthetic esters and polyurea thickeners to deliver conductivity control and thermal stability, elevating product mix value.
The segment’s revenue mix swings toward synthetics as API SQ-compliant oils gain traction. Ultra-low viscosity formulations such as 0W-16 and 0W-12 enable OEMs to meet fleet-average CO₂ targets, especially in Japan and Europe. Even within heavy-duty oils, the shift from 15W-40 to 5W-30 illustrates demand for thinner, high-HTHS blends that cut fuel costs. As viscosity grades narrow, additive packages diversify—boron esters, molybdenum disulfide, and ashless detergents become cornerstones in next-generation SKUs. The automotive lubricants market therefore balances declining unit volumes against richer per-unit margins.

By Vehicle Type:
Passenger-Car Scale Versus Two-Wheeler VelocityPassenger vehicles represented 52.97% of 2025 consumption, benefitting from their sheer numbers and routine oil-service cadence. Sedans and SUVs often feature direct-injection turbo engines that impose severe thermal loads, requiring high-performance dispersant and antioxidant chemistries. Commercial vehicles trail in population yet outsize their share of the automotive lubricants market size thanks to high sump capacities and annual mileage exceeding 100,000 km for long-haul tractors.
Motorcycles furnish growth momentum, expanding at 5.68% CAGR as urban gridlock and gig-economy delivery services proliferate across Asia-Pacific. Integrated engine-clutch-gearbox architectures mean lubricants must balance friction characteristics for wet clutches with oxidation stability for air-cooled engines. Product differentiation now includes JASO MB certified low-friction oils for scooters and high-performance MA2 grades for manual-gear bikes. With average drain intervals as low as 3,000 km, two-wheelers deliver high volume throughput relative to engine size, sustaining aftermarket revenues in populous nations such as India, Indonesia, and Vietnam.
Geography Analysis
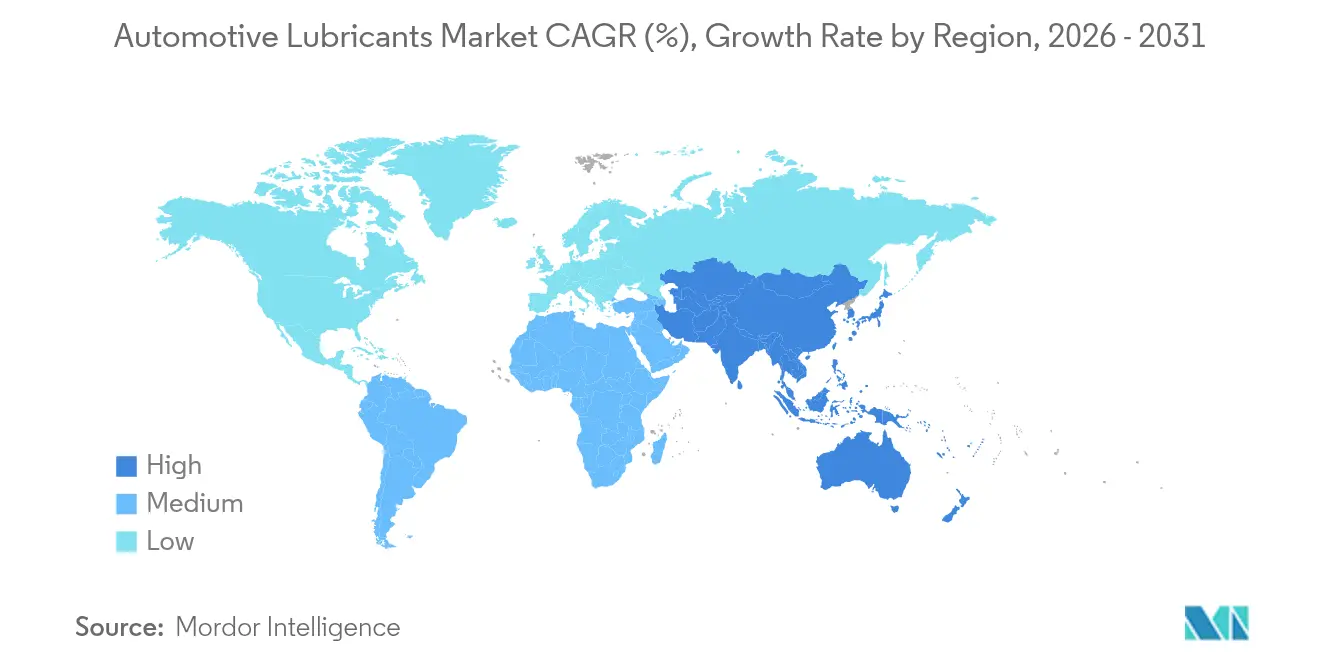
APAC Automotive Lubricants Market
Asia-Pacific dominated the automotive lubricants market with a 42.10% share in 2025 and is forecast to grow 4.10% per year through 2031. China alone hosts 453 million vehicles and recorded 35.83 million new registrations in 2024, pairing vast factory-fill demand with a colossal service marketplace. ASEAN governments nurture EV assembly hubs; Thailand’s Eastern Economic Corridor plans drove Shell to triple Thai grease capacity, ensuring regional supply resilience. Two-wheeler penetration surpasses 70% of households in Vietnam and Indonesia, bolstering motorcycle-oil volumes.
North America Automotive Lubricants Market
North America contributes to stable if modest growth. EV sales exceed 1.40 million units annually yet remain below 8% of in-service vehicles, preserving a sizeable internal-combustion fleet through 2030. OEMs emphasize API SQ synthetics with drain intervals topping 10,000 miles, prompting quick-lube chains to upgrade inventories to low-viscosity formulations.
Europe Automotive Lubricants Market
Europe’s 18-28 year car fleet sustains lubricant demand despite flat new-car registrations. The continent pioneers CO₂ cap compliance, spurring adoption of 0W-20 and 0W-16 oils backed by PSA, VW 508/509, and ACEA C6 specifications. Extended-service intervals of up to 30,000 km partially offset volume loss by encouraging premium-grade purchases.
MEA and South America Automotive Lubricants Market
The Middle East & Africa and South America jointly contribute a smaller share of the global volume today but deliver outsized upside. Vivo Energy’s branded-lube expansion across 23 African nations and Shell’s Raj Petro acquisition in India highlight a south-south competitive trend. Infrastructure build-out, agricultural mechanization, and mining projects generate demand for hydraulic fluids and heavy-duty engine oils resilient to dust and high ambient temperatures.
Value Chain Analysis
The automotive lubricants value chain starts with feedstocks and base oils, then moves through additive manufacturing and finished-lube blending to packaging, distribution, and retail or service delivery. Base oils (Groups I-III and synthetics) are supplied by integrated refiners and merchant suppliers, while additive technology is concentrated among major providers such as Lubrizol, Infineum, Afton Chemical, and Chevron Oronite. Finished-lube blenders span fully integrated majors (for example, Shell and ExxonMobil) and independent blenders that depend on third-party base oil and additive procurement, which makes contract terms, allocations, and technical approvals central to continuity of supply.
Downstream, packaged and bulk lubricants reach distributors, jobbers, quick-lube chains, workshops, dealerships (including OEM-branded service), and fleet maintenance networks. Recent tightness in premium base oils has underscored exposure to disruption risk across shipping lanes and ports, particularly for containerized packaging materials and flexibags. In May 2026, the Independent Lubricant Manufacturers Association (ILMA) flagged severe Group III supply shortages in the United States linked to Persian Gulf refinery damage and feedstock diversion toward diesel production, highlighting supplier diversification, regional blending footprints, and inventory management as differentiators for lubricant marketers.
Competitive Landscape
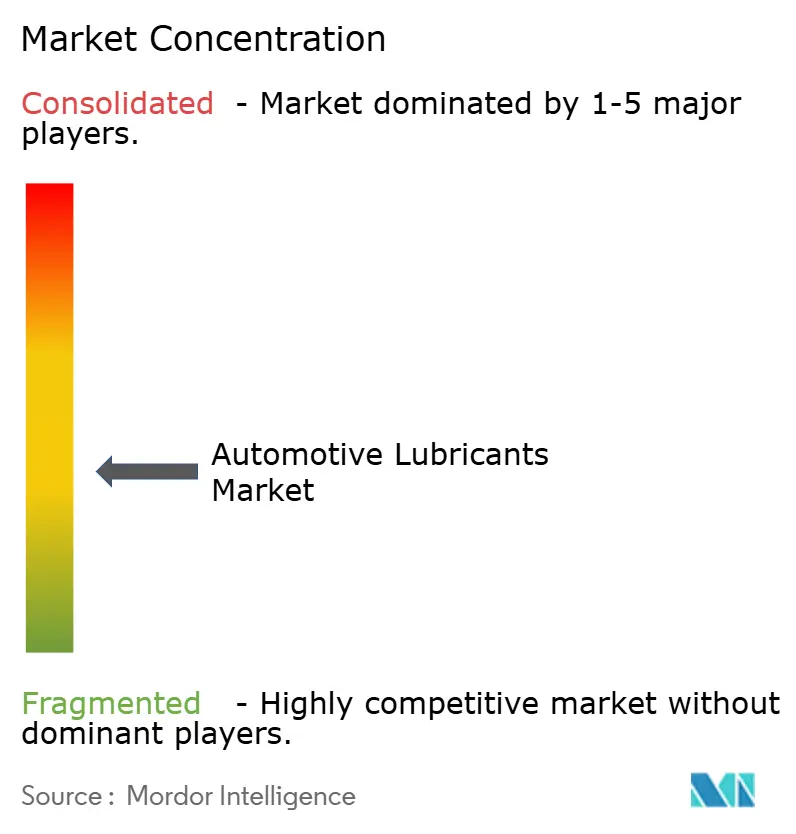
The automotive lubricants market remains moderately fragmented. The leading players are Shell, ExxonMobil, BP-Castrol, TotalEnergies, and Chevron. Saudi Aramco strengthened its downstream reach by acquiring Valvoline’s global products arm for USD 2.65 billion in April 2025, adding iconic brands and worldwide blending assets. Rumors of a BP-Castrol buyout illustrate ongoing portfolio realignment among national oil companies seeking branded retail exposure.
Technology is now the main battleground. API SQ, ILSAC GF-8, and ACEA 2025 standards raise the bar for oxidation and LSPI control, forcing additive houses such as Lubrizol and Infineum to field new friction modifiers and chain-wear suppressants. Competitors differentiate by proprietary base-oil chemistries: Group III+ hydrocracked stocks for mass-market synthetics and PAO-ester blends for ultra-premium lines. Local players thrive on agility—Indonesian and Kenyan fillers, for example, customize additive doses to match fuel sulfur content and climatic stress while undercutting multinationals on logistics cost.
Strategic moves center on supply-chain resilience and green branding. TotalEnergies released Quartz EV3R and Rubia EV3R lubricants derived from regenerated base oils, securing OEM approvals and aligning with circular-economy targets. Shell launched carbon-neutral variants certified under ISO 14067. As sustainability metrics become procurement criteria, players with lifecycle-assessment capabilities will win enterprise fleets and government contracts.
Automotive Lubricants Industry Leaders
-
BP p.l.c. (Castrol)
-
Chevron Corporation
-
Exxon Mobil Corporation
-
Shell plc
-
TotalEnergies
- *Disclaimer: Major Players sorted in no particular order
Automotive Lubricants Market Companies Covered in this Report
- AMSOIL Inc.
- Bharat Petroleum Corporation Limited
- BP p.l.c. (Castrol)
- Chevron Corporation
- China National Petroleum Corporation (CNPC)
- China Petroleum & Chemical Corporation
- ENEOS
- Exxon Mobil Corporation
- FUCHS
- Gazprom Neft PJSC
- Gulf Oil International Ltd
- Hindustan Petroleum Corporation Limited
- Idemitsu Kosan Co.,Ltd.
- Indian Oil Corporation Ltd
- Lukoil
- Motul
- Petrobras
- PETRONAS Lubricants International
- Phillips 66 Company
- PT Pertamina Lubricants
- Repsol
- Saudi Arabian Oil Co.
- Shell plc
- SK Lubricants Co. Ltd.
- TotalEnergies
- Veedol International
Market Opportunities and Future Outlook
Product and channel white space centers on premium, specification-led formulations and specialized fluids tied to mixed powertrains. API SQ enforcement (effective March 2025) lifts the technical baseline for mainstream engine oils and accelerates migration to low-viscosity synthetics, creating opportunities for additive-rich, OEM-aligned SKUs that help workshops and distributors manage fewer, higher-performing grades. As electrification progresses, volume displacement in crankcase oils is paired with higher-value needs in e-motor greases, gear oils, and thermal management and dielectric coolant chemistries, creating space for suppliers that can validate performance across ICE, hybrid, and BEV requirements.
Supply resiliency and circularity are also current opportunity areas, shaped by tight availability of Group III base oils and by sustainability-driven procurement. In June 2026, PETRONAS Lubricants International rolled out an updated Syntium range meeting API SQ and ILSAC GF-7 across multiple markets (including Malaysia, Japan, Europe, China, Indonesia, and Thailand), indicating a broader addressable base for next-generation passenger-car oils. Capacity and localization initiatives support whitespace in faster-growing regions: Gulf Oil Lubricants India announced plans in June 2026 to increase manufacturing capacity by 70% by fiscal year 2027, while FUCHS inaugurated an expanded blending facility in Johannesburg in February 2025 with a more than 40% production-capacity increase, strengthening quicker fulfillment and region-tailored formulations in Africa.
Recent Industry Developments in Automotive Lubricants Market
- June 2026: PETRONAS Lubricants International launched an updated Syntium passenger-car lubricant range meeting API SQ and ILSAC GF-7, with rollout spanning Malaysia, Japan, Europe, China, Indonesia, and Thailand by year-end. The update broadens availability of next-generation, low-viscosity formulations aligned with tightening OEM and emissions-related requirements. It also raises competitive pressure on brands and workshops to stock higher-spec products as the category mix premiumizes.
- September 2025: ExxonMobil started up new manufacturing technology in Singapore, increasing Group II base stocks production capacity by 20,000 barrels per day, including EHC 340 MAX base stock. The added output strengthens regional supply optionality for blenders and marketers that depend on consistent Group II availability for passenger-vehicle and heavy-duty formulations. It also supports greater formulation flexibility as performance tests and OEM approvals proliferate.
- June 2024: TotalEnergies Lubrifiants introduced Quartz EV3R for passenger cars and Rubia EV3R for trucks, formulated using high-quality regenerated base oils and backed by approvals from several vehicle manufacturers. The launch expands commercialized options for circular-economy lubricants without changing the OEM validation pathway. It also increases pressure on competitors to develop credible regenerated and lower-footprint product lines for both retail and fleet channels.
Automotive Lubricants Market Report Scope and Research Methodology
Market Definition and Coverage
The automotive lubricants market is defined as lubricating fluids and greases used to reduce friction, cool, and protect parts in on-road vehicles during operation and maintenance, measured through lubricant consumption and replacement needs across major geographies.
Scope exclusions: This sizing excludes industrial lubricants and off-highway equipment lubricants, and it also excludes automotive coolants, brake fluids, and fuel additives.
Segments Covered in This Report
- By Product Type
- Engine Oil
- Transmission and Gear Oil
- Hydraulic Fluids
- Greases
- By Vehicle Type
- Passenger Vehicles
- Commercial Vehicles
- Motorcycles
- By Geography
- Asia-Pacific
- China
- India
- Japan
- South Korea
- Indonesia
- Thailand
- Malaysia
- Vietnam
- Rest of Asia-Pacific
- North America
- United States
- Canada
- Mexico
- Europe
- Germany
- United Kingdom
- France
- Italy
- Spain
- Nordic Countries
- Turkey
- Russia
- Rest of Europe
- South America
- Brazil
- Argentina
- Colombia
- Rest of South America
- Middle East and Africa
- Saudi Arabia
- United Arab Emirates
- Qatar
- Egypt
- Nigeria
- South Africa
- Rest of Middle East and Africa
- Asia-Pacific
Data Sources, Market Sizing, and Validation
Desk Research
Desk research was used to lock down the demand pool and the practical boundaries of what counts as automotive lubricant consumption by country and vehicle category. We relied on public and official sources such as transportation and vehicle registration statistics from government portals, energy and refinery throughput indicators from agencies such as the IEA and EIA, trade and customs statistics for base oils and additive flows, and technical standards and guidance from bodies such as API and ACEA.
Beyond the public series, we also reviewed company annual reports, investor presentations, and reputable press coverage to understand capacity moves, formulation shifts (like low-viscosity oils), and channel changes between OEM and aftermarket. Where necessary, paid subscriptions covering company financials and intelligence, patent databases, and lubricant-specific market information were used to cross-check directional trends and avoid relying on a single indicator. The sources named here are illustrative only, and many additional references were used for data collection, validation, and clarification during the study.
Primary Interviews and Surveys
Primary work was used to test assumptions that are difficult to read cleanly from public data, especially drain intervals, viscosity migration, and the split between passenger vehicles, commercial vehicles, and motorcycles across regions. We spoke with a mix of lubricant blenders, additive participants, distributors, workshop networks, and fleet and maintenance stakeholders, and then used those inputs to correct the model where desk signals were not aligning. Coverage was balanced across the main consuming regions so that country-level patterns, regulation-driven shifts, and channel dynamics could be checked consistently.
Distribution of primary research fieldwork respondents
| Company type | Respondent position | Region |
|---|---|---|
| Top tier: 26% | CXOs: 17% | APAC: 41% |
| Mid tier: 55% | Functional/Unit leaders: 24% | EMEA: 34% |
| Smaller Players: 19% | Managers: 59% | Americas: 25% |
Market-Sizing & Forecasting
Sizing was built using a top-down approach where the vehicle population and usage patterns were reconstructed by geography and then translated into lubricant demand through application-level consumption factors. In practice, the model starts from indicators such as vehicle parc and new vehicle sales, average annual mileage, oil sump sizes and typical drain intervals, and then adds adjustment factors for climate, driving conditions, and compliance with newer engine-oil specifications.
Once the demand pool was established, results were corroborated with selective bottom-up approximations, including sampled price per liter by product type and channel, supplier and distributor sense checks on volume movement, and workshop-level consumption patterns. Where gaps existed in country data, we filled them with proxy ratios taken from similar vehicle fleets and service practices, then corrected them through interview feedback so the final totals stayed realistic. Forecasting relied on scenario analysis anchored on expected shifts in ICE versus EV mix, changes in average drain intervals, and base oil price direction, followed by country-level volume growth checks against vehicle parc and macro mobility trends.
Data Validation & Update Cycle
Model outputs were checked against independent signals such as regional lubricant consumption trends, reported capacity utilization changes, and movements in base oil and additive trade where relevant. When a country result looked out of line with vehicle parc growth or with the expected service cycle, the underlying assumptions were revisited, and targeted re-contacts were triggered to confirm whether the variance was real or model-driven.
Before sign-off, the work goes through multi-step analyst reviews, including consistency checks across product types and regions, followed by a final sanity pass on implied liters-per-vehicle and price progression. Reports are refreshed annually, and interim updates are made when material events occur, such as regulation changes affecting viscosity grades or major shifts in vehicle production. Right before delivery, a fresh review is done so clients receive the most current view available at that time.
Mordor Intelligence's Automotive Lubricants Market Size Compared Against Other Published Estimates
Published market sizes for automotive lubricants can look different even when they are discussing the same end use, because the scope boundary and the unit of measurement are not always aligned. Differences also show up when one estimate leans more on value assumptions, while another leans more on consumption volumes and replacement behavior.
By tracking liters by application and then refreshing price-per-liter assumptions by region and channel, Mordor Intelligence keeps the estimate tied to what vehicles actually consume, rather than blending in adjacent fluid categories or broad chemical baskets. A second common gap comes from how EV impact is treated, since some models apply aggressive volume declines to all engine-related lubricants without checking the pace of parc change and service norms country by country.
Benchmark comparison
| Source | Market Size | Gaps in Research Methodology |
|---|---|---|
| Mordor Intelligence | USD 23.23 B (2025) | |
| Global Consultancy A | USD 79.17 B (2025) | Uses a value-based frame with broader product coverage and a different inclusion set that may fold in fluids beyond lubricants, and it can also apply higher blended pricing across regions without channel-level checks. |
| Industry Publisher B | USD 76.79 B (2025) | Builds a wider automotive fluid basket and longer horizon assumptions, which can lift the 2025 value when multiple product groups and broader grade definitions are grouped together. |
The spread in the table is mainly explained by scope and unit choices, followed by how pricing is blended across product types and channels. Our approach is meant to be repeatable by country because the demand pool is built from vehicle and service indicators first, and pricing is used as a controlled layer rather than the starting point.
Key Questions Answered in the Report
How big is the automotive lubricants market today?
Global demand reached 24.1 billion liters in 2026 and is projected at 28.99 billion liters by 2031, reflecting a 3.76% CAGR.
Which region consumes the most lubricants?
Asia-Pacific accounted for 42.10% of global volume in 2025 thanks to its vast vehicle parc and rising ownership rates.
What product segment dominates sales?
Engine oil remained the largest slice with 58.24% share in 2025 because every combustion-engine vehicle requires regular oil changes.
Are electric vehicles a major threat to lubricant demand?
EVs reduce engine-oil volume but create high-value niches for e-motor greases and dielectric coolants, limiting the net decline.
What standards shape product innovation?
The API SQ category, effective 2025, drives development of ultra-low viscosity synthetics that boost fuel economy by up to 8%.