
Automotive Lithium Ion Battery Market Size and Share
Market Overview
| Study Period | 2021 - 2031 |
|---|---|
| Market Size (2026) | USD 75.05 Billion |
| Market Size (2031) | USD 164.21 Billion |
| Growth Rate (2026 - 2031) | 16.95 % |
| Fastest Growing Market | South America |
| Largest Market | Asia Pacific |
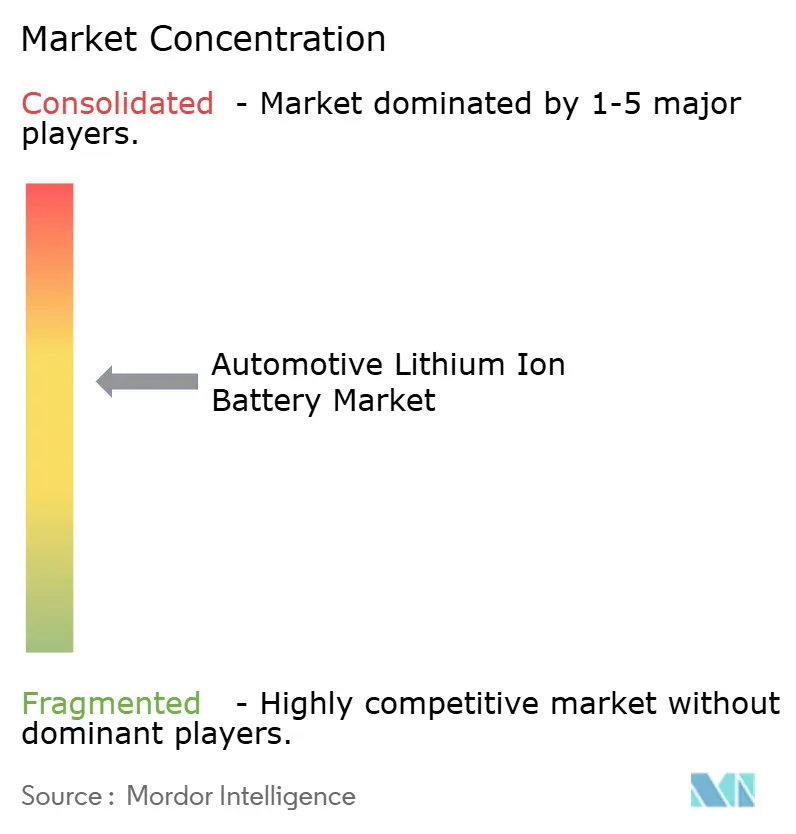
| Market Concentration | Medium |
Major Players *Disclaimer: Major Players sorted in no particular order Image © Mordor Intelligence. Reuse requires attribution under CC BY 4.0. | |
Automotive Lithium Ion Battery Market Analysis by Mordor Intelligence
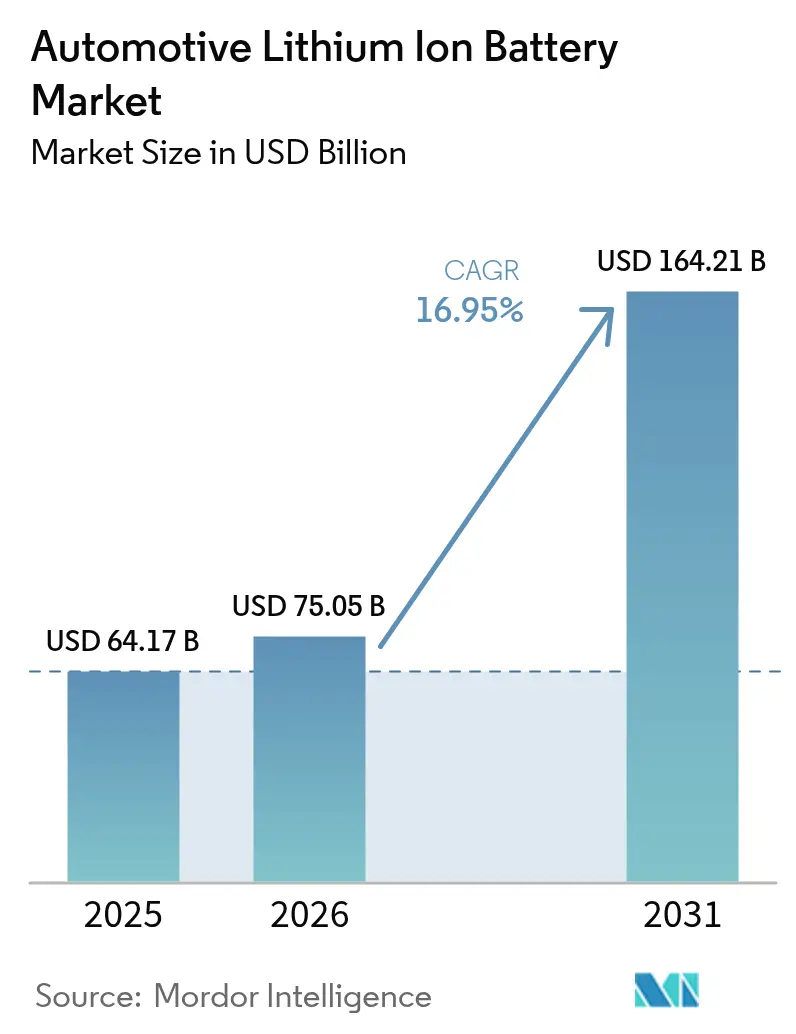
The Automotive Lithium-Ion Battery Market size in 2026 is estimated at USD 75.05 billion, growing from 2025 value of USD 64.17 billion with 2031 projections showing USD 164.21 billion, growing at 16.95% CAGR over 2026-2031. Regulatory pressures for zero-emission vehicles, an 89% drop in average pack costs since 2015, and gigafactory capacity additions drive EV expansion. In 2024, EVs accounted for over 20% of global light-duty vehicle sales, with battery demand now driven by policy compliance.[1] China's 80% share of global cell output accelerates cost deflation, while Western regions focus on supply-chain localization and technological competition in high-nickel and LMFP chemistries.
Key Report Takeaways
- By vehicle type, battery electric vehicles (BEVs) held 63.12% revenue share in 2025, BEV light commercial vehicles (LCVs) are projected to post a 34.20% CAGR through 2031.
- By channel sales type, original equipment manufacturers (OEMs) controlled 80.94% of the automotive lithium-ion battery market size in 2025, whereas the aftermarket is expanding at a 31.75% CAGR.
- By battery chemistry, lithium iron phosphate (LFP) led 44.75% of the automotive lithium-ion battery market share in 2025, LMFP is the fastest-growing chemistry at a 30.95% CAGR.
- By cell format, prismatic cells dominated with a 38.35% share in 2025, while cylindrical formats recorded a 23.40% CAGR to 2031.
- By capacity range, 60-90 kWh packs captured 30.92% share of the automotive lithium-ion battery market size in 2025, packs above 90 kWh are growing at 26.10% CAGR.
- By geography, Asia-Pacific accounted for 48.10% share in 2025, South America is the fastest-growing region at 28.75% CAGR.
Note: Market size and forecast figures in this report are generated using Mordor Intelligence’s proprietary estimation framework, updated with the latest available data and insights as of 2026.
Market Trends and Insights
Drivers Impact Analysis of Automotive Lithium Ion Battery Market*
| Driver | (~) % Impact on CAGR Forecast | Geographic Relevance | Impact Timeline |
|---|---|---|---|
| Soaring global EV production mandates by 2030 | +4.2% | Global, with early gains in EU, China, California | Medium term (2-4 years) |
| Sharp cell-cost decline from high-nickel & LMFP chemistries | +3.8% | Global, spill-over to emerging markets | Short term (≤ 2 years) |
| IRA & EU Battery Regulation localisation incentives | +2.9% | North America & EU | Long term (≥ 4 years) |
| Gigafactory over-supply securing pack availability | +2.1% | North America & EU, APAC core | Medium term (2-4 years) |
| Vehicle-to-grid monetisation models for fleets | +1.8% | North America & EU, pilot programs in APAC | Long term (≥ 4 years) |
| OEM-led closed-loop recycling partnerships | +1.6% | Global, with early gains in developed markets | Long term (≥ 4 years) |
| Source: Mordor Intelligence | |||
Soaring Global EV Production Mandates by 2030
Regulations include the EU target of 100% zero-emission sales by 2035 and California’s requirement that 68% of new light-duty sales be zero-emission by 2030, locking in battery demand irrespective of economic cycles. Nearly 17 million EVs are expected to be sold worldwide in 2024, with China contributing 11 million units. Automakers have announced USD 1.2 trillion in electrification spending through 2030, anchoring long-term demand visibility. The resulting volume unlocks scale economies that accelerate further cost declines across the automotive lithium-ion battery market.
Sharp Cell-Cost Decline from High-Nickel & LMFP Chemistries
Average pack prices fell 14% year-on-year to about USD 152 per kWh in 2024. Chinese producers already quote sub-USD 100 per kWh for optimised LFP lines, enabling automakers to trim vehicle list prices by up to USD 6,000 on mid-range models.[2] High-nickel cathodes deliver 10% higher energy density, while LMFP blends cut material expense 20-30% against legacy NMC. Cost segmentation now creates a two-tier product stack: premium vehicles chase range with nickel-rich cathodes, whereas mass models choose LFP or LMFP for affordability. Announcements of 500 Wh/kg solid-state prototypes foreshadow a density-led pricing pivot that could reshape chemistry preferences by 2027.
Gigafactory Over-Supply Securing Pack Availability
Global cell capacity reached 894.4 GWh in 2024, versus far lower realised demand, pushing Chinese utilisation rates to 51.1%. Surplus output swings bargaining power to automakers, supports just-in-time inventory, and spurs rapid iteration on fast-charging and cycle-life features. Europe’s EUR 180 billion slate and the United States’ 1,100 GWh pipeline create redundancies that cushion geopolitical shocks. Excess supply intensifies price competition yet strains balance sheets at smaller firms, accelerating a shake-out that could leave fewer than 40 viable global battery manufacturers by 2025.
IRA & EU Battery Regulation Localisation Incentives
The US Inflation Reduction Act ties a USD 7,500 tax credit to 50% domestic battery content in 2024 and 100% by 2029. This rule has triggered USD 167 billion in North American cell investments and encouraged Korean suppliers to raise KRW 49.6 trillion in financing for regional plants. The EU Battery Regulation layers carbon-footprint disclosure and recycled-content thresholds that are easier to satisfy with nearby production. Trade barriers favour early movers in local gigafactory build-outs and penalise import-centric strategies, reshaping procurement playbooks across the automotive lithium-ion battery market.
Restraints Impact Analysis of Automotive Lithium Ion Battery Market*
| Restraint | (~) % Impact on CAGR Forecast | Geographic Relevance | Impact Timeline |
|---|---|---|---|
| Lithium carbonate spot-price volatility | -2.3% | Global, with acute impact on cost-sensitive markets | Short term (≤ 2 years) |
| Fire-safety recall costs hitting residual values | -1.8% | Global, with concentrated impact in mature markets | Medium term (2-4 years) |
| Slow-moving permitting for new raw-material mines | -1.4% | Global, with acute impact in developed markets | Long term (≥ 4 years) |
| Consumer concern over ethical cobalt sourcing | -0.9% | Global, with concentrated impact in developed markets | Medium term (2-4 years) |
| Source: Mordor Intelligence | |||
Lithium Carbonate Spot-Price Volatility
Prices collapsed 90% from highs of USD 80,000 per tonne to around USD 13,000 in 2024 amid oversupply from new Australian and Chilean mines. Volatility complicates budget planning for non-integrated cell makers and may defer expansion decisions. While oversupply persists, permitting delays and geopolitical risks could tighten the market again by 2025. Vertically integrated firms like BYD, which hold upstream assets, remain insulated from these swings. Smaller producers without hedging capacity face margin risk and potential consolidation pressures.
Fire-Safety Recall Costs Hitting Residual Values
Battery-related vehicle recalls rose massively between 2018 and 2023, with incidents at Chevrolet, Hyundai, and Audi damaging consumer trust. Remedial actions cost USD 10,000-15,000 per vehicle and erode used-EV resale prices. The US FMVSS 305a rule, effective February 2025, mandates common emergency-response guides that could lower future recall frequency but add compliance overhead. Insurers have responded with higher EV premiums, elevating total ownership costs in some markets. Early-generation packs bear the brunt, suggesting improved future reliability as thermal management protocols mature.
*Our forecasts treat driver/restraint impacts as directional, not additive. The impact forecasts reflect baseline growth, mix effects, and variable interactions.
Automotive Lithium Ion Battery Market Segment Analysis
By Vehicle Type:
BEVs Drive Market DominanceBEVs contributed 63.12% of 2025 revenue, confirming their status as the anchor segment of the automotive lithium-ion battery market. Commercial fleet adoption of BEV LCVs grows at 34.20% CAGR because mileage-intensive routes unlock fuel-savings payback sooner than consumer segments. Plug-in hybrids maintain a share in rural and developing regions where charging access lags, while conventional hybrids are a bridging technology. Amazon’s 100,000-unit Rivian order and FedEx fleet upgrades illustrate how corporate sustainability targets catalyse bulk procurement. Heavy-duty cycles from Tesla Semi and partnerships between Panasonic Energy and Harbinger Motors point to escalating demand for higher-capacity packs and robust thermal systems. Fleet electrification shortens replacement cycles, increasing future aftermarket volumes and deepening the automotive lithium-ion battery market footprint.
The long-haul commercial wave intensifies interest in megawatt-class charging and rugged cell chemistries. Suppliers that tailor prismatic or large-format cylindrical cells for rapid-charge durability position best for these requirements. Governments add momentum through urban emission zones that exclude diesel vans and trucks, making electric alternatives economically inevitable. This regulatory push reduces residual-value uncertainty, giving financiers confidence to underwrite fleet conversions. High-throughput logistics further drive predictive maintenance platforms that monitor pack health and schedule pre-emptive replacements, expanding service-based revenue pools within the automotive lithium-ion battery market.


By Channel Sales Type:
OEM Dominance with Aftermarket EmergenceOEMs generated 80.94% of 2025 battery revenue as new vehicle roll-outs dominated demand. The installed EV park, however, will trigger a pronounced shift once first-generation packs reach end-of-life. Aftermarket sales are growing 31.75% annually as early fleet operators face capacity fade. Independent service networks and recyclers are preparing diagnostic and refurbishment lines to capture value from modules deemed unfit for propulsion but still viable for stationary storage. Right-to-repair statutes in the EU and California force automakers to share diagnostic data, boosting competition in replacement and repurposing. Battery-as-a-Service platforms from NIO and CATL blur boundaries by decoupling pack ownership from vehicle ownership, opening subscription-based revenue streams.
Proprietary battery management software remains the largest barrier for third-party repairers. Secure data gateways and telematics integration are becoming competitive differentiators. Policy makers weighing circular-economy benefits may further open access, especially where battery imports and domestic recycling capacity remain low. Standardisation consortia working on module dimensions and communication protocols could accelerate the aftermarket shift. As these developments converge, the automotive lithium-ion battery market size linked to replacement and second-life use cases is set to expand rapidly through the next decade.
By Battery Chemistry:
LFP Gains Ground on Cost AdvantagesLFP packs delivered 44.75% of the automotive lithium-ion battery market share in 2025, driven by thermal stability and low raw-material expense. LMFP, blending manganese for greater voltage, records 30.95% CAGR by improving energy density without sacrificing cost or safety. Nickel-rich NMC and NCA variants retain leadership in premium models demanding maximum range, but their cobalt exposure sparks sustainability concerns and raises price sensitivity to metal volatility. General Motors plans to switch five of seven volume EVs to LFP, cutting sticker prices by USD 6,000 and broadening addressable demand. BYD’s 60 Ah solid-state prototype with 400 Wh/kg underscores the impending pivot toward solid-state, although commercial rollout is unlikely before 2027.
Chemistry choice now reflects total-cost optimisation rather than headline performance. Regulatory lifecycles force automakers to balance recyclability mandates against raw-material sourcing risk. LMFP offers the best compromise for mainstream segments because manganese is abundant and less geopolitically concentrated than nickel. Suppliers who can scale LMFP cathode production quickly may shape the next competitive frontier of the automotive lithium-ion battery market.
By Cell Format:
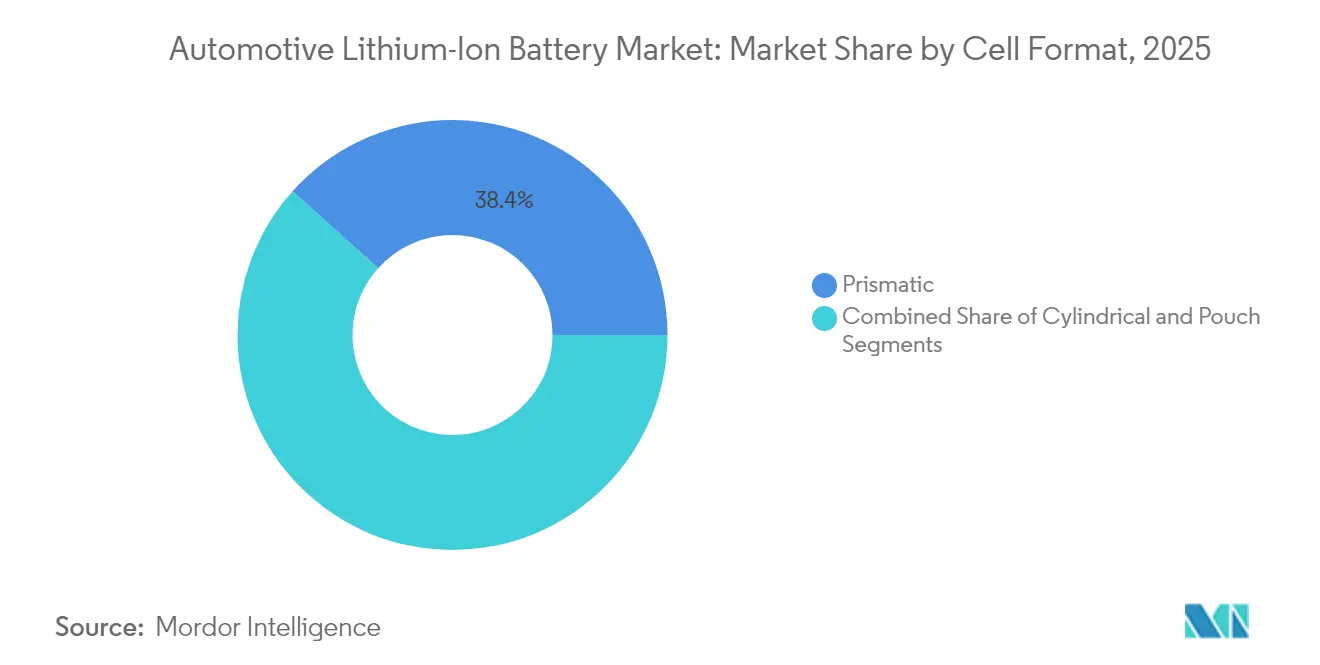
Prismatic Cells Lead Manufacturing EfficiencyPrismatic cells captured a 38.35% share in 2025 thanks to efficient stacking, compact pack geometry, and easier thermal pathways. Cylindrical designs, led by Tesla’s 4680 and Panasonic Energy’s expansion, grow at 23.40% CAGR on the promise of higher throughput and improved mechanical stability. Pouch cells remain relevant where flexible packaging is paramount, though their moisture sensitivity raises processing costs. European gigafactories increasingly favour prismatic layouts to streamline cell-to-pack assembly, with Volkswagen targeting 80% prismatic adoption by 2030. Korean leaders LG Energy Solution, Samsung SDI, and SK On revived prismatic lines, pushing that format to 49% of Europe’s cell supply in 2023.
Cell-to-pack integration trends reward larger-format options that remove module housings and maximise volumetric efficiency. Automation-friendly straight-line stacking reduces capex per gigawatt-hour, a crucial factor as overcapacity pressures margins. Cylindrical advances such as dry-electrode coating could narrow the cost gap. Format selection now intertwines with each OEM’s platform strategy, affecting supply-chain partnerships and geographic localisation decisions inside the automotive lithium-ion battery market.
By Capacity Range:
High-Capacity Packs Drive Premium SegmentsPacks rated 60-90 kWh accounted for 30.92% of 2025 revenue, offering the optimal range, cost, and charge time balance for most passenger models. Packs above 90 kWh post a 26.10% CAGR as luxury SUVs, pickup trucks, and heavy-duty commercial vehicles demand longer driving intervals. Sub-30 kWh designs serve micro-mobility and price-sensitive buyers, whereas 30-60 kWh caters to compact cars and plug-in hybrids. High-energy packs draw interest in solid-state because densification extends range without proportionally increasing mass or footprint. BYD’s Super e-platform, capable of 1 MW charging, illustrates how high-capacity packs combined with ultra-fast charging can achieve parity with gasoline refuelling time.
As charging networks grow, consumers shift range expectations upward, nudging automakers to fit larger batteries even on mid-range models. This move increases demand for advanced thermal management and more granular state-of-health monitoring to preserve warranty margins. Suppliers that deliver modular architectures adaptable across 30 kWh city cars to 200 kWh trucks stand to capture diversified volumes. These trends collectively expand the automotive lithium-ion battery market size tied to premium and commercial segments.
Geography Analysis
APAC Automotive Lithium Ion Battery Market
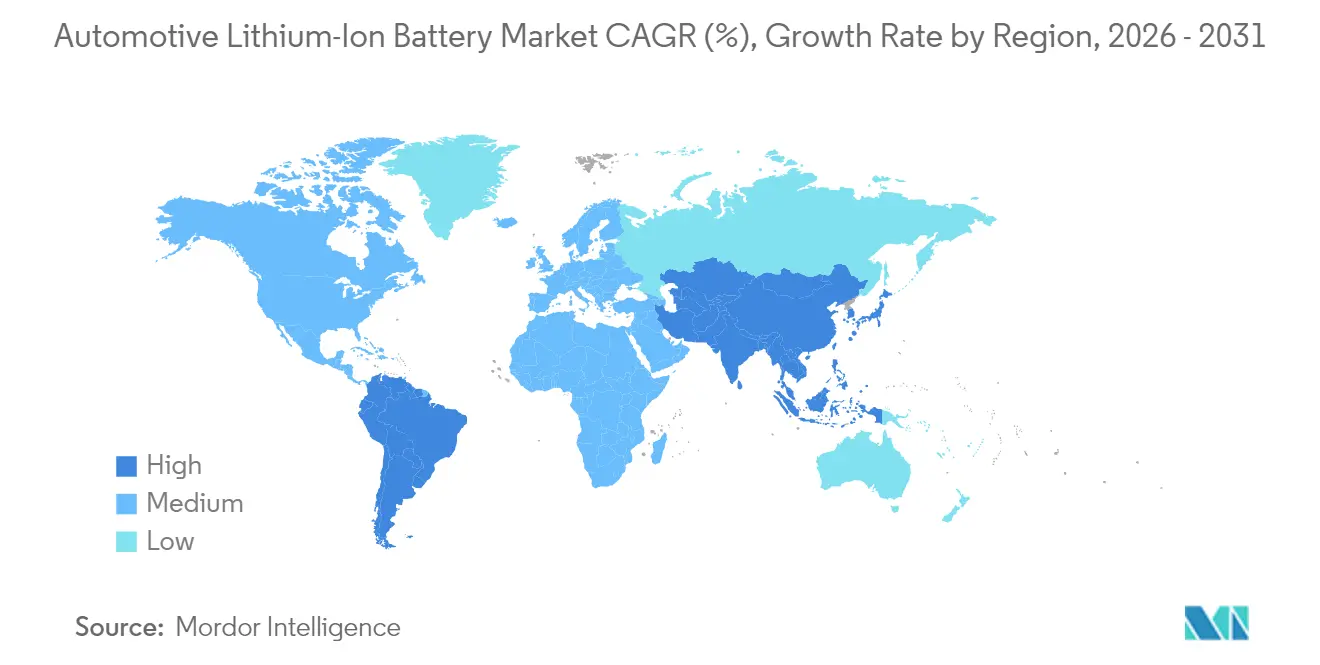
Asia-Pacific retained a 48.10% share in 2025, anchored by China’s dominance across cell production, precursor processing, and anode active material supply. Policy-driven domestic demand combines export-oriented gigafactory strategies, allowing regional producers like CATL and BYD to scale aggressively while hedging trade risks. Japan is repositioning through Panasonic Energy joint ventures with Subaru and Mazda, aiming to cut reliance on Chinese imports while preserving technology leadership. South Korea’s trio of LG Energy Solution, Samsung SDI, and SK On held 18.4% global share, bridging Chinese cost leadership and Western localisation needs.
South America Automotive Lithium Ion Battery Market
South America registers the fastest expansion at 28.75% CAGR. Brazil recorded 177,358 electrified sales in 2024, with BYD leading deliveries, highlighting how cost-competitive Chinese players penetrate value-conscious markets. Chile’s status as the second-largest lithium producer, coupled with favourable royalty frameworks, draws investment in local cathode and cell projects. The region’s electric bus fleets—BYD holds majority of the share—seed charging infrastructure and familiarise consumers with battery propulsion, reinforcing passenger-car adoption. Government programs like Brazil’s Mover initiative enforce stricter emission norms, providing a stable policy backdrop through 2030.
North America and EMEA Automotive Lithium Ion Battery Market
North America and Europe focus on cutting Chinese exposure while scaling home-grown factories. The United States’ Inflation Reduction Act fosters an automotive lithium-ion battery market size surplus by 2030, positioning the region as a potential exporter. Europe’s EUR 180 billion gigafactory roster targets self-sufficiency by 2026, though high energy tariffs and complex permitting slow ramp-ups. Emerging hubs in Morocco and the United Arab Emirates market renewable power advantages to attract cathode and pack investment, signalling that the automotive lithium-ion battery market will become increasingly multipolar.
Regulatory Landscape
Policy is increasingly separating into market-access rules (local content and sourcing) and sustainability rules (traceability and circularity). In the United States, the Inflation Reduction Act clean-vehicle credit has been tightening its critical-mineral sourcing thresholds, with the requirement reaching 70% of the value threshold in 2026, pushing OEMs and cell suppliers toward North American and free-trade partner supply chains.
In the European Union, Regulation (EU) 2023/1542 (EU Battery Regulation) sets sustainability, carbon-footprint disclosure, and due-diligence requirements that feed into battery passport-type compliance workflows. The timeline was adjusted by Regulation (EU) 2025/1561, which postpones due-diligence obligations for economic operators to 2027. China is also raising compliance intensity via national standards affecting automotive traction batteries, including the GB38031-2025 safety standard taking effect on July 1, 2026, and implementation of the traction-battery coding update GB/T 34014-2017/XG1-2026 starting August 1, 2026, increasing the need for standardized identification and compliance data exchange across the battery supply chain.
Value Chain Analysis
The automotive lithium-ion battery value chain runs from upstream critical minerals (lithium, nickel, cobalt, graphite) through refining and precursor production, cathode/anode active materials, separators and electrolytes, then cell manufacturing (cylindrical, prismatic, pouch). It continues through module/pack assembly with battery management systems and thermal components, followed by OEM integration and aftermarket services (diagnostics, refurbishment, second-life, recycling).
China remains highly concentrated across cell output and anode/cathode component manufacturing, creating structural dependence that many OEMs are managing via long-term offtake contracts and localized manufacturing footprints. Downstream, localization is accelerating through large joint ventures and direct OEM-supplier agreements. In North America, Hyundai-SK Battery Manufacturing America began commercial production at a 35 GWh facility in Georgia in July 2026, illustrating the shift to regional cell supply tied to vehicle assembly. In Europe, Hungary is becoming a central manufacturing node, supported by reported moves such as Samsung SDI positioning its Göd complex for Volkswagen Group supply under a standardized cell strategy, and by April 2026 a multi-year Mercedes-Benz and Samsung SDI supply agreement for high-nickel batteries, reinforcing multi-sourcing and format standardization as the link between materials constraints and OEM platform rollouts.
Competitive Landscape
The top five suppliers controlled roughly three-fifths of the 2024 revenue, producing a moderate concentration environment that still leaves space for specialists. CATL stayed in front and logged robust growth after locking multi-year supply deals with Tesla, Ford, and BMW. BYD deepened vertical integration by building batteries and vehicles, lifting its 2024 sales and squeezing margins for stand-alone makers. Korean firms LG Energy Solution, Samsung SDI, and SK On held almost one-fifth of the share but felt pricing pressure from Chinese cost leaders and a slower North American rebound.
Competition is shifting from sheer capacity builds to chemistry leadership and process efficiency as the automotive lithium-ion battery market matures. Samsung SDI targets commercial solid-state output by 2027, while LG Energy Solution pushes 46-series cylindrical cells for high-performance models. Patent filings for sulfide electrolytes, particularly by BYD, signal that intellectual property will decide future profit pools. Intensifying R&D spending raises barriers for smaller contenders, and fewer than 40 battery manufacturers are expected to stay viable by 2025. Consolidation pressures favour well-capitalised players able to spread research costs across multi-gigawatt-hour plants.
Geographic diversification now matches technology bets: CATL and BYD are adding factories in Hungary, Brazil, and Thailand to hedge tariff risk, while Samsung SDI is building a second United States plant to capture Inflation Reduction Act incentives for energy. White-space opportunities remain in commercial vehicles, stationary storage, and emerging economies where established brands hold limited footprints. The aftermarket rises at a robust clip as early EV fleets age, opening the door for independent refurbishers and recyclers. Disruptors such as StoreDot and QuantumScape work on silicon-rich anodes and solid-state cells but still need gigafactory partners to commercialise at scale, underscoring that advantage increasingly hinges on blending breakthrough science with industrial throughput.
Automotive Lithium Ion Battery Industry Leaders
-
Samsung SDI Co. Ltd.
-
CATL
-
BYD Co. Ltd.
-
LG Energy Solution
-
Panasonic Energy
- *Disclaimer: Major Players sorted in no particular order
Automotive Lithium Ion Battery Market Companies Covered in this Report
- Contemporary Amperex Technology (CATL)
- LG Energy Solution
- Panasonic Energy
- BYD Co. Ltd.
- Samsung SDI
- SK On
- CALB Group
- EVE Energy
- Farasis Energy
- Gotion High-Tech
- Envision AESC
- SVOLT Energy
- Tianjin Lishen
- GS Yuasa
- Toshiba Corp.
- Hitachi Astemo
- Optimum Nano
- Microvast
- StoreDot
- QuantumScape
Market Opportunities and Future Outlook
Localization and compliance-driven redesign are creating near-term whitespace in traceability, standardized labeling, and low-carbon manufacturing processes, since regulations now require auditable supply-chain data rather than only performance metrics. The EU Battery Regulation (EU) 2023/1542 is pushing sustainability and due-diligence workflows, with the due-diligence timeline shifted to 2027 by Regulation (EU) 2025/1561. China is also tightening safety and identification requirements with GB38031-2025 effective July 1, 2026 and the traction-battery coding update GB/T 34014-2017/XG1-2026 starting August 1, 2026. Together, these requirements expand demand for compliant pack architecture, battery identification systems, and supplier qualification programs that can operate across multiple geographies.
Capacity build-outs and strategic investments are also opening opportunities in regional supply, contract manufacturing, and chemistry diversification. Hyundai Motor Group and SK On commencing commercial production at a USD 5 billion, 35 GWh plant in Georgia in July 2026 highlights localization tied to North American EV assembly and incentive qualification. Samsung SDI’s long-horizon capital program (through 2040) splits scale production and R&D capability between Ulsan and Cheonan, supporting faster industrialization of next-generation cells. With global nameplate manufacturing capacity exceeding 4 TWh by end-2025, differentiation is shifting toward cost-down manufacturing, standardized cell formats, and closed-loop pathways (recycling partnerships and second-life channels), aligned with the report scope that excludes raw-material trading but includes traction packs/modules and OEM versus aftermarket demand.
Recent Industry Developments in Automotive Lithium Ion Battery Market
- July 2026: Samsung SDI disclosed a 25 trillion won capital investment program spanning 2026 to 2040, with production and R&D roles split between Ulsan and Cheonan. The plan enhances its ability to industrialize next-generation cell technologies while expanding manufacturing scale, supporting long-term supply commitments to global OEMs.
- June 2026: QuantumScape announced an agreement with Honda R&D Co., Ltd. focused on joint research into solid-state battery technology and related manufacturing processes. The partnership connects solid-state development work with an automotive OEM R&D pathway, tightening the link between cell innovation and vehicle-platform validation.
- February 2026: LG Energy Solution and Stellantis agreed that LG Energy Solution would acquire full ownership of their NextStar Energy joint venture. Consolidating ownership streamlines decision-making for capacity ramp, customer allocation, and incentive-aligned localization strategy in North America.
Automotive Lithium Ion Battery Market Report Scope and Research Methodology
Market Definition and Coverage
This market covers lithium-ion traction batteries used in road vehicles, counted as the value of packs, modules, and cells supplied for new automotive production and platform electrification across regions.
Scope exclusions: We exclude 12 V starter batteries, stationary energy storage systems, non-lithium battery chemistries, and raw material trading values.
Segments Covered in This Report
- By Vehicle Type
- Battery Electric Vehicle (BEV)
- Plug-in Hybrid Electric Vehicle (PHEV)
- Hybrid Electric Vehicle (HEV)
- Fuel-Cell Electric Vehicle (FCEV)
- By Channel Sales Type
- OEMs
- Aftermarket
- By Battery Chemistry
- NMC
- LFP
- NCA
- LMFP / LFMP
- LTO
- By Cell Format
- Cylindrical
- Prismatic
- Pouch
- By Capacity Range
- Less than 30 kWh
- 30–60 kWh
- 60–90 kWh
- More than 90 kWh
- By Geography
- North America
- United States
- Canada
- Rest of North America
- South America
- Brazil
- Chile
- Rest of South America
- Europe
- Germany
- France
- United Kingdom
- Norway
- Netherlands
- Rest of Europe
- Asia-Pacific
- China
- Japan
- South Korea
- India
- Rest of Asia-Pacific
- Middle East & Africa
- UAE
- Saudi Arabia
- South Africa
- Rest of Middle East & Africa
- North America
Data Sources, Market Sizing, and Validation
Desk Research
Desk work starts by mapping what drives demand for traction batteries, and then aligning those drivers with what can be tracked through public sources. We rely on official and non-paywalled references such as IEA EV outlook datasets, US DOE and Argonne battery publications, USGS minerals statistics (for lithium and related materials), Eurostat industrial and trade tables, and UN Comtrade for cross-border battery trade signals.
From there, the model is anchored using automaker annual reports, battery maker filings, investor presentations, and reputable press tracking of plant announcements and capacity ramps. When needed, paid subscriptions for company financials, patent databases, and an import-export shipment level database are used to fill gaps on who supplies what, and in which period. These examples are not exhaustive, and additional public sources are also used for collection, validation, and clarification.
Primary Interviews and Surveys
Primary work is used to confirm which battery formats are being adopted, how pricing is moving by chemistry, and how ramp schedules translate into shipped volumes. We speak with pack and cell suppliers, automotive OEM teams, and downstream integrators, and then we re-check inputs across APAC, EMEA, and the Americas to keep assumptions realistic by region.
Distribution of primary research fieldwork respondents
| Company type | Respondent position | Region |
|---|---|---|
| Top tier: 28% | CXOs: 16% | APAC: 46% |
| Mid tier: 54% | Functional/Unit leaders: 27% | EMEA: 35% |
| Smaller Players: 18% | Managers: 57% | Americas: 19% |
Market-Sizing & Forecasting
The core sizing uses a top-down demand reconstruction that starts from EV and hybrid production by region, then converts vehicles into battery demand using average pack size in kWh and penetration by powertrain type. Modeled kWh is then priced using year-specific average selling prices that reflect chemistry mix shifts and typical pack cost decline curves.
To keep totals grounded, we run selective bottom-up checks using supplier capacity ramps, sampled shipped volume disclosures, and channel checks on pack or cell pricing, which are then used to adjust outliers. Key inputs include vehicle production and sales trends for BEV, PHEV, and HEV, average kWh per vehicle by segment, share of LFP versus NMC type chemistries, utilization assumptions for announced gigafactories, and battery pack price per kWh movements over time.
Forecasts are built using scenario analysis, since policy support, raw material costs, and OEM launch timing can shift the curve in a short period. If a disclosed variable is missing for a country or vehicle class, we apply a proxy based on nearby markets with a similar platform mix, and then re-validate it through interviews before acceptance in the final series.
Data Validation & Update Cycle
Before finalizing, outputs are compared against independent signals such as regional EV registrations, public capacity commissioning schedules, and observed pack price ranges, and large variances are investigated. Checks are also performed for currency conversion timing, double counting between cells and packs, and unusual jumps that do not match known platform launch timelines.
A second analyst reviews the logic and the math, and sources are re-checked when an assumption drives a material share of the result. The report is refreshed annually, and interim updates are made when major events occur such as policy changes, large plant delays, or step changes in battery pricing. Prior to delivery, we do a final pass so the numbers reflect the latest available public information.
Mordor Intelligence's Automotive Li Ion Battery Market Estimate Compared With Other Published Estimates
Published market sizes often do not match because the counted value can change based on inclusions, which year is treated as the base, and how pricing is applied as chemistry and pack designs evolve.
The table shows a clear spread around the mid-decade market value, and in Mordor Intelligence's model the total is limited to traction lithium-ion batteries supplied to automotive applications, counted at pack or cell value without adding adjacent items like charging hardware or stationary storage, which changes the final USD total even if the EV volume outlook is similar.
Benchmark comparison
| Source | Market Size | Gaps in Research Methodology |
|---|---|---|
| Mordor Intelligence | USD 75.05 B (2026) | |
| Global Consultancy A | USD 92.40 B (2026) | Typically expands scope to include broader EV battery value capture such as full battery system integration premiums and, in some cases, adjacent electrification components, which inflates the priced demand pool. |
| Trade Journal B | USD 61.80 B (2026) | Often uses a conservative price-per-kWh curve and slower adoption assumptions for higher-kWh platforms, and may undercount commercial vehicles and regional capacity ramps that lift shipments. |
In practice, the biggest drivers behind the different totals are scope boundaries and how kWh is converted into dollars through ASP assumptions. By keeping the demand pool tied to vehicle production, pack sizing, and a transparent kWh-to-price logic, the estimate stays easier to trace and repeat when new capacity or pricing signals emerge.
Key Questions Answered in the Report
How large is the automotive lithium-ion battery market today?
The market is valued at USD 75.05 billion in 2026 and is forecast to reach USD 164.21 billion by 2031, growing at a 16.95% CAGR during 2026-2031.
Which region dominates automotive lithium-ion battery production?
Asia-Pacific holds 48.10% of 2025 revenue, with China responsible for roughly 80% of cell output.
What chemistry is growing fastest?
LMFP is advancing at a 30.95% CAGR because it balances energy density, safety, and cost advantages.
When will solid-state batteries reach mass production?
Leading suppliers such as Samsung SDI target commercial solid-state lines by 2027, with industry-wide adoption expected later in the decade.
Why are aftermarket batteries becoming important?
As the early EV fleet ages, replacement demand grows at 31.75% annually, creating new service and recycling opportunities.