
Market Overview
| Study Period | 2019 - 2031 |
|---|---|
| Market Size (2026) | USD 175.14 Billion |
| Market Size (2031) | USD 214.96 Billion |
| Growth Rate (2026 - 2031) | 4.18 % |
| Fastest Growing Market | Asia-Pacific |
| Largest Market | Asia-Pacific |
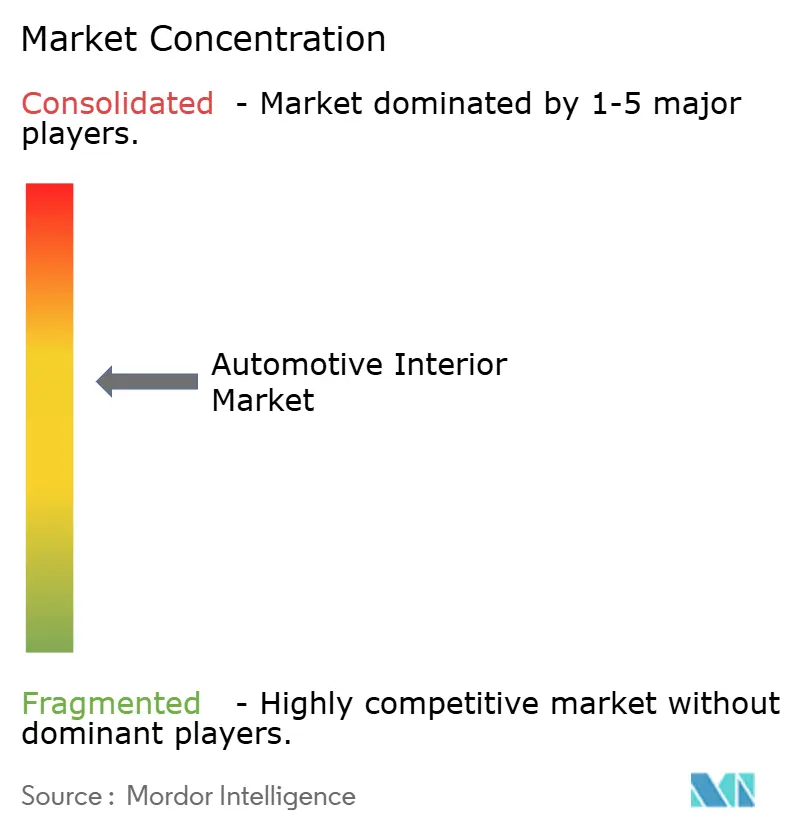
| Market Concentration | Medium |
Major Players *Disclaimer: Major Players sorted in no particular order Image © Mordor Intelligence. Reuse requires attribution under CC BY 4.0. | |
Automotive Interior Market Analysis by Mordor Intelligence
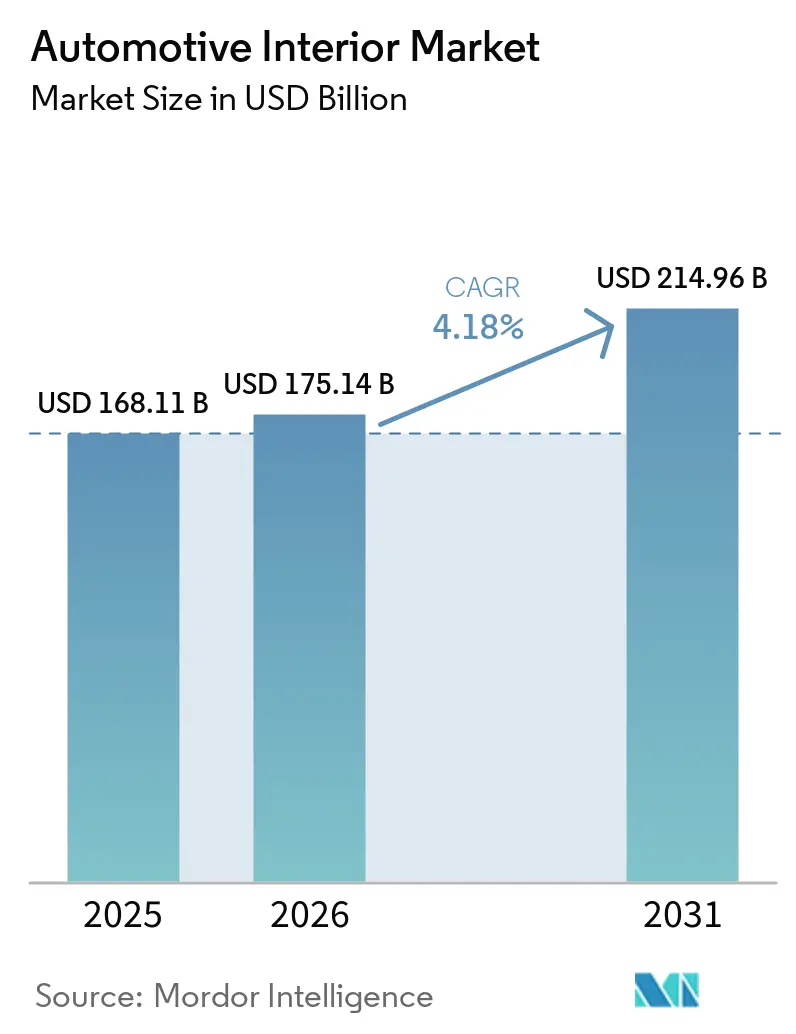
Automotive Interior Market size in 2026 is estimated at USD 175.14 billion, growing from 2025 value of USD 168.11 billion with 2031 projections showing USD 214.96 billion, growing at 4.18% CAGR over 2026-2031. This measured expansion conceals a more profound transformation as software-defined cockpits, biometric monitoring, and sustainable materials move from niche options to mainstream specifications. Automotive OEMs re-engineer cabin layouts around high-density displays and centralized compute units, while suppliers explore subscription revenue tied to over-the-air feature upgrades. Electric vehicle platforms add further content per car because silent cabins heighten the importance of premium surfaces, ambient lighting, and wellness features. The Asia-Pacific region already sets the pace for these upgrades, and its volume advantage encourages fast local iteration. Simultaneously, aftermarket demand stays resilient because fleet operators and retail owners keep refreshing worn trim with longer-life, digitally upgradable modules, dampening fears that shared mobility would erode replacement cycles.
Key Report Takeaways
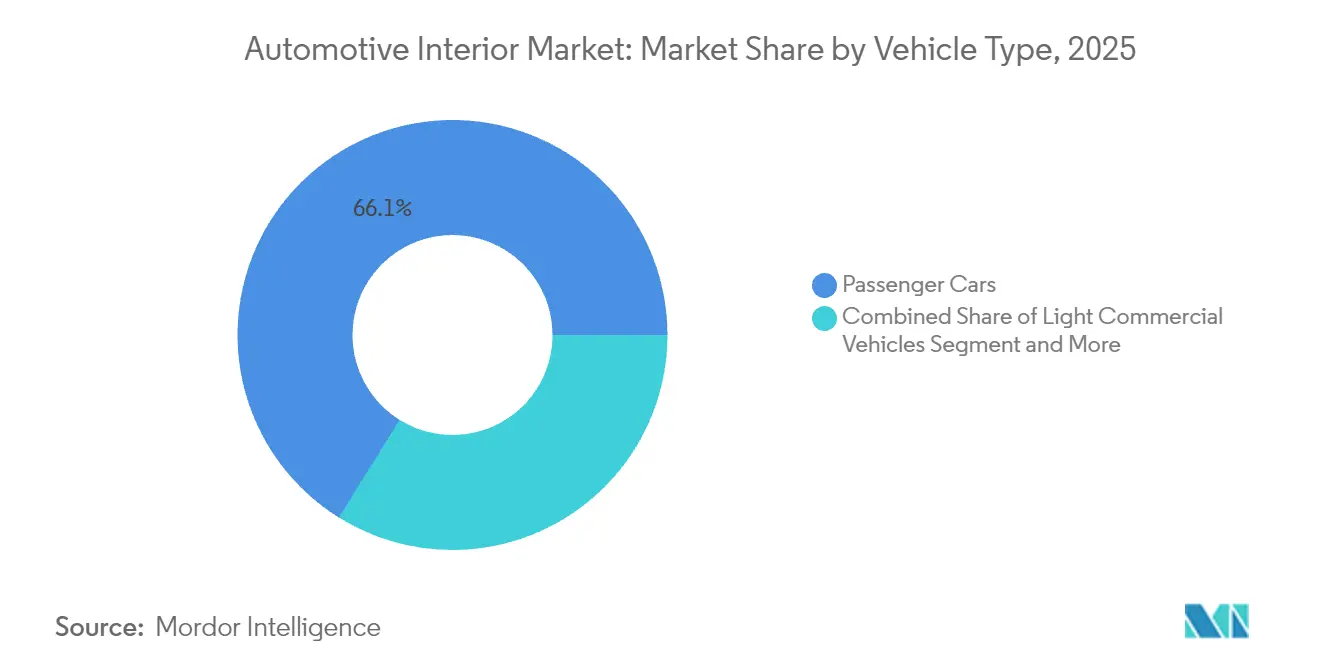
- By vehicle type, passenger cars accounted for 66.13% of the automotive interior market size in 2025, while electric passenger cars are projected to rise at a 4.21% CAGR to 2031.
- By propulsion, internal combustion engine vehicles held 72.47% automotive interior market share in 2025, whereas electric vehicles are forecast to post the fastest growth at a 4.27% CAGR through 2031.
- By component, seating systems captured 34.05% revenue share in 2025; driver and occupant monitoring systems hold the highest projected CAGR at 4.23% during the forecast period.
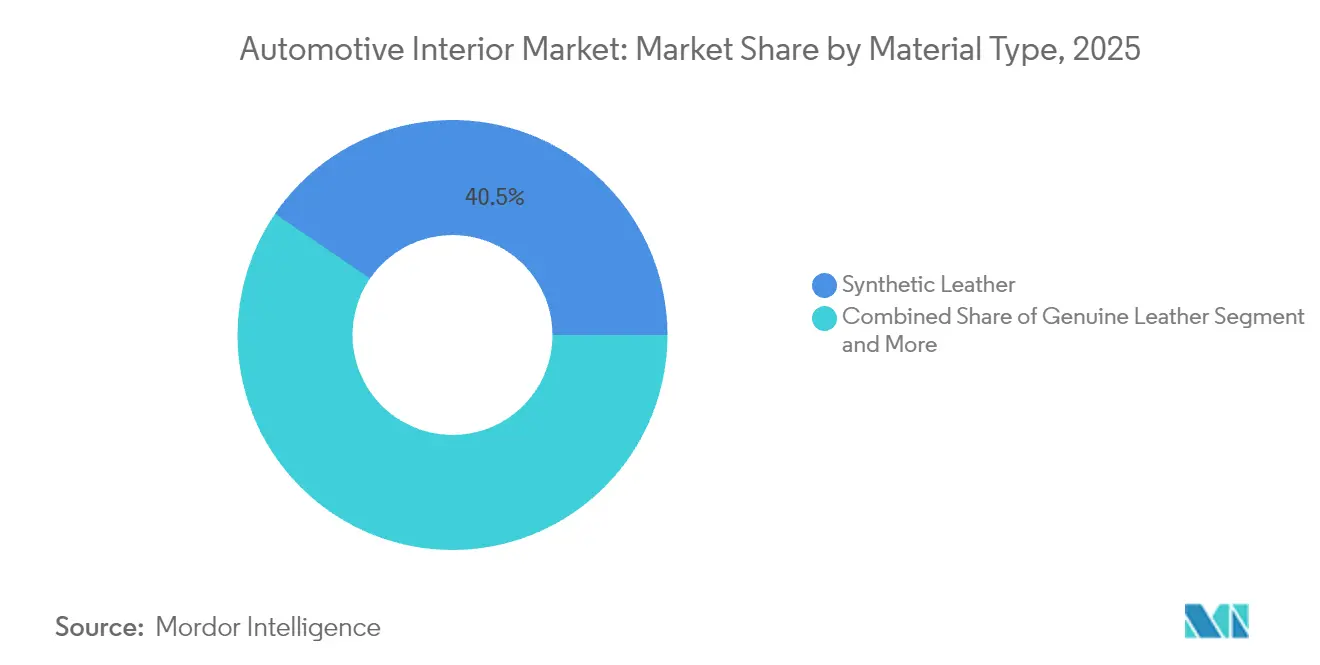
- By material, synthetic leather held 40.46% share of the automotive interior market size in 2025, whereas natural and recycled materials will advance at a 4.24% CAGR through 2031.
- By sales channel, the aftermarket segment commanded 72.77% of the automotive interior market size in 2025 and maintains a 4.29% CAGR outlook to 2031.
- By geography, Asia-Pacific led with 37.43% of automotive interior market share in 2025; the region is on track to expand at a 4.31% CAGR through 2031.
Note: Market size and forecast figures in this report are generated using Mordor Intelligence’s proprietary estimation framework, updated with the latest available data and insights as of 2026.
Market Trends and Insights
Drivers Impact Analysis of Automotive Interior Market*
| Driver | (~) % Impact on CAGR Forecast | Geographic Relevance | Impact Timeline |
|---|---|---|---|
| Shift Toward Software-Defined Vehicles | +0.8% | Global, led by North America and China | Medium term (2-4 years) |
| Rising Demand for Premium and Electric SUVs | +0.6% | Asia-Pacific core, spill-over to global | Short term (≤ 2 years) |
| Over-the-Air Upgradable Cockpit Architectures | +0.5% | North America and EU early adoption | Medium term (2-4 years) |
| Lightweight Sustainable Materials Mandated by OEM Carbon Targets | +0.4% | Global, EU regulatory leadership | Long term (≥ 4 years) |
| Adoption of In-Cabin Health, Safety | +0.3% | EU leadership, global adoption | Medium term (2-4 years) |
| Solid-State Ambient Lighting as a Brand Differentiator | +0.2% | Global, premium segments first | Short term (≤ 2 years) |
| Source: Mordor Intelligence | |||
Shift Toward Software-Defined Vehicles and HD Displays
Software-centric design decouples cabin functions from fixed hardware and allows continuous upgrades through secure over-the-air patches. Continental now delivers cockpit domains that host three or more ultra-high-resolution displays driven by processors exceeding 1,000 DMIPS [1]“Integrated High-Performance Cockpit Platforms,” Continental AG, continental-automotive.com. Qualcomm’s Snapdragon Digital Chassis powers numerous vehicle models and underscores how semiconductor players influence cabin electronics [2]“Snapdragon Digital Chassis Adoption Update,” Qualcomm Incorporated, qualcomm.com . Suppliers that integrate electronics, software, and user-experience design are increasingly monetizing new features long after initial vehicle production, transforming traditional cost-plus contracts into recurring revenue models that extend lifecycle value. Advanced interior sensor suites enable predictive maintenance, usage-based insurance, and personalized cabin experiences, creating additional revenue streams and strengthening customer engagement. Data collected from seating, infotainment, and occupant monitoring systems forms a shared backbone that supports ongoing software updates, over-the-air feature enhancements, and analytics services. This shift is encouraging collaboration between hardware-centric component manufacturers and digital technology firms to deliver seamless, connected experiences. Traditional component-only suppliers face the risk of revenue erosion if they fail to adapt, as their products alone no longer capture the full value of smart interiors.
Rising Demand for Premium and Electric SUVs in China and ASEAN
Electric premium SUVs sold in China carry an interior bill-of-materials roughly one-fifth higher than comparable ICE models, driven by features such as ambient lighting, multi-screen infotainment, and advanced occupant monitoring systems. Companies like NIO and XPeng have integrated biometric sensing even in mid-range trims, encouraging global suppliers to establish local production of advanced modules in Changzhou, Wuhan, and Rayong. Thailand’s rapidly expanding EV export base is drawing seat, trim, and cockpit suppliers into Southeast Asia, reducing lead times for Japanese, Korean, and Western OEMs that assemble vehicles in the region. ASEAN’s growing middle-income population increasingly considers the in-cabin experience when purchasing a first SUV, prompting local Tier-1 suppliers to invest in color, material, and finish studios near Bangkok and Ho Chi Minh City.
Over-the-Air Upgradable Cockpit Architectures
Stellantis equips the STLA Brain with centralized compute and secure gateways, enabling cabin features to refresh in minutes rather than during annual shop visits, significantly enhancing vehicle functionality and user experience. For suppliers, subscription-based tiers for seat massage patterns, ambient lighting themes, and advanced driver monitoring create lifetime revenue streams that scale with miles driven, transforming traditional hardware sales into recurring digital income. Warranty costs decline as remote diagnostics allow software faults to be addressed without part replacements, improving service efficiency and customer satisfaction. Hardware components must still meet stringent automotive-grade standards, prompting suppliers to invest in cybersecurity certification and compliance with ISO 21434. Although the upfront investment is high, early movers secure OEM partnerships across multiple program cycles, making switching costly and reinforcing long-term supplier lock-in.
Lightweight Sustainable Materials Mandated by OEM Carbon Targets
Automakers are committing to net-zero scopes and embedding these pledges into procurement rules that prioritize recycled or bio-based feedstocks, reshaping material sourcing strategies across the industry. BMW aims for 50% recycled plastic content in all new interiors by 2030, setting a benchmark for sustainable cabin design. Seat manufacturer Adient has partnered with multiple biomaterial startups to provide drop-in alternatives to traditional petrochemical foams, accelerating the adoption of sustainable materials. California’s latest vehicle standards mirror Europe’s circular-economy initiatives, offering North American suppliers comparable incentive signals to invest in eco-friendly production. Vendors that scale algae-based polyurethane or recycled PET fabrics are able to capture price premiums while securing long-duration contracts with OEMs focused on sustainability goals. Petrochemical incumbents face margin compression as they pursue compliance through expensive offsets or retrofitted materials.
Restraints Impact Analysis of Automotive Interior Market*
| Restraint | (~) % Impact on CAGR Forecast | Geographic Relevance | Impact Timeline |
|---|---|---|---|
| Persistent Chipset Shortages | -0.3% | Global, acute in Asia-Pacific | Short term (≤ 2 years) |
| Lower Refresh-Cycle in Shared-Mobility Fleets | -0.2% | North America and EU fleet markets | Medium term (2-4 years) |
| High Raw-Material Volatility | -0.2% | Global, EU regulatory complexity | Medium term (2-4 years) |
| IP- and Standards-Fragmentation | -0.1% | Global, acute in Android Automotive | Long term (≥ 4 years) |
| Source: Mordor Intelligence | |||
Persistent Chipset Shortages in the Infotainment Domain
Lead times for automotive-grade processors continue to range from 26 to 52 weeks, disrupting interior build schedules and forcing OEMs to prioritize safety controllers over infotainment head units. Tier-1 suppliers that implement chip-agnostic architectures are able to buffer some of this risk, but smaller players struggle to secure allocations against larger consumer electronics companies, limiting their production flexibility. Margins are further compressed as suppliers stockpile semiconductors at peak spot prices, tying up significant working capital and increasing financial pressure. In emerging markets, cost-sensitive OEMs are downgrading cabin specifications or postponing rollouts of multi-camera monitoring systems to manage procurement constraints. The shortage is also accelerating vertical integration, with companies such as Continental and ZF adding internal ASIC design capabilities to secure strategic components. Suppliers and OEMs are increasingly exploring alternative sourcing strategies, modular design approaches, and long-term contracts to mitigate ongoing disruption. Collectively, these dynamics are reshaping the economics, timelines, and design priorities for automotive interior suppliers worldwide.
High Raw-Material Volatility for PU and Bio-Based Polymers
Polyurethane foam costs rose by roughly one-fourth in 2024, reflecting parallel spikes in crude oil, while bio-based alternatives experienced even greater volatility due to crop-yield uncertainty. Seat and trim manufacturers hedge through futures contracts, but tier-2 suppliers often lack the scale to absorb price shocks or renegotiate terms with OEMs, leaving margins under pressure. This volatility complicates the transition to greener inputs, as bio-based material pricing depends heavily on corn, soybean, or sugarcane harvests, which fluctuate year to year. Suppliers with captive chemical divisions, such as Lear, report more stable gross profit due to integrated sourcing and risk mitigation. Smaller firms are exploring long-term indexed contracts or adopting multi-material designs that reduce polyurethane volume per seat, balancing sustainability goals with cost management.
*Our forecasts treat driver/restraint impacts as directional, not additive. The impact forecasts reflect baseline growth, mix effects, and variable interactions.
Automotive Interior Market Segment Analysis
By Vehicle Type:
Electric Premiumization Drives Content GrowthPassenger cars sustained 66.13% of overall revenue in 2025, showing the segment's scale advantage in the automotive interior market. Electric passenger cars represent the fastest growing slice at a 4.21% CAGR as higher in-cabin technology density lifts basket value per unit. The automotive interior market size for electric cars benefits from wide, flat floors that free up storage modules, lounge-style seating, and panoramic display surfaces. Light commercial vehicles track parcel delivery expansion, but cabin upgrades stay utilitarian, so growth stems mainly from mandated driver monitoring rather than luxury trim. Medium and heavy trucks remain sensitive to downtime; therefore, suppliers pitch durable fabrics and antimicrobial surfaces to fleet buyers.
The electrification wave lets suppliers insert wellness functions such as active noise cancellation and air ionizers that were previously cost-prohibitive. Tesla sparked minimalist layouts, yet legacy OEMs show there is still an appetite for robust switchgear coupled with multi-screen clusters. New EU rules that require inward-facing cameras on heavy trucks generate incremental demand for occupant monitoring kits. Over time, cabin differentiation shifts from mechanical craftsmanship to software-driven personalization that updates throughout the vehicle's life, extending aftermarket potential even in commercial fleets.


By Propulsion Type:
ICE Dominance Masks EV Growth TrajectoryInternal combustion vehicles still accounted for 72.47% revenue in 2025, anchoring volumes across the automotive interior market. Nonetheless, electric models grow 4.27% annually and dictate forward design language. Battery layouts remove transmission tunnels, so floor-mounted sensor pods and illuminated storage compartments gain prominence. The automotive interior market share for EV-specific components expands as low cabin noise raises occupant awareness of rattles and panel gaps, forcing tighter manufacturing tolerances. Hybrids serve as transition products and often bundle larger displays and premium fabrics to justify higher price tags despite modest pure-electric range.
EV architecture increases demand for real-time energy visualizations, prompting suppliers to reconfigure cluster graphics and center-stack UX to display charging data. Silence inside the cabin accentuates audio quality and encourages OEMs to specify higher wattage speakers and vibration-damping mats, further boosting content per car. Thermal management for battery longevity influences HVAC routing, giving suppliers experienced in dual-zone and tri-zone climate control a competitive edge.
By Component Type:
Monitoring Systems Eclipse Traditional PrioritiesSeating remained the single largest component group, representing 34.05% of the automotive interior market size in 2025 because every vehicle needs seats and most trims offer multiple upgrade packages. Yet driver and occupant monitoring units clocked the quickest 4.23% CAGR, powered by EU General Safety Regulation requirements and insurer discounts for cars with fatigue detection. Infotainment ranks second in value and benefits from centralized computing that supports six-year software roadmaps. Ambient lighting moves beyond aesthetics and now signals state-of-charge, navigation cues, and driver alerts.
Door and side-panel suppliers introduce lightweight foamed composites that integrate touch sensors. HVAC modules evolve toward individualized micro-climate bubbles with active pollen and particulate filtration. Upholstery makers embrace closed-loop recycling, recovering seat fabric when vehicles retire to salvage yards. The “other” bucket, mostly biometric and wellness modules, records double-digit share gains, from a low base, hinting at future mainstream adoption.
By Material Type:
Sustainability Mandates Reshape PreferencesSynthetic leather led at 40.46% revenue in 2025 due to cost-efficiency and a broad color palette. Genuine leather remains aspirational but feels pressure from vegan and carbon critiques. The automotive interior market size tied to natural and recycled inputs grows at a 4.24% CAGR because regulatory credits tilt bill-of-materials selection toward lower life-cycle emissions. Fabrics from recycled PET now meet durability specs once exclusive to PVC, narrowing performance gaps. Plastics houses retrofit extrusion lines to accommodate bio-PA and recycled PP, absorbing capex to stay on OEM sourcing lists.
Material sourcing evolves into a brand story that OEMs market directly to consumers, so traceability platforms map supply chains down to the plantation or refinery. Suppliers that manage full cradle-to-grave loops secure preferential nomination as carmakers expect end-of-life take-back. Cost premiums are gradually mitigated by scale and green-bond financing that funds capacity expansion of novel biomaterials.
By Sales Channel:
Aftermarket Resilience Defies Fleet PredictionsDespite ride-hailing and car-sharing narratives, the aftermarket held 72.77% revenue in 2025 and maintains a 4.29% CAGR outlook. Fleet managers stretch asset lives but demand rugged, serviceable trim; thus, suppliers focus on modular inserts that minimize downtime. OEM integrated channels yield higher per-unit margin but move more slowly in volume, keeping the aftermarket crucial for growth in the automotive interior market. E-commerce portals give small brands global reach, boosting competition.
Digitally upgradable hardware, such as seat controllers or ambient lighting drivers, enables owners to unlock features post-purchase, intertwining aftermarket and software revenue. Direct-to-consumer kits bundle plug-and-play wiring harnesses with cloud activation codes, lowering installation barriers. The channel mix underscores that physical wear, spills, and personal preference drive replacement even as ownership models evolve.
Geography Analysis
APAC Automotive Interior Market
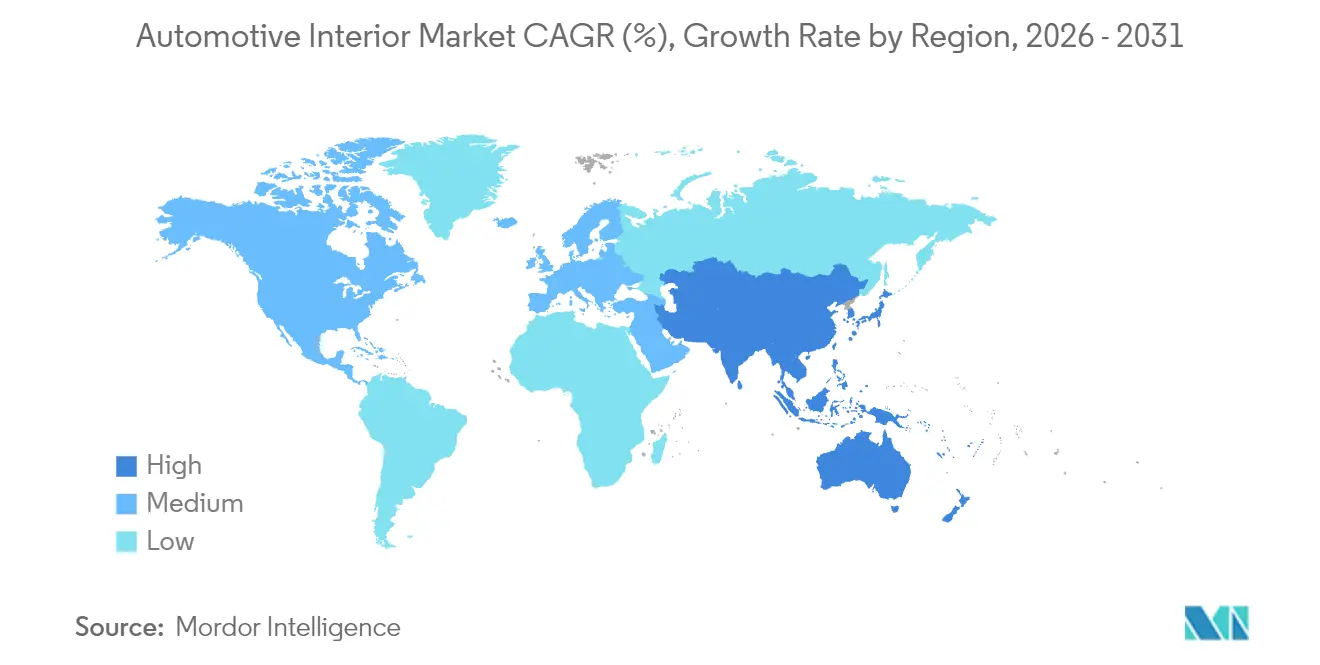
Asia-Pacific accounted for 37.43% of global automotive interior revenue in 2025 and is projected to grow at the fastest 4.31% CAGR through 2031. China’s domestic brands increasingly equip compact SUVs with multi-screen cockpits and wellness-oriented seating, driving higher average interior spend. Mainland production volumes, combined with regional free-trade zones, encourage suppliers such as Yanfeng and Magna to localize R&D and establish material labs near OEM design centers. Thailand’s growing EV assembly for export to Australia and the Middle East is catalyzing new Tier-2 clusters that supply seat frames, trims, and display systems, while Japan and South Korea leverage advanced sensor algorithms for occupant monitoring, often licensing software globally. Rising disposable incomes in Indonesia and Vietnam are also boosting demand for comfort and convenience features, sustaining growth despite macroeconomic fluctuations.
North America Automotive Interior Market
North America remains the second-largest revenue pool for automotive interiors. In the United States, expanding FMVSS driver-monitoring requirements are raising baseline sensor content across passenger cars and SUVs, while the popularity of pickups and SUVs increases cabin surface area, supporting high-margin upholstery and infotainment upgrades. Canada’s harsh winters drive additional features such as heated steering wheels and seats, further enlarging vehicle content. Mexico benefits from competitive labor costs and USMCA rules-of-origin, keeping interior manufacturing active for both regional sales and export volumes. OEMs in the region are also investing in modular designs and over-the-air update capabilities to enhance cabin functionality.
Europe Automotive Interior Market
Europe maintains moderate growth, supported by stringent green and safety mandates. The EU General Safety Regulation mandates passive driver monitoring for all new cars from 2026, guaranteeing steady demand for inward-facing cameras and sensor suites. Germany’s premium marques continue experimenting with high-resolution OLED clusters and recycled composite materials, while Eastern Europe provides cost-effective assembly options for volume models. Circularity requirements are pushing suppliers to implement closed-loop material flows, and supply-chain rerouting after Brexit presents opportunities for continental producers that can supply UK plants without tariff exposure. Collectively, regulatory, technological, and economic factors are shaping differentiated growth trajectories across the region, balancing innovation, sustainability, and cost efficiency.

Regulatory Landscape
Interior suppliers operate under a mix of safety, fire, and in-cabin material requirements that vary by region, making multi-standard validation a core part of program launches. In the United States, interior materials must meet FMVSS 302 flammability requirements (49 CFR 571.302), while NHTSA also updated FMVSS 208 via an interim final rule on occupant crash protection and seat belt reminder systems with an effective date in April 2026 and a further compliance milestone later in 2026.
Value Chain Analysis
The automotive interior value chain begins with upstream chemical, polymer, and textile producers supplying thermoplastics (for example TPO and ABS), polyurethane foams, specialty adhesives, and textiles, followed by Tier-2 and Tier-3 fabricators that convert inputs into subcomponents (covers, foam pads, frames, trim skins, lighting elements, and display-related parts). Tier-1 module integrators assemble cockpit modules, door panels, and seating systems and manage direct nomination and engineering interfaces with OEM purchasing and vehicle-platform teams; companies active as integrators or system suppliers include Grupo Antolin, Inteva Products, Tata AutoComp (Artifex interior systems), Zettl Group, and Hope Global.
Downstream logistics are dominated by just-in-time and just-in-sequence supply using sequencing centers near vehicle assembly plants to meet variant-heavy build schedules. Key constraints sit around tooling and validation, with long lead times for complex injection molds (often 12 to 18 months) and extended OEM validation and tooling cycles (commonly 18 to 36 months), which increase the cost of late design changes for display-heavy cockpits and multi-material trims. Persistent raw-material price volatility and semiconductor allocation for infotainment and monitoring electronics continue to pressure working capital and delivery performance, reinforcing supplier moves toward regionalized sourcing, dual-qualification of materials, and tighter integration of design, testing, and manufacturing near major OEM hubs.
Competitive Landscape
Global Tier-1 suppliers retain significant bargaining power due to their deep design integration, logistics scale, and decades-long OEM partnerships, with Adient, Lear, and Magna controlling roughly two-fifths of total automotive interior spend, reflecting a moderately concentrated market. Regional players such as Yanfeng and Hyundai Mobis leverage cost advantages and rapid development cycles to secure awards from Chinese and Korean OEMs, while software-native entrants increasingly collaborate with incumbents, licensing driver monitoring algorithms or ambient lighting controllers that overlay existing hardware. This dynamic underscores a market where scale, technological expertise, and strategic partnerships determine competitive positioning and influence the pace of innovation in automotive interiors.
Strategic moves in the automotive interior market are increasingly focused on vertical integration and the acquisition of digital capabilities, allowing suppliers to enhance both product functionality and innovation speed. Lear acquired embedded software boutiques to accelerate the rollout of ComfortMax seat intelligence features in collaboration with General Motors, integrating advanced sensors and user-experience software directly into seating systems. Similarly, FORVIA issued funding notes to support sustainable-material R&D and the development of modular cockpit platforms, reinforcing its ability to offer end-to-end interior solutions while meeting evolving OEM sustainability and technology requirements. These initiatives highlight a market trend where supplier consolidation, digitalization, and sustainability investment are central to maintaining competitive advantage [3]“Completion of Senior Notes Offering,” FORVIA SE, forvia.com .
In the current year, patent filings in interior technology surged, underscoring heightened competition, particularly in analytics and eco-materials. Startups face challenges due to stringent compliance requirements with ISO 26262 and ISO 21434, leading many to sidestep direct confrontations with established players. As a result, market differentiation is increasingly centered on software-driven experiences and validated sustainability, moving away from a sole emphasis on mechanical craftsmanship.
Automotive Interior Industry Leaders
Adient plc
Lear Corporation
Yanfeng Automotive Interiors
Magna International Inc.
FORVIA
- *Disclaimer: Major Players sorted in no particular order
Automotive Interior Market Companies Covered in this Report
- Adient plc
- FORVIA
- Lear Corporation
- Magna International Inc.
- Yanfeng Automotive Interiors
- Grupo Antolin
- Toyota Boshoku Corp.
- Hyundai Mobis Co.
- Panasonic Holdings Corp.
- Robert Bosch GmbH
- Continental AG
- DENSO Corp.
- Valeo SA
- JVCKENWOOD Corp.
- Pioneer Corp.
- Visteon Corp.
- Grammer AG
- Haartz Corporation
- Huayu Automotive Systems (HASCO)
- Seoyon E-Hwa

Market Opportunities and Future Outlook
EU circularity requirements for vehicle design and end-of-life management create a clear commercialization path for interior plastics and trim systems with verified recycled content and traceability. In June 2026, the Council of the European Union adopted a circularity-focused regulation that mandates minimum recycled plastic content thresholds over defined timelines, and it also sets up implementing acts (with a December 2026 deadline) to standardize how recycled plastic content is assessed and certified. This combination elevates opportunities for compounders and interior component suppliers that can deliver compliant, visibly finished recycled polymers and documentation-ready material chains, especially for high-volume parts such as instrument panel substrates, console components, door trims, and interior functional inserts.
China and India also show actionable whitespace around localized seating and integrated interior modules tied to fast-changing EV platforms and premiumization. In China, FORVIA-linked Faurecia began phased production of seat-frame systems in Jiaxing in May 2026 for customers including Leapmotor, Luxeed, and Chery, and FORVIA referenced an August 2026 start of production for complete car seat sets for Luxeed in Wuhu, indicating that localized seat systems and rapid industrialization are being prioritized for new-energy vehicle programs. In India, Uno Minda approved a greenfield investment (INR 320 crore) in July 2026 to enter four-wheeler passenger vehicle seating systems, signaling room for new capacity and supplier diversification beyond traditional seat incumbents as OEMs raise expectations for comfort, personalization, and material sustainability.
Recent Industry Developments in Automotive Interior Market
- August 2026: FORVIA started production of complete car seat sets for Luxeed in Wuhu, signaling an expansion of integrated seating solutions to support Luxeed's EV programs in China. This move expands capacity for high-volume interior modules and aligns with OEMs' move toward modular interior platforms.
- October 2025: Adient and Autoliv unveiled a dynamic seat safety solution concept that links seating architecture with restraint-system performance. The collaboration highlights a shift toward integrated occupant protection at the seat level, which can reshape how OEMs source seats, airbags, and related interior content as a combined module.
- November 2024: Adient signed a joint development agreement with Paslin Company to automate seating assembly lines, reducing costs and increasing customization throughput. The move supports higher variant complexity in seating programs and addresses efficiency and labor constraints in large-scale seat manufacturing.


Automotive Interior Market Report Scope and Research Methodology
Market Definition and Coverage
For this report, the automotive interior market covers the value of interior components and systems installed in passenger cars and commercial vehicles, including cockpit and cabin parts that directly shape comfort, safety, and the in-vehicle experience.
Scope exclusions: Exterior parts, under-the-hood components, and standalone vehicle electronics that are not part of the cabin are excluded.
Segments Covered in This Report
- By Vehicle Type
- Passenger Cars
- Light Commercial Vehicles
- Medium and Heavy Commercial Vehicles
- By Propulsion Type
- Internal-Combustion Engine (ICE)
- Electric Vehicle (EV)
- By Component Type
- Instrument Panels and Cockpit Modules
- Infotainment and Connected Displays
- Seating Systems
- Interior Lighting (Ambient, Functional)
- Door and Body Trim Panels
- HVAC and Thermal Comfort
- Upholstery and Surface Materials
- Driver / Occupant Monitoring Systems
- Other Components
- By Material Type
- Synthetic Leather (PU, PVC)
- Genuine Leather
- Fabrics and Textiles
- Plastics and Composites
- Natural and Recycled Materials
- By Sales Channel
- OEM
- Aftermarket
- By Geography
- North America
- United States
- Canada
- Rest of North America
- South America
- Brazil
- Argentina
- Rest of South America
- Europe
- Germany
- United Kingdom
- France
- Russia
- Rest of Europe
- Asia-Pacific
- China
- Japan
- India
- South Korea
- Rest of Asia-Pacific
- Middle-East and Africa
- United Arab Emirates
- Saudi Arabia
- Turkey
- Egypt
- South Africa
- Rest of Middle-East and Africa
- North America
Data Sources, Market Sizing, and Validation
Desk Research
We started with public data that explains how many vehicles are built and sold, and how interior content per vehicle changes over time. Common starting points included sources such as OICA vehicle production series, national transport and industry statistics, UN Comtrade trade flows for relevant interior materials and parts, and customs tariff schedules that help map what is inside the cabin.
Next, we used company filings, annual reports, investor presentations, association websites, and reputable press to track product mix shifts such as larger displays, more ambient lighting, and higher cabin material specs. A paid subscription for company financials and news was used selectively to cross-check revenue direction and major contract wins. We also referenced a patent database to sanity-check technology adoption timing (for example, cockpit integration and interior lighting features). The desk sources listed here are illustrative only, and additional public references were used for data collection, validation, and clarification.
Primary Interviews and Surveys
To tighten assumptions, we spoke with a mix of component suppliers, vehicle program stakeholders, distributors, and repair and retrofit channels. The respondent input helped confirm what gets counted as interior content and how pricing moves by feature level. Because this is a global market, we balanced coverage across APAC, EMEA, and the Americas so regional vehicle builds and content differences could be reflected and checked against what we saw in desk research.
Distribution of primary research fieldwork respondents
| Company type | Respondent position | Region |
|---|---|---|
| Top tier: 34% | CXOs: 14% | APAC: 40% |
| Mid tier: 49% | Functional/Unit leaders: 33% | EMEA: 33% |
| Smaller Players: 17% | Managers: 53% | Americas: 27% |
Market-Sizing & Forecasting
Sizing was built using a top-down reconstruction approach, where vehicle production and sales by region are translated into an interior demand pool. We applied penetration and content-per-vehicle indicators for key cabin systems to move from vehicle volumes to interior component value. After the core demand pool was formed, we cross-checked it using selective bottom-up approximations such as sampled component ASP times vehicle volumes, supplier revenue reasonableness checks, and channel feedback on mix shifts, which helped adjust outliers.
Inputs used in the model included global and regional vehicle production, passenger versus commercial output mix, the share of vehicles adopting advanced infotainment and integrated cockpit modules, interior lighting take rates, and material mix shifts that change average value per vehicle (for example, higher trim levels and lightweight material adoption). When a data gap appeared for a component in a smaller country, we used regional proxies linked to vehicle output and feature level, then tested those proxies with interview feedback.
For forecasting, scenario analysis was used to reflect different paths for vehicle builds, premium feature penetration, and pricing normalization across regions. The final forward curve was then aligned to the most consistent view from experts on OEM program cadence and supplier order visibility, so the forecast stays explainable and repeatable.
Data Validation & Update Cycle
We validate the model in several steps by checking that implied interior value per vehicle does not break known pricing realities, and by comparing growth patterns against independent signals such as vehicle production trends and feature adoption rates. If a region shows a sudden swing, we re-test the drivers, then run a second-pass review to confirm the change is supported by both desk indicators and interview logic.
Reports are refreshed annually, and interim updates are made when material events shift the outlook, such as sharp vehicle production resets or major regulation-driven interior safety changes. Before delivery, an analyst performs a fresh pass on key assumptions and currency timing so clients receive the latest updated view.
Mordor Intelligence's Automotive Interior Market Estimate Compared With Other Published Estimates
Published market sizes for automotive interiors can look far apart even when the topic sounds the same, because sources count different cabin items, apply different vehicle build assumptions, and use their own price progressions for feature-rich interiors.
Adhesives and tapes used across the cabin are a common swing item, and they sit outside Mordor Intelligence's scope. This is one reason some published totals land higher even before growth assumptions are compared. Differences also come from whether aftermarket interior upgrades are added on top of OEM fitment, how cockpit-module bundling is treated versus separate line items, and whether currency conversion is locked to one year or averaged across the period.
Benchmark comparison
| Source | Market Size | Gaps in Research Methodology |
|---|---|---|
| Mordor Intelligence | USD 175.14 B (2026) | |
| Global Consultancy A | USD 181.68 B (2025) | Uses a different year and a wider component basket that can include adjacent cabin consumables and bonding materials, which raises the implied value per vehicle versus a component-only build. |
| Industry Publisher B | USD 185.43 B (2025) | Often mixes premium-interior feature value with broader interior technology scopes and applies faster feature-led ASP expansion, which can lift totals when compared to production-linked demand pools. |
The spread in the table is mainly explained by what gets counted as interior content, how bundled cockpit value is allocated, and the exact year used for currency and pricing assumptions. By keeping the model anchored to vehicle output and clear feature take rates, the estimate remains traceable to repeatable inputs that can be rechecked as production and content trends change.


Key Questions Answered in the Report
How big is the automotive interior market in 2026?
The automotive interior market size equals USD 175.14 billion in 2026 and is projected to reach USD 214.96 billion by 2031 at a 4.18% CAGR.
Which component category currently leads in spending?
Seating systems lead with 34.05% revenue share in 2025, reflecting their universal fitment and upgrade potential.
What region shows the fastest growth through 2031?
Asia-Pacific exhibits the quickest 4.31% CAGR thanks to China’s premium SUV boom and Southeast Asian EV exports.
Why are driver monitoring systems gaining traction?
EU and U.S. regulations now mandate fatigue and distraction detection, propelling the segment at a 4.23% CAGR.
How does sustainability influence material choice?
OEM carbon neutrality goals push recycled and bio-based inputs, enabling natural and recycled materials to grow at a 4.24% CAGR through 2031.
Page last updated on:


 Your data is secure and never sold or shared.


