
Automotive Human Machine Interface Market Size and Share
Market Overview
| Study Period | 2019 - 2031 |
|---|---|
| Market Size (2026) | USD 30.11 Billion |
| Market Size (2031) | USD 50.19 Billion |
| Growth Rate (2026 - 2031) | 10.76 % |
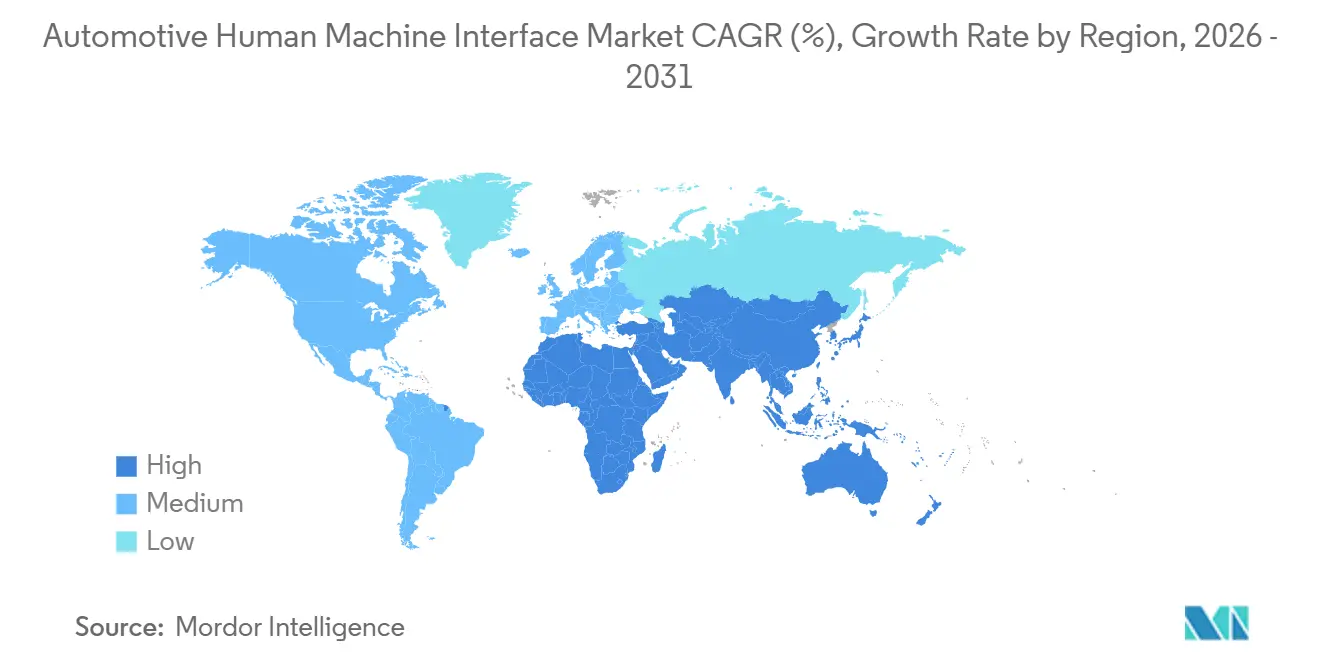
| Fastest Growing Market | Middle East and Africa |
| Largest Market | Asia Pacific |
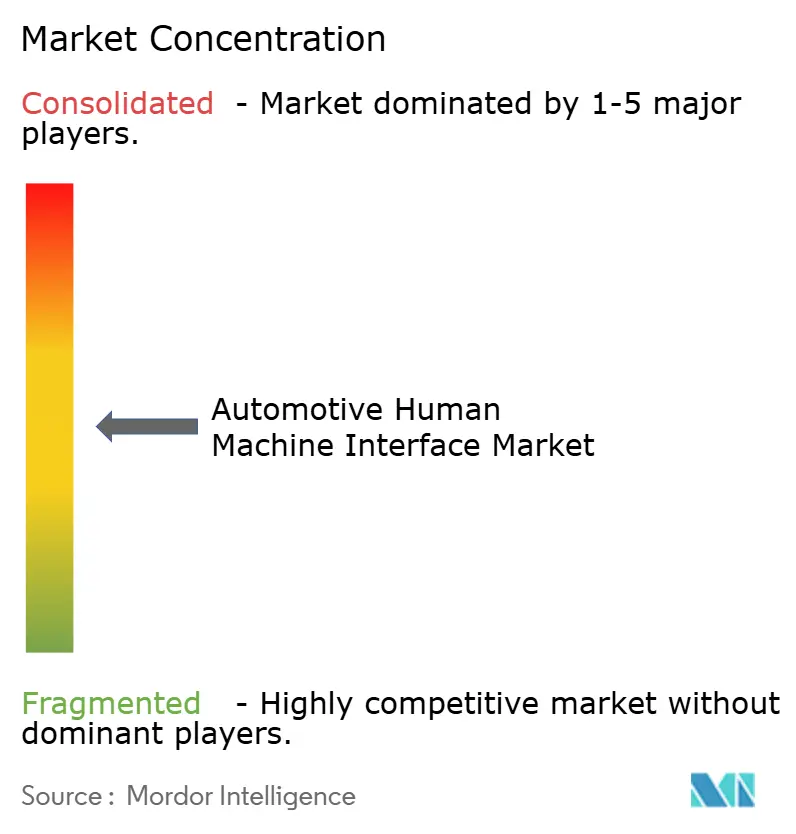
| Market Concentration | Medium |
Major Players
*Disclaimer: Major Players sorted in no particular order Image © Mordor Intelligence. Reuse requires attribution under CC BY 4.0. |
|
Automotive Human Machine Interface Market Analysis by Mordor Intelligence
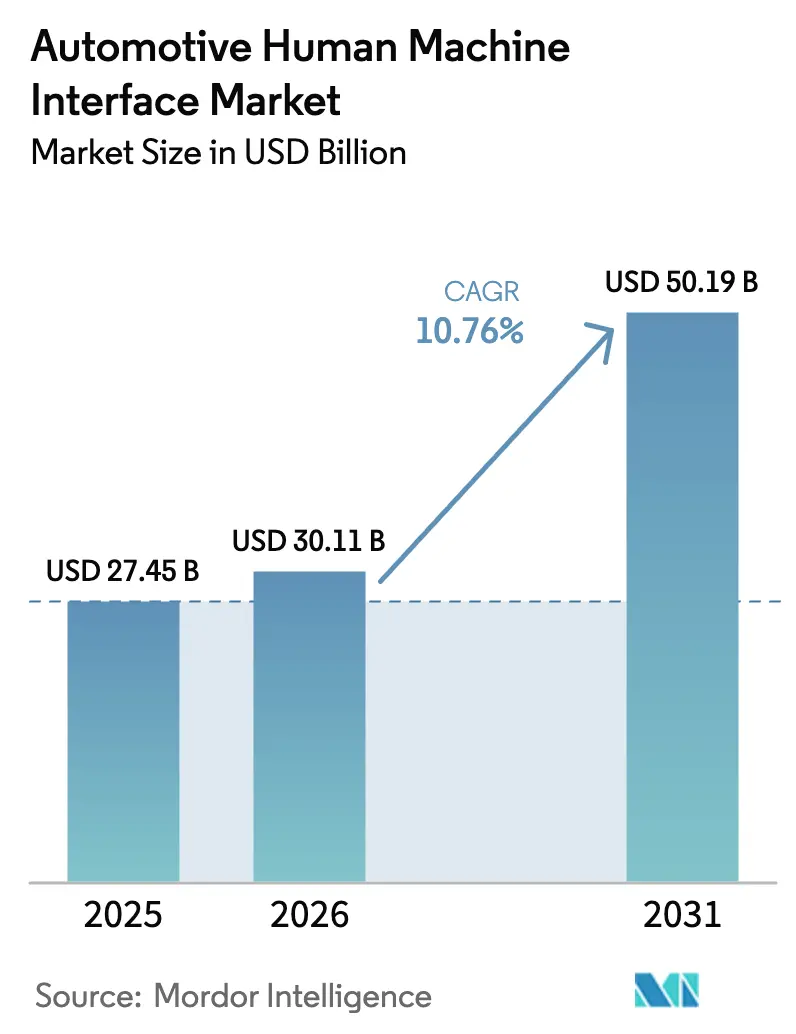
The automotive human machine interface market size was valued at USD 27.45 billion in 2025 and estimated to grow from USD 30.11 billion in 2026 to reach USD 50.19 billion by 2031, at a CAGR of 10.76% during the forecast period (2026-2031). This trajectory underscores how cockpit controls have shifted from physical knobs to software-defined experiences that now span voice, gesture, haptic, and visual channels. Automakers regard the interface as a revenue catalyst, using over-the-air pathways to refine features after delivery and to sell upgrades on demand. Regulatory mandates that curb distraction, notably United Nations Economic Commission for Europe (UNECE) R171 and the National Highway Traffic Safety Administration (NHTSA) over-the-air guidance, press suppliers to design layouts that cut cognitive load while still feeding rich data to driver-assistance stacks.
Key Report Takeaways
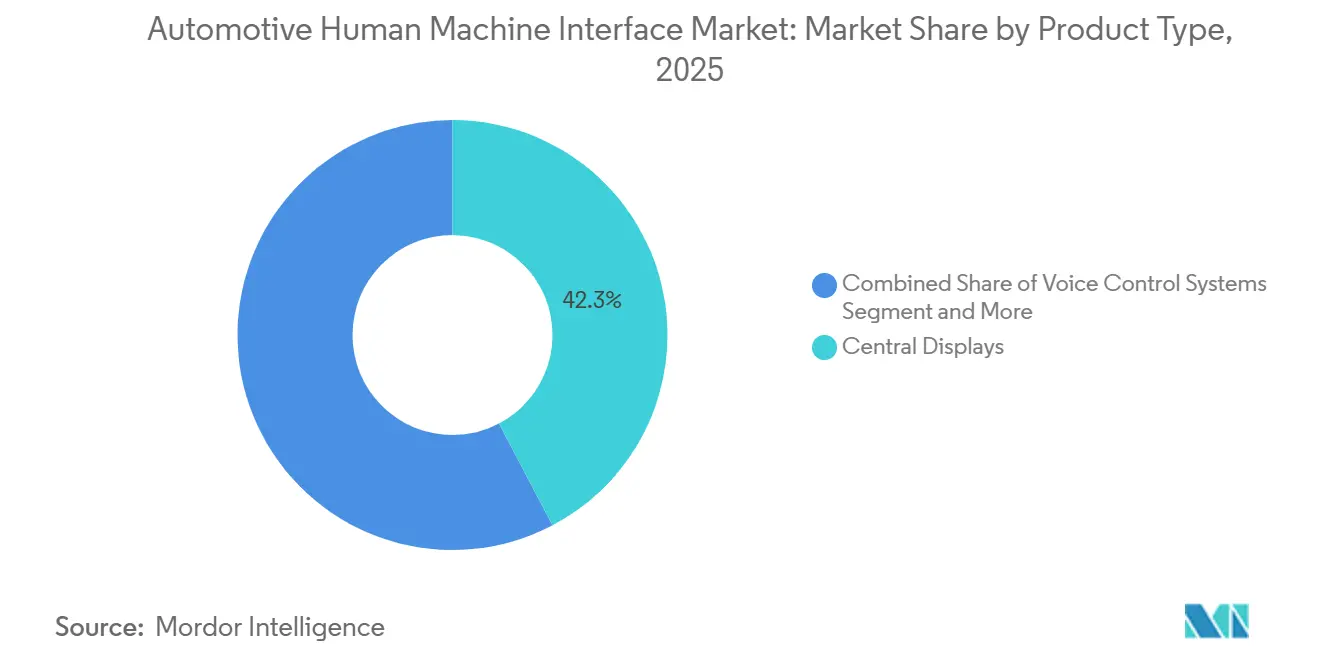
- By product type, central displays led with 42.28% of the human machine interface market share in 2025, while augmented-reality head-up displays are set to progress at a 17.06% CAGR through 2031.
- By access type, multimodal systems accounted for 51.62% of revenue in 2025 and are advancing at a 14.93% CAGR through 2031.
- By interaction modality, visual channels held a 67.14% share in 2025 and are growing fastest at 15.18% CAGR.
- By vehicle type, mid-price passenger cars captured a 35.68% share in 2025, whereas luxury passenger cars are poised to exhibit the quickest 12.34% CAGR toward 2031.
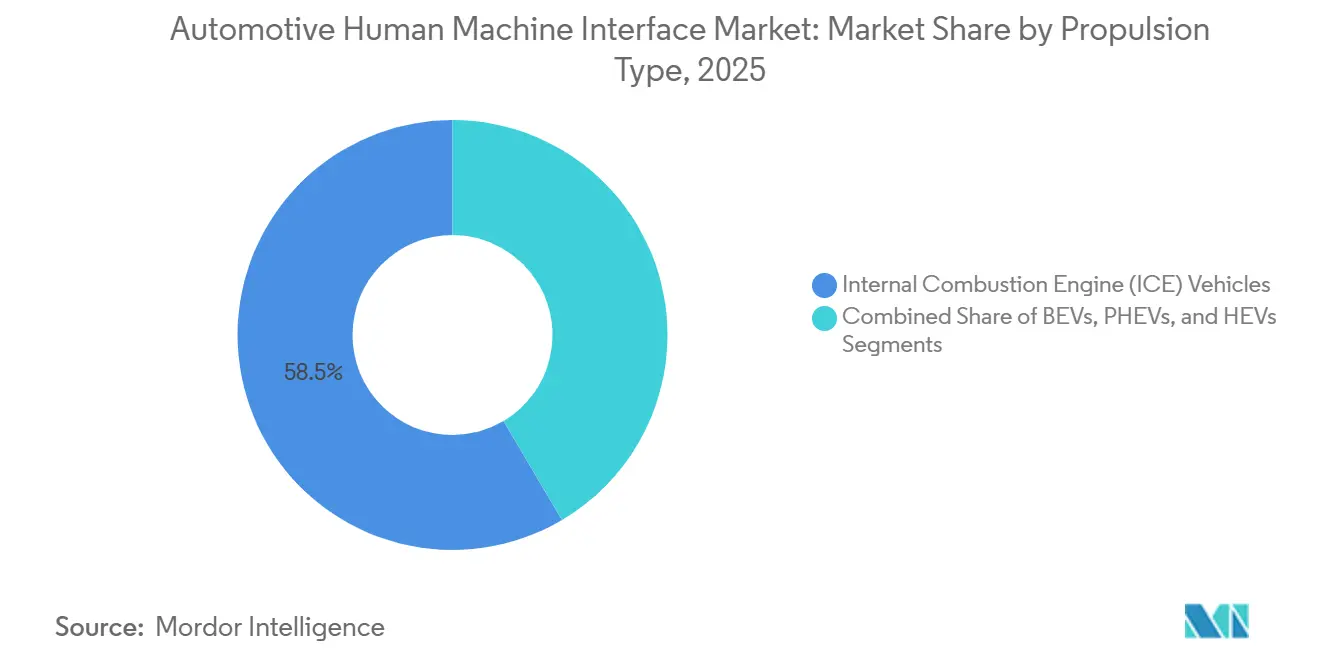
- By propulsion, internal-combustion models represented 58.47% in 2025; however, battery-electric vehicles are poised to grow at a 15.36% CAGR over the forecast period.
- By sales channel, OEM-installed systems claimed 81.12% share in 2025, but aftermarket retrofits are climbing at a 14.39% CAGR through 2031.
- By geography, Asia-Pacific dominated with 47.88% in 2025, whereas the Middle East and Africa region is set to accelerate at a 13.74% CAGR to 2031.
Note: Market size and forecast figures in this report are generated using Mordor Intelligence’s proprietary estimation framework, updated with the latest available data and insights as of January 2026.
Market Trends and Insights
Drivers Impact Analysis of Automotive Human Machine Interface Market*
| Driver | (~) % Impact on CAGR Forecast | Geographic Relevance | Impact Timeline |
|---|---|---|---|
| Demand for Connected-Infotainment | +2.1% | Global, with Asia-Pacific leadership | Medium term (2-4 years) |
| ADAS and Autonomous-Driving Dependency on Intuitive HMI | +1.8% | North America and Europe regulatory focus | Long term (≥ 4 years) |
| Regulatory Focus | +1.7% | Europe, North America, expanding to Asia-Pacific | Short term (≤ 2 years) |
| Shift Toward Software-Defined Vehicles | +1.5% | Global, led by premium segments | Medium term (2-4 years) |
| In-Cabin Health and Wellness Interface Innovations | +0.7% | Premium markets, North America and Europe | Long term (≥ 4 years) |
| Generative-AI Copilots | +0.6% | Global, early adoption in premium vehicles | Medium term (2-4 years) |
| Source: Mordor Intelligence | |||
Demand for Connected-Infotainment Ecosystems
Consumers treat the vehicle as a node in a wider digital mesh, expecting seamless handoffs among phone, home assistant, and car. TomTom and Microsoft introduced a conversational navigation platform in 2025 that employs Azure OpenAI Service to deliver real-time traffic storytelling. Voice platforms such as SoundHound, which doubled original equipment manufacturer wins to 18 brands in 2024, allow multi-turn dialogue for climate, media, and smart-home control. Always-on connectivity unlocks usage-based insurance and predictive-maintenance alerts, producing post-sale revenue that offsets hardware cost. As edge computing migrates to cockpit domain controllers, software updates can deliver new features without hardware swaps, shrinking the gap between consumer-electronics refresh cycles and automotive development. The human machine interface market, therefore, benefits from a virtuous loop in which richer cloud services justify connectivity subscriptions that in turn demand more capable interfaces.
ADAS and Autonomous-Driving Dependency on Intuitive HMI
Level 2+ assistance keeps hands loosely on the wheel while transferring lateral and longitudinal control for extended stretches. United Nations Economic Commission for Europe (UNECE) R171[1]"UN Regulation on uniform provisions concerning the approval of vehicles with regard to Driver Control Assistance Systems," UNECE, unece.org., enforced from 2024, obliges systems to communicate status and takeover prompts by escalating audio-visual cues. Mercedes-Benz Drive Pilot uses tri-color light strips and steering-wheel light-emitting diodes to signal role changes, minimizing ambiguity. Suppliers embed geo-fencing and weather limits into AR head-up displays that overlay safe-operation bounds directly on the road, trimming eyes-off-road time. Driver-monitor cameras ensure gaze compliance and can suspend assisted mode when attention drifts. As autonomous functions inch toward Level 3, the human machine interface market must visualize vehicle intent clearly enough to sustain driver trust, or regulators could throttle roll-outs.
Regulatory Focus on Driver-Distraction Mitigation
National Highway Traffic Safety Administration (NHTSA) guidelines cap any nondriving task at 12 seconds total glance time, with every single look under 2 seconds[2]"Visual-Manual NHTSA Driver Distraction Guidelines for Portable and Aftermarket Electronic Devices," National Highway Traffic Safety Administration, Federal Register, federalregister.gov.. Volkswagen backtracked on touch-only layouts, restoring rotary dials in the 2025 ID.4 facelift after user complaints and regulatory attention. China’s GB 15084-2024[3]"TC11-2023-02 Revision of GB Standards for Motor Vehicles and Parts in China," CNCA Automotive and Parts Technical Expert Group, china-certification.com. bars forward-facing video unless the vehicle is stationary, compelling original equipment manufacturers to geofence entertainment apps. Driver-monitor cameras enforce compliance by disabling features when attention strays, and ISO 21434 embeds cyber requirements that block spoofing. These measures accelerate the adoption of head-up displays and physical shortcuts that present essential information with minimal visual load, boosting the human-machine interface market.
Shift Toward Software-Defined Vehicles and OTA UI Upgrades
Tesla normalized over-the-air feature drops, prompting legacy original equipment manufacturers to adopt rolling software releases. General Motors’ Ultifi platform commits to quarterly interface refreshes, enabling A/B tests of menu hierarchies across Chevrolet, GMC, and Cadillac fleets. The eSync Alliance published a 2025 framework that covers delta compression and fail-safe boots, cutting data bills and bricking risk. ISO 24089, finalized in 2024, now treats software updates that affect safety functions with the same rigor as recalls. Consequently, the human machine interface market earns recurring revenue from feature unlocks while guarding against version rollbacks that could breach compliance.
Restraints Impact Analysis of Automotive Human Machine Interface Market*
| Restraint | (~) % Impact on CAGR Forecast | Geographic Relevance | Impact Timeline |
|---|---|---|---|
| High Cost of Advanced HMI Hardware Stacks | -1.4% | Global, particularly emerging markets | Short term (≤ 2 years) |
| Cyber-Security and Data-Privacy Vulnerabilities | -0.9% | Global, stricter in Europe and North America | Medium term (2-4 years) |
| Micro-LED and AR-HUD Component Supply Bottlenecks | -0.8% | Global supply chain constraints | Short term (≤ 2 years) |
| Cognitive Overload From Multimodal UI Complexity | -0.6% | Developed markets with complex regulations | Long term (≥ 4 years) |
| Source: Mordor Intelligence | |||
High Cost of Advanced HMI Hardware Stacks
Curved organic light-emitting diode panels, ultrasonic haptics, and AR-HUD optics add USD 800–1,500 to the bill of materials, pricing them out of entry models. Chinese panel makers such as BOE have yet to bring curved automotive organic light-emitting diode (OLED) yields above 70%, sustaining premiums. Micro-LED wafers, still semi-manual in die transfer, sit at thrice the organic light-emitting diode (OLED) cost, confining adoption to ultra-luxury trims. Original equipment manufacturers tier features by trim to soften sticker shock, but fragmented hardware complicates software consistency and raises test overhead, an impediment to scale within the human machine interface market.
Cyber-Security and Data-Privacy Vulnerabilities
A compromised infotainment unit can pivot into critical ECUs. The United States Bureau of Industry and Security banned certain foreign code bases in connected vehicles in 2024, forcing supplier audits and redesigns. ISO 21434 now mandates threat analysis and cryptographic key management across the development life cycle. Region-specific privacy laws, from Europe’s GDPR to China’s Personal Information Protection Law, oblige localized data storage and consent flows, raising compliance costs. Silicon-level secure enclaves from Renesas and NXP embed intrusion detection, yet widespread rollout remains uneven. These factors shave growth off the human machine interface market.
*Our forecasts treat driver/restraint impacts as directional, not additive. The impact forecasts reflect baseline growth, mix effects, and variable interactions.
Automotive Human Machine Interface Market Segment Analysis
By Product Type:
Central Displays Consolidate Control ArchitectureCentral displays held a commanding 42.28% human-machine interface market share in 2025, as 10- to 15-inch touchscreens became the default portal for navigation, media, and climate control. The augmented-reality head-up display category is scaling at a 17.06% CAGR, propelled by windshield-level navigation arrows that align with United Nations Economic Commission for Europe (UNECE) distraction caps and keep glance durations low. Voice control systems are migrating down-market to cloud natural-language processing that lowers silicon demands, expanding total addressable units. Rotary knobs are disappearing in mainstream models but linger in select luxury brands for tactile reassurance.
Augmented-reality units from Panasonic project a 13-degree field of view 10 meters ahead, overlaying object detection on the driving scene. Gesture modules from Ultraleap give mid-air call-accept motions, yet struggle with unintentional triggers in bumpy conditions. Wearable extensions, phone unlock, smartwatch battery checks, form a nascent but rising slice. As premium screens filter into mid-price cars, the human machine interface market size for displays alone is positioned to expand faster than overall revenue.


By Access Type:
Multimodal Integration Drives User AdoptionMultimodal systems controlled 51.62% of the 2025 revenue and will grow at 14.93%, because Level 2+ ADAS and infotainment depth exceed any single channel’s bandwidth. Mercedes’ 56-inch Hyperscreen marries touch, gesture, and voice, dynamically prioritizing the least distracting channel per context. Single-modality layouts persist in economy tiers where cost gates experimentation, yet even these cars adopt wireless phone mirroring that injects external voice assistants.
Haptic feedback joins touch, voice, and gesture as a fourth lane; Bosch piezo touchscreens fake mechanical clicks to confirm selections without visual verification. Adaptive systems observe driver preference and highlight the dominant modality, aiming to meet NHTSA’s 2-second glance rule. However, gesture misreads and voice latency risk frustrating users, proving that multimodal value depends on orchestration quality within the human machine interface market.
By Interaction Modality:
Visual Channels Capture the Lion’s ShareVisual interfaces such as LCD, OLED, and emerging micro-LED displays accounted for 67.14% of revenue in 2025 and are advancing at 15.18%, the fastest modality growth rate. Curved pillar-to-pillar screens elevate perceived cabin tech and create unified canvases for navigation and ADAS visualization. Acoustic channels rise on the back of AI voice copilots but remain complementary because drivers demand visual confirmation.
Micro-LED promises 5,000-nit brightness with a 15-year lifespan, solving OLED burn-in worries. Transparent OLED embedded in sun visors eliminates A-pillar blind spots. Regulators now restrict video on forward-facing displays unless parked, nudging OEMs to implement immobilizer triggers. Overall, modality mix evolution keeps visual hardware central to the human machine interface market size, even as voice gains mindshare.
By Vehicle Type:
Mid-Price Segments Balance Features and CostsMid-price passenger cars retained 35.68% revenue in 2025, yet luxury models grew fastest at 12.34% CAGR, introducing micro-LED clusters and AI assistants that later migrate down-segment. Economy cars lean on smartphone mirroring for competitiveness and may omit built-in navigation entirely. Commercial trucks require interface-as-a-tool designs for route compliance and driver coaching rather than entertainment.
Subscription-based heated seats and hands-free-assist upgrades live mainly in luxury vehicles, justifying complex account-management screens. Electric vans, such as Mercedes eSprinter, borrow passenger-car display tech to attract younger drivers. This tiered rollout model creates trickle-down demand that widens the human machine interface market over the forecast horizon.
By Propulsion Type:
Electric Vehicles Reshape Interface RequirementsInternal-combustion models still represented 58.47% of 2025 shipments, yet battery electric vehicles are surging at 15.36% CAGR through 2031, catapulting the human machine interface market size for large curved panels and charge-route visuals. Flat-floor skateboard chassis allows 56-inch Hyperscreens, impossible with transmission tunnels. Range anxiety forces persistent state-of-charge graphics and charger routing overlays, lifting screen time per mile.
Plug-in hybrid electric vehicles (PHEVs) complicate UI logic by needing dual fuel and battery readouts, while fuel-cell vehicles copy BEV interfaces but add stack-temperature dials. Chinese battery electric vehicle brands democratize 17-inch screens and AI helpers at sub-USD 40,000 prices, accelerating global adoption. Propulsion shifts, therefore, re-allocate R&D spend toward electric-centric interfaces across the human machine interface market.
By Sales Channel:
OEM Integration Dominates Market StrategyOriginal equipment manufacturer (OEM) systems owned 81.12% of 2025 shipments, but their share edges down as retrofit demand climbs 14.39% CAGR; drivers of 2020-2023 cars swap outdated head units for wireless CarPlay or vertical Android screens. Low-cost 12-inch floating displays emulate factory aesthetics for under USD 600 installed. However, original equipment manufacturers encrypt CAN data, limiting deep vehicle integration and preserving their subscription revenue.
Regulators in some states restrict safety-system modification, chilling the retrofit of driver-monitor cameras or steering haptics. Insurance exclusions further temper aftermarket penetration. Despite growth, original equipment manufacturer lock-in will keep them the dominant gatekeepers of the human machine interface market.
Geography Analysis
APAC Automotive Human Machine Interface Market
Asia-Pacific owned 47.88% of 2025 revenue, anchored by China’s battery electric vehicle surge and mandates that cockpit data be stored locally, forcing global suppliers to spin up Mandarin voice models and in-country cloud nodes. Japanese brands favor minimalist tactile buttons, fitting cultural preferences for low distraction, while South Korea positions itself as a second source for AR-HUD optics through Hyundai Mobis and Zeiss collaboration. India’s sub-USD 15,000 cars now feature Hindi voice assistance on 9-inch displays, enlarging unit volume.
MEA Automotive Human Machine Interface Market
The Middle East and Africa books a 13.74% CAGR, the fastest geography. Saudi Arabia’s USD 5.6 billion investment in Lucid includes Arabic-local HMI and region-specific maps. Dubai’s multilingual autonomous-taxi pilots demand real-time translation across Arabic, English, Hindi, and Urdu. South African assembly lines adapt interfaces to Afrikaans and Zulu, indicating original equipment manufacturer willingness to localize for sub-Saharan growth.
The Americas, Europe, Middle East and APAC Automotive Human Machine Interface Market
North America and Europe mature more slowly yet pioneer standards. United Nations Economic Commission for Europe (UNECE) R171 and GDPR shape global cockpit design and data pipelines, and premium German cars typically debut new interface tech before exporting it. Brazil and Argentina adopt Euro-style approval frameworks that favor incumbents, while Russian brands rely on Chinese Android head units amid sanctions. These regional dynamics keep the human machine interface market dispersed, with design centers clustered in Germany, the United States, China, and Japan, but growth pockets emerging in the Gulf and India.

Regulatory Landscape
Automotive HMI requirements are increasingly tied to governance around software updates and to driver supervision under automated driving. In the EU, UN Regulation No. 156 (Software Update Management Systems) provides a type-approval pathway for managed OTA updates, and a July 2026 compliance milestone for new complete vehicles (M, N, O categories) raises HMI needs around update status visibility and safety-impact communication. The UK Vehicle Certification Agency has also highlighted cyber security and software updating expectations, reinforcing that HMI behavior during updates is treated as part of a controlled safety process rather than a pure UX choice.
On automated driving and driver distraction, UNECE WP.29 GRVA work in January 2026 emphasized that driver engagement monitoring must be represented through the HMI in scenarios where a driver can override automation, aligning interface design with attention management. In the United States, NHTSA activity around ADS performance (Docket 2026-0034) signals continued scrutiny of how automated functions communicate dynamic driving task boundaries and handover states. Standards add implementation-level specificity: ISO/TS 20003:2026 (published February 2026) sets out HMI design specifications for OTA update interactions, complementing ISO 21434 cyber-security expectations and ISO 24089 software update engineering practices referenced in the market context.
Value Chain Analysis
The automotive HMI value chain begins with upstream electronics and optics inputs (automotive-grade LCD/OLED and emerging micro-LED materials, display drivers, touch controllers, haptics actuators, driver-monitoring cameras, and compute SoCs). It then proceeds through module integration by Tier 1 suppliers into displays, head-up display units, cockpit domain controllers, and software stacks (UI frameworks, voice/NLP, and OTA tooling). OEMs and their software platforms increasingly set integration requirements, as cockpit functions consolidate onto centralized compute architectures where infotainment, cluster visualization, and monitoring features share silicon and safety processes.
Recent OEM and Tier 1 moves show a shift toward platformized, software-defined cockpits. Panasonic Automotive Systems announced its IVI system debuting in the 2026 Toyota RAV4 and tied to Toyota's Arene software platform, while Mazda selected Panasonic Automotive Systems' cockpit domain controller for a new CX-5 supporting OTA updates and real-time Unity 3D graphics, pulling UI middleware closer to vehicle E/E architecture decisions. On the supplier and ecosystem side, Garmin unveiled Unified Cabin 2026 with an AI/LLM-based virtual assistant, reflecting growing reliance on high-performance compute, OS layers (for example Android Automotive OS), and cloud tooling for language models and personalization. Key bottlenecks remain tied to automotive-grade component qualification cycles, panel allocation during demand spikes, and semiconductor supply volatility, which can constrain delivery of display electronics and cockpit compute even when HMI software is ready to ship.
Competitive Landscape
Continental, Bosch, Visteon, DENSO, and Harman jointly held a significant share of 2025 revenue, signaling moderate concentration and room for niche entrants. Continental acquired a stake in Leia to lock up holographic-display IP, aiming to ship 3D dashboards by 2027. Bosch pivoted to cloud middleware through a 2024 Microsoft Azure alliance that lets automakers push HMI updates independent of hardware swaps. Visteon won a multiyear Stellantis deal to supply domain controllers that mash cluster, infotainment, and driver-monitor functions on a single SoC, trimming weight and cost.
Disruptors thrive in gesture sensing, voice AI, and health monitoring. Ultraleap licenses mid-air haptics to Jaguar Land Rover, Tanvas renders texture on flat glass, and Cerence bets on large-language assistants. Chinese vendors such as Huawei bundle 5G modules with displays at a 30% discount to Western peers, squeezing margins. Silicon players, Qualcomm, Renesas, and NXP embed secure boot and AI acceleration, hijacking value from traditional Tier-1s.
Market entry barriers rise with ISO 21434 and ISO 24089 compliance. Suppliers offering baked-in security win sockets in safety domains where software-only fixes lack pedigree. At the same time, cloud hyperscalers can now supply language models directly, threatening incumbent voice giants. Patent filings by Synaptics around ultrasonic haptic overlays broaden competitive fronts, while Aptiv’s zonal architecture promises wiring-harness weight cuts that free budget for richer displays. The human machine interface market remains competitive yet rewards IP differentiation and secure pipelines.
Automotive Human Machine Interface Industry Leaders
-
Continental AG
-
Visteon Corporation
-
Valeo S.A.
-
DENSO Corporation
-
Bosch GmbH
- *Disclaimer: Major Players sorted in no particular order
Automotive Human Machine Interface Market Companies Covered in this Report
- Continental AG
- Visteon Corporation
- DENSO Corporation
- Bosch GmbH
- Valeo S.A.
- Harman International (Samsung)
- Panasonic Automotive
- Aptiv plc
- Synaptics Inc.
- Luxoft (DXC Technology)
- Alps Alpine
- Magna International
- Faurecia Clarion
- Hyundai Mobis
- Yazaki Corp.
- Nippon Seiki
- Pioneer Corp.
- Tencent
- Cerence Inc.
- Elektrobit Automotive
Read Analysis of Automotive Human Machine Interface Companies

Market Opportunities and Future Outlook
Compliance-led OTA transparency is creating whitespace for HMI suppliers to productize update-state communication, driver messaging, and audit-friendly software update UX as a reusable module across vehicle lines. The July 2026 compliance milestone tied to UN R156 pushes OEMs and Tier 1s to embed software update status and safety-impact disclosure into the cockpit experience, and ISO/TS 20003:2026 adds a shared reference point for designing those interactions, favoring vendors that can pair UI design with secure update workflows.
Cockpit consolidation and AI copilots also open near-term integration opportunities around compute platforms, multimodal orchestration, and localization. Hyundai Motor Group introduced Pleos Connect with AI voice assistance, and Garmin's Unified Cabin 2026 positioned an LLM-based, multi-intent, multi-lingual assistant integrated into a unified cabin stack, both reinforcing active commercialization of conversational HMI on centralized compute. At the same time, in-cabin sensing is becoming a more direct design driver, with a reported 27.24% driver monitoring system camera installation rate in China domestic passenger vehicles (Q1 2026) providing a basis for attention-aware HMI behaviors such as feature gating, glance-compliant prompts, and escalation logic for driver assistance functions.
Recent Industry Developments in Automotive Human Machine Interface Market
- January 2026: Visteon launched a flexible compute solution with NVIDIA AI to accelerate smart cockpit and ADAS development. The initiative supports higher consolidation of cockpit and assistance workloads and strengthens Visteon's positioning in AI-centric HMI compute modules used for multimodal and software-defined experiences.
- March 2025: Continental introduced Ac2ated Sound display technology that turns the display unit into a sound source. Integrating audio actuation into screen architecture reduces component count and enables new HMI feedback designs that pair visual UI with localized acoustic cues.
- December 2024: Continental expanded its Emotional Cockpit portfolio through a collaboration featuring Swarovski elements for in-cabin interaction surfaces. The announcement highlights continued differentiation efforts in premium HMI, where materials, lighting, and tactile effects are used to elevate perceived cockpit value.


Automotive Human Machine Interface Market Report Scope and Research Methodology
Market Definition and Coverage
This market counts revenues earned from in-vehicle human machine interface hardware and embedded software that lets drivers and passengers control, view, and receive vehicle information. It covers factory-fit and OEM-approved systems across passenger and commercial vehicles, across major automotive producing and consuming regions.
Scope exclusions: We exclude generic industrial HMI panels, standalone smartphone apps not integrated through OEM vehicle interfaces, and standalone ADAS control units that do not serve as a user interface.
Segments Covered in This Report
-
By Product Type
- Central Displays
- Voice Control Systems
- Head-Up Displays (Conventional and AR)
- Touch-Sensitive Steering Controls
- Gesture-Control Modules
- Rotary/Knob Controllers
- Wearable and Bring-Your-Own-Device Interfaces
-
By Access Type
- Single-Modal
- Multimodal (Voice+Gesture+Touch)
-
By Interaction Modality
- Visual (LCD/OLED/micro-LED)
- Acoustic (Voice, Sound-Haptics)
- Haptic (Force-feedback, Ultrasonic)
-
By Vehicle Type
- Economy Passenger Cars
- Mid-Price Passenger Cars
- Luxury Passenger Cars
- Commercial Vehicles
-
By Propulsion Type
- Internal Combustion Engine (ICE)
- Battery-Electric Vehicles (BEVs)
- Plug-in Hybrid Vehicles (PHEVs)
- Fuel-Cell Vehicles (FCEVs)
-
By Sales Channel
- OEM-Installed Systems
- Aftermarket Retro-fits
-
By Geography
-
North America
- United States
- Canada
- Rest of North America
-
South America
- Brazil
- Argentina
- Rest of South America
-
Europe
- Germany
- United Kingdom
- France
- Italy
- Spain
- Russia
- Rest of Europe
-
Asia-Pacific
- China
- Japan
- India
- South Korea
- Rest of Asia-Pacific
-
Middle East and Africa
- Saudi Arabia
- United Arab Emirates
- South Africa
- Rest of Middle East and Africa
-
North America
Data Sources, Market Sizing, and Validation
Desk Research
Desk work starts with public anchors that explain the real vehicle and component demand pool, and we use these to keep the model grounded before we add pricing logic. Sources commonly checked include vehicle production and registration releases from agencies such as OICA and national transport ministries, customs trade statistics for automotive electronics, and safety and interface related publications from bodies such as NHTSA and UNECE.
We also review company annual reports, investor decks, earnings call transcripts, and product announcements to understand which HMI functions are being shipped in new platforms. Patents and peer reviewed papers are used to sense technology direction (for example, touch, haptics, HUD optics, and voice stacks), and a paid subscription for company financials and a separate patent database are used to speed up cross-checks. This list is not exhaustive, and many other public sources were also used for data collection, validation, and clarification.
Primary Interviews and Surveys
Primary work is used to pressure test the unit assumptions behind HMI fitment, pricing, and the shift from single displays to cockpit domain designs. We spoke with participants across the value chain, including component suppliers, software and integration teams, OEM program functions, and channel partners. We covered APAC, EMEA, and the Americas so regional take rates and price deltas were not averaged away.
Distribution of primary research fieldwork respondents
| Company type | Respondent position | Region |
|---|---|---|
| Top tier: 36% | CXOs: 13% | APAC: 41% |
| Mid tier: 49% | Functional/Unit leaders: 35% | EMEA: 36% |
| Smaller Players: 15% | Managers: 52% | Americas: 23% |
Market-Sizing & Forecasting
Sizing is built using a top-down demand pool, where vehicle production and sales by region are reconstructed into installed HMI opportunities through feature take rates and platform mix. The model then applies average selling prices by module and vehicle class, and the totals are summed into a global value for the year.
To keep totals realistic, we corroborate the output with selective bottom-up checks, such as supplier revenue cues, sampled bill of material splits, and channel discussions on typical cockpit content per vehicle. Key inputs used in the model include passenger versus commercial production, penetration of central displays and digital clusters, HUD adoption, the shift toward multimodal interfaces (touch plus voice plus haptics), and regional pricing differences tied to vehicle mix. Where direct pricing or take rate signals are thin, we apply conservative ranges and only tighten them after interview feedback and consistency checks across regions.
For forecasting, scenario analysis is used because adoption curves for new HMI content can change quickly with regulations, model refresh cycles, and software-defined cockpit roadmaps. Assumptions are carried forward with clear step changes for new platform launches, followed by smoother year-to-year progression once penetration starts to normalize.
Data Validation & Update Cycle
Outputs are reviewed through multiple checks, starting with simple sanity tests against vehicle volumes, typical content per vehicle, and region split expectations. When a country or segment shows an unusual jump, we re-check the underlying take rate, price, and mix inputs, then reconnect with respondents if the change is linked to a new regulation, platform change, or supply constraint.
Before sign-off, the model is reviewed by another analyst to confirm that assumptions are traceable and arithmetic is consistent across years and regions. Reports are refreshed annually, and interim updates are made if there is a material event, such as a large vehicle production reset or a meaningful technology adoption shift. Right before delivery, a fresh pass is done so clients receive the latest updated view.
Mordor Intelligence's Automotive Human Machine Interface Market Size Versus Other Published Estimates
It is normal to see different market sizes for automotive HMI because publishers do not always count the same modules, years, and pricing logic. The biggest differences usually come from what is treated as an HMI component versus adjacent electronics, how rapidly ASPs are assumed to change by region, and whether the work is updated to reflect recent platform launches.
Some published figures appear to use a wider umbrella that can include cockpit electronics beyond the user-facing interface layer. For Mordor Intelligence, the count is limited to HMI modules and embedded interaction software that directly enable visual, acoustic, or haptic control and feedback in the vehicle, and items like generic industrial HMI panels and standalone ADAS control units sit outside scope.
Benchmark comparison
| Source | Market Size | Gaps in Research Methodology |
|---|---|---|
| Mordor Intelligence | USD 30.11 B (2026) | |
| Global Consultancy A | USD 26.28 B (2024) | Uses an earlier base year and a different forecast window, and the source does not clearly state which HMI modules are included, which can shift totals when HUDs, steering controls, and voice stacks are treated differently. |
| Industry Publisher B | USD 27.03 B (2025) | Reports a nearby-year value but provides limited detail on whether pricing is based on module ASP by region or blended averages, and the handling of OEM-fit versus approved aftermarket content is not fully transparent. |
The spread in the table is mostly explained by year alignment and what gets counted as HMI versus neighboring cockpit electronics, followed by differences in how pricing and penetration move forward. With clear inclusion rules and practical checks against vehicle volumes and feature take rates, we end up with a number that is easier to replicate and audit when assumptions are revisited.


Key Questions Answered in the Report
How large is the automotive human machine interface sector today and where is it headed?
It generated USD 30.11 billion in 2026 and is projected to reach USD 50.06 billion by 2031, advancing at a 10.76% CAGR.
Which region currently shows the highest adoption of advanced cockpit interfaces?
Asia-Pacific held 47.88% of global revenue in 2025, driven by China’s connected-vehicle mandates and rapid BEV rollout.
What growth rate is expected for battery-electric vehicle cockpit systems?
BEV-focused interfaces are forecast to expand at a 15.36% CAGR between 2026 and 2031, the fastest among propulsion categories.
Which cockpit component commands the biggest revenue share?
Central displays led with 42.28% share in 2025, reflecting their role as the primary hub for navigation, media, and vehicle settings.
How quickly are augmented-reality head-up displays scaling?
AR-HUD shipments are projected to rise at a 17.06% CAGR through 2031 as automakers migrate navigation and safety cues onto the windshield.
Page last updated on:


 Your data is secure and never sold or shared.


