
Automotive Clutch Market Size and Share
Market Overview
| Study Period | 2019 - 2031 |
|---|---|
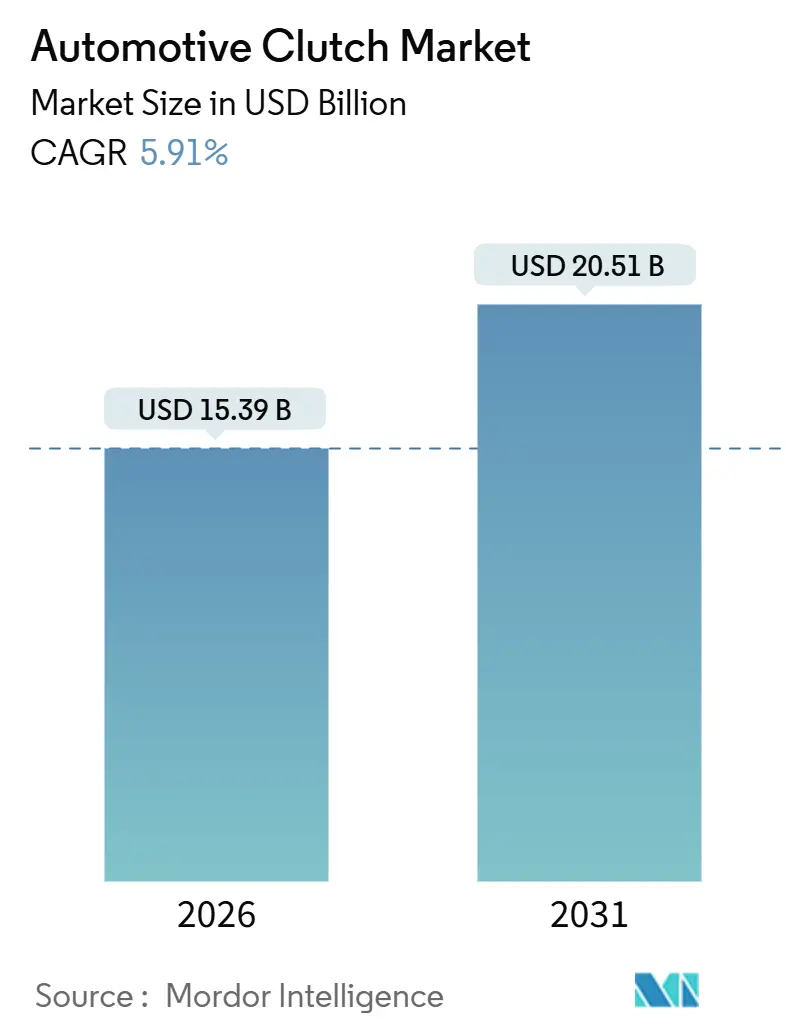
| Market Size (2026) | USD 15.39 Billion |
| Market Size (2031) | USD 20.51 Billion |
| Growth Rate (2026 - 2031) | 5.91% CAGR |
| Fastest Growing Market | South America |
| Largest Market | Asia Pacific |
| Market Concentration | High |
Major Players
*Disclaimer: Major Players sorted in no particular order Image © Mordor Intelligence. Reuse requires attribution under CC BY 4.0. |
|
Automotive Clutch Market Analysis by Mordor Intelligence
The automotive clutch market size is valued at USD 15.39 billion in 2026 and is projected to post USD 20.51 billion by 2031, translating into a 5.91% CAGR over the forecast period (2026-2031). Demand remains anchored in cost-sensitive regions that still favor manual transmissions. Yet, dual-clutch and electro-hydraulic systems are gaining ground as automakers target lower CO₂ emissions, reduced shift times, and smoother operation in mild-hybrid vehicles.
Key Report Takeaways
- By transmission type, manual gearboxes captured 64.79% of the automotive clutch market share in 2025, whereas wet dual-clutch systems are forecast to advance at a 9.37% CAGR to 2031.
- By vehicle type, passenger cars led with 74.23% of the automotive clutch market share in 2025, while medium and heavy commercial vehicles are projected to register the fastest growth, at 8.02% CAGR, through 2031.
- By component, clutch disc and hub assemblies accounted for 29.08% of the automotive clutch market share in 2025; actuation systems are projected to show the strongest growth rate of 8.41% across the forecast.
- By sales channel, OEM supply accounted for 82.45% of the automotive clutch market share in 2025; however, aftermarket demand is expected to expand at a 5.79% CAGR through 2031.
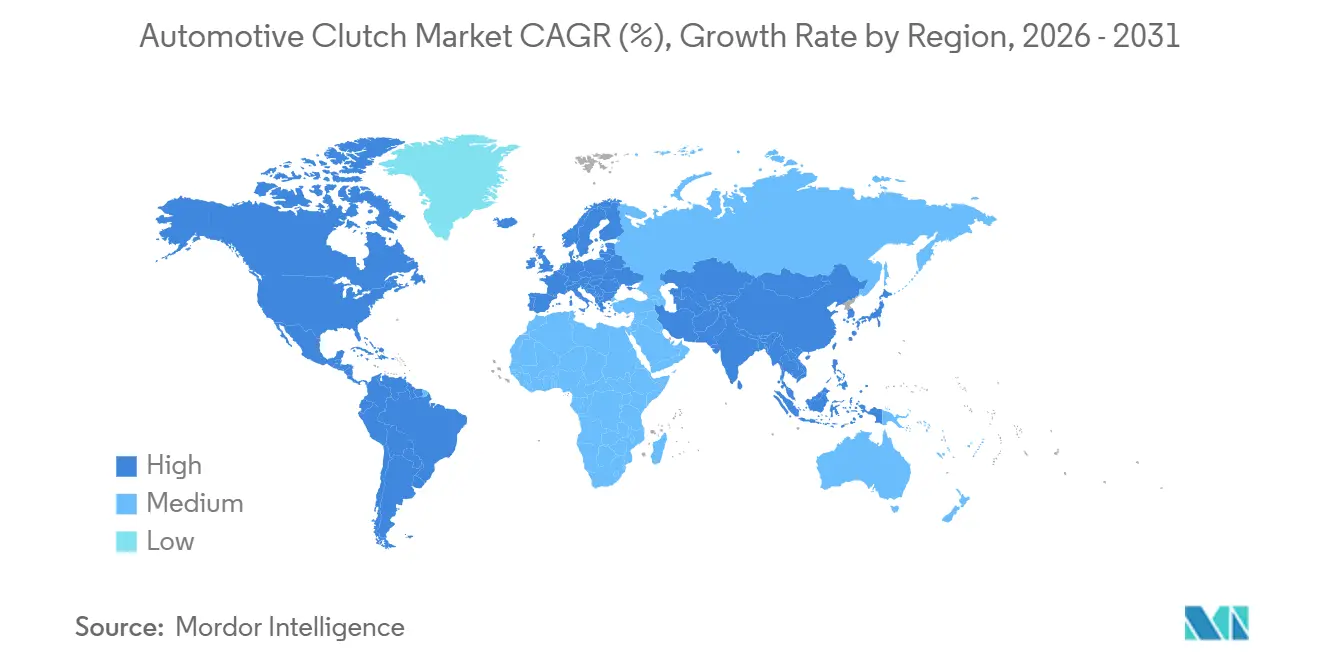
- By geography, the Asia-Pacific region retained the highest 49.62% of the automotive clutch market share in 2025, and South America is expected to log the fastest 6.82% CAGR through 2031.
Note: Market size and forecast figures in this report are generated using Mordor Intelligence’s proprietary estimation framework, updated with the latest available data and insights as of January 2026.
Global Automotive Clutch Market Trends and Insights
Drivers Impact Analysis*
| Driver | (~)% Impact on CAGR | Geographic Relevance | Impact Timeline |
|---|---|---|---|
| Shift Toward Dual-Clutch Transmissions | +1.8% | Global, with a concentration in Europe and China | Short term (≤ 2 years) |
| Rising Light-Vehicle Production | +1.2% | Asia-Pacific core, spill-over to Middle East and Africa | Medium term (2-4 years) |
| Stringent CO₂ Targets | +0.9% | Europe and North America, extending to Asia-Pacific | Long term (≥ 4 years) |
| 48-V E-Clutch System Adoption | +0.7% | Global, led by premium segments in developed markets | Medium term (2-4 years) |
| Lightweight Composite Friction Materials | +0.4% | North America and Europe, with adoption in Asia-Pacific | Long term (≥ 4 years) |
| Growing Retrofit Demand | +0.3% | Asia-Pacific emerging markets, selective Middle East and Africa regions | Short term (≤ 2 years) |
| Source: Mordor Intelligence | |||
Rapid OEM Shift Toward Dual-Clutch and Automated Transmissions
Dual-clutch penetration is rising because European and Chinese automakers favor wet-clutch designs that hit sub-95 g/km CO₂ targets without full-hybrid premiums. Volkswagen’s MQB-based models deploy electro-hydraulic DQ381 units that cut parasitic drag by 12%, while Chinese brands license DCT technology to enhance 150–250 kW plug-in hybrids. Automated manuals gain share in India’s light commercial segment, where Eaton’s AutoShift trims fuel use 8–10% on urban routes. The trend reduces single-plate dry-clutch volumes but expands demand for multi-plate wet modules and electronic actuation. Suppliers that master mechatronics capture higher unit value, reinforcing competition in premium transmission tiers. A growing base of automated and dual-clutch vehicles promises steadier aftermarket demand because replacement intervals lengthen, but repair complexity and part pricing rise.
Rising Light-Vehicle Production in Emerging Economies
India, Brazil, and key ASEAN markets are collectively forecast to expand light-vehicle production, supported by growing consumer income and favorable local assembly incentives. The output surge anchors baseline clutch volumes, counterbalancing the losses of mature-market BEVs. Emerging factories also push suppliers to co-locate stamping and friction-material plants, improving lead times and currency hedging.
Stringent CO₂ Targets Driving Demand for Fuel-Efficient Clutches
EU Regulation 2019/631[1]"Regulation (EU) 2019/631 of the European Parliament and of the Council of 17 April 2019 setting CO2 emission performance standards for new passenger cars and for new light commercial vehicles, and repealing Regulations (EC) No 443/2009 and (EU) No 510/2011 (recast) (Text with EEA relevance.)," EUR-Lex, eur-lex.europa.eu imposes EUR 95 per gram penalties above 95 g/km, compelling OEMs to cut driveline friction 5-8% between 2020 and 2025. Schaeffler’s E-Clutch saves 7 g/km by removing hydraulic drag through brushless-motor actuation. China’s CAFC cap of 4 L/100 km boosts demand for higher-load sintered-bronze facings, and California’s SULEV30 limit favors dual-mass flywheels that quell three-cylinder NVH. Together, these mandates create a near-term pull for lightweight, low-loss clutch systems that bridge ICE platforms until full electrification is achieved.
Adoption of 48-V e-Clutch Systems for Mild-Hybrid Architectures
Across the first 10 months of 2025, hybrids saw a growth of 15.6%[2], and e-clutch modules enable engine-off coasting with seamless restarts. Valeo’s iBSG recuperates 25% more urban kinetic energy, while BorgWarner’s P2.5 hybrid module allows pure-EV launch to 50 km/h without disconnecting all-wheel-drive hardware. Hyundai’s dry e-clutch reduces 1.8 kg and eliminates hydraulic fluid, signaling a shift in supplier migration from hydraulics to electromechanics. Silicon content rises in every unit, opening new revenue pools for sensor and MOSFET vendors but challenging legacy master-cylinder manufacturers.
Restraints Impact Analysis*
| Restraint | (~)% Impact on CAGR | Geographic Relevance | Impact Timeline |
|---|---|---|---|
| Escalating BEV Penetration | -1.4% | Global, led by China, Europe, and California | Long term (≥ 4 years) |
| Rising Popularity of CVT Powertrains | -0.8% | Asia-Pacific mass market, selective North America segments | Medium term (2-4 years) |
| Dual-Mass-Flywheel Reliability Issues | -0.3% | Europe and North America premium segments | Short term (≤ 2 years) |
| Upcoming Copper-Free Friction-Material Mandates | -0.5% | California, Washington, and extending globally | Medium term (2-4 years) |
| Source: Mordor Intelligence | |||
Escalating BEV Penetration Eliminating Conventional Clutches
China’s approximately 25% BEV share in 2024[3]Jose Pontes, "25% of New Car Sales in China Were 100% Electric in 2024!," Clean Technica, cleantechnica.com cut 3.2 million clutch units, and Europe’s 21.7% share removed 1.8 million more. Tesla and BYD alone displaced 4.8 million assemblies, prompting Volkswagen to idle its Kassel dry-clutch line in 2025. Suppliers are redirecting R&D toward disconnect and torque-vectoring clutches for electrified drivetrains, but unit prices are 40-60% lower than those of DCT modules, thereby compressing revenue.
Rising Popularity of CVT Powertrains in Entry-Level Cars
CVT shares hit significantly in the Asia-Pacific region in 2024 as Nissan, Honda, and Subaru deployed steel-belt designs that reduce component count by 35% compared to manual transmissions. Indian automakers lifted CVT take-rates from 8% in 2020 to 22% in 2024, eroding single-plate dry-clutch volumes. CVTs favor suppliers with pulley and belt expertise, sidelining European friction-material specialists.
*Our forecasts treat driver/restraint impacts as directional, not additive. The impact forecasts reflect baseline growth, mix effects, and variable interactions.
Segment Analysis
By Transmission Type: DCT Outpaces Manual Despite Legacy Dominance
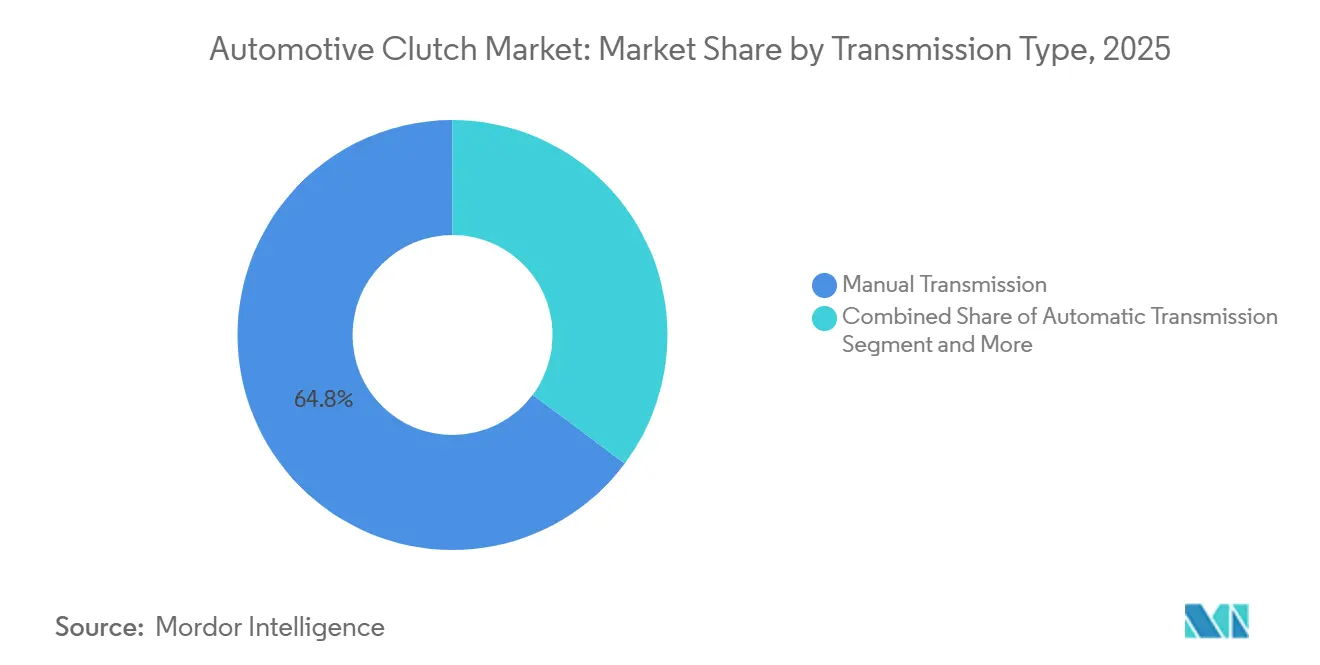
Manual transmission retained a 64.79% share of the automotive clutch market in 2025 as buyers in India, Brazil, and Southeast Asia prized its lower ex-factory cost. Yet, wet dual-clutch systems are expected to expand at a 9.37% CAGR through 2031, driven by European and Chinese plug-in hybrids that require sub-0.2-second shifts and seamless torque overlay.
Transmission preferences illustrate a bifurcated demand curve. Cost-driven emerging markets continue to favor single-plate dry clutches, which cost USD 45–60 in the aftermarket, thereby maintaining elevated volumes even as electrification gains traction elsewhere. Premium European sedans utilize EUR 2,800 wet DCT units to achieve 12% fuel savings compared to torque-converter automatics, amid diesel prices exceeding EUR 1.80 per liter. Volvo’s I-Shift-equipped trucks eliminate pedal effort, resulting in a 14% reduction in driver injury claims in Swedish fleets. The divergence preserves high-volume manual production while giving technology leaders a margin-rich DCT runway through 2031.


By Vehicle Type: Commercial Vehicles Gain Momentum
Passenger cars generated a 74.23% share of the automotive clutch market in 2025. Still, medium and heavy commercial vehicles are forecast to post the fastest growth rate of 8.02% CAGR through 2031, driven by e-commerce logistics that boost mileage and regulators nudging fleets toward automated gearboxes that minimize fatigue on daily hauls of 500 km. Ford Transit and Stellantis Ducato vans utilize LuK dual-mass flywheels, which extend service intervals to 180,000 km. Meanwhile, John Deere tests wet-clutch power-shift transmissions on high-horsepower combines for in-field ratio changes.
Commercial electrification reshapes demand. Battery-electric delivery vans eliminate clutches, whereas range-extender hybrids retain disconnect units to isolate the generators. Ashok Leyland’s Boss LX uses ZF’s Traxon AMT with a dual-plate clutch rated 1,400 Nm for 49-ton gross weights, and Caterpillar dozers specify wet multi-plate clutches to dissipate 180 kW of heat during earth-moving. This mix sustains the automotive clutch market across diverse use-cases even as passenger-car BEVs proliferate.
By Clutch Component: Actuation Systems Lead Growth
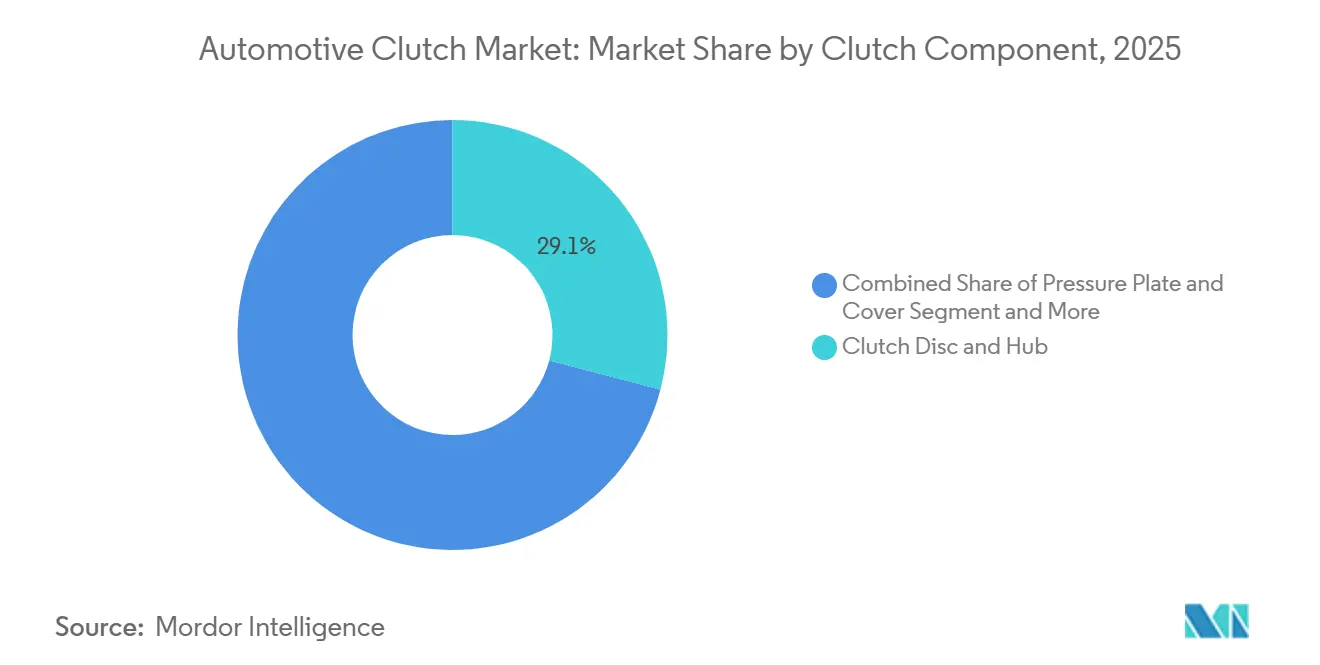
Clutch disc and hub assemblies commanded a 29.08% share of the automotive clutch market in 2025; however, actuation systems advanced at an 8.41% CAGR, as 48V e-clutch modules replace hydraulics and eliminate pedal effort. Pressure plates now use diaphragm springs that cut bearing travel by 15%, and Schaeffler’s E-Clutch ball-screw actuator raises efficiency to 92%, saving 0.2 L/100 km in WLTP tests.
Electronic actuation extends into heavy trucks via pneumatic-electronic hybrids, and concentric slave cylinders reduce hydraulic lines by 60%, thereby trimming fluid volume by 40%. Aisin’s aluminum flywheel sheds 22% inertia for quicker DCT upshifts. These updates lift average unit value, positioning actuation suppliers for outsized growth within the automotive clutch market.
By Sales Channel: Aftermarket Rises on Retrofits
OEM supply comprised an 82.45% share of the automotive clutch market in 2025; however, the aftermarket is growing at a rate of 5.79% through 2031, driven by emission upgrades in India and Brazil, which prompt taxi and ride-hail operators to replace worn friction discs with ceramic-metallic kits that can withstand the loads of turbo-diesel engines.
Different aging curves drive regional demand for services. India’s vehicle parc averages 8.2 years, with 42% of vehicles older than 10 years. In contrast, Brazil’s taxi fleet covers 180,000 km per year, quickly wearing out clutches. ZF’s Sachs Performance brand now markets sintered-bronze discs that tolerate 20% higher torque for tuners. Online availability widens reach, helping the automotive clutch market sustain aftermarket expansion despite longer OE replacement intervals on newer DCT platforms.
Geography Analysis
Asia-Pacific maintained a 49.62% share of the automotive clutch market in 2025. In China, the growing adoption of wet dual-clutch transmissions (DCTs) in plug-in hybrid SUVs is pushing up unit values. Meanwhile, in India, the dominance of manual transmissions continues to fuel a robust demand for cost-effective dry clutches. Japan sees a decline in volumes as continuously variable transmissions (CVTs) gain prominence. However, companies like EXEDY and Aisin counterbalance this dip by ramping up exports, leveraging their competitive cost structures to undercut European prices. In Southeast Asia, factories are embarking on localized initiatives, bolstered by Thailand's approval of USD 420 million in foreign direct investment (FDI) for components.
The North American automotive clutch market is primarily driven by commercial vehicles and performance cars, as the manual transmission rate in mainstream passenger models has fallen below 2%. Mexico’s premium-sedan exports sustain wet DCT volumes, and South America shows the strongest 6.82% CAGR through 2031, as Brazil’s flex-fuel hybrids pair higher-torque ethanol engines with manual gearboxes. The Middle East and Africa, with South African incentives, are drawing investment in pickup clutch assembly for sub-Saharan exports.

Regulatory Landscape
The automotive clutch market sits under whole-vehicle approval and safety regimes that increasingly extend clutch and actuation requirements into electronics, software, and cybersecurity compliance. In the European Union, the type-approval framework under Regulation (EU) 2018/858 was amended in January 2026 via Commission Delegated Regulation (EU) 2026/1808, adding requirements that incorporate Euro 7-related approval elements and automated valet parking into Annex II, which increases documentation and validation expectations for mechatronic clutch actuation used in DCTs and hybrid modules.
Globally, UNECE WP.29 regulations shape OEM sourcing requirements for electronically controlled drivetrain components, including UNECE R155 (cybersecurity) and R156 (software updates) when clutch modules include ECUs and updatable software. In the United States, NHTSA actions during March to June 2026 modernized several FMVSS items and included proposals to accommodate vehicles without manually operated driving controls, pushing performance-based validation approaches that can affect how electronically actuated clutches and integrated hybrid transmissions are tested as part of the vehicle system.
Value Chain Analysis
The automotive clutch value chain begins with inputs such as steel stampings, cast or forged housings, friction materials (organic, ceramic-metallic, and sintered variants), springs, and bearings, and it expands for DCT and e-clutch systems to include sensors, control electronics, and legacy-node semiconductors. Tier suppliers such as Schaeffler (LuK), ZF (Sachs), Valeo, F.C.C., EXEDY, BorgWarner, Eaton, and Aisin design and manufacture discs, covers, flywheels (single and dual-mass), release systems, and electro-hydraulic or electronic actuation, and then ship modules to OEM transmission plants or vehicle assembly lines, with distribution carried through aftermarket channels via wholesalers, installers, and e-commerce parts platforms.
Operational focus has shifted toward localization and resilience as logistics volatility and electronics constraints affect lead times for mechatronic clutch content. Trade flows for clutches and parts remain anchored by major exporting countries including Germany, China, and the United States, while associations such as CLEPA, MEMA, ATRA, and EUROTRANS support standardization and skills development; for example, EUROTRANS ran design-to-production training in June 2026 aimed at strengthening transmission-industry competitiveness. Bottlenecks cited across 2025 to 2026 include tight availability of legacy-node semiconductors and cross-border freight capacity on key corridors, elevating the importance of multi-sourcing, regional warehousing, and real-time supply chain visibility for clutch and actuator programs.
Competitive Landscape
The top five suppliers held a significant share of global OEM revenue in 2025, resulting in a highly concentrated profile for the automotive clutch market. Schaeffler earned 18–22% gross margins on vertically integrated dual-clutch lines, while Valeo’s merger with Vitesco expanded its 48 V e-clutch portfolio across 14 platforms. BorgWarner’s 2024 Haldex acquisition added torque-vectoring know-how, positioning the firm for electric SUV demand.
Suppliers are racing to address copper-free friction, disconnect clutches for range extenders, and torque-vectoring modules for electric crossovers. Portfolio breadth, local manufacturing, and R&D speed influence share shifts, although scale and deep OEM ties continue to favor incumbents for high-volume DCT awards.
Automotive Clutch Industry Leaders
-
Valeo SA
-
Schaeffler AG
-
EXEDY Corporation
-
Aisin Corporation
-
ZF Friedrichshafen AG
- *Disclaimer: Major Players sorted in no particular order


Market Opportunities and Future Outlook
Hybridization and the shift from purely hydraulic systems toward electromechanical actuation keep expanding the addressable content per vehicle for DCT modules, e-clutch units, and integrated hybrid transmissions that combine multiple wet clutches with electronic control. Regulatory and OEM compliance requirements tied to functional safety and WP.29 cybersecurity and software-update management reinforce demand for suppliers that can deliver validated mechatronic clutch subsystems, not just friction hardware, aligning with the move toward higher-value actuation systems.
India remains an active localization arena for automatic transmissions and related powertrain components that include clutch packs and actuation content. In January 2026, Aisin announced a JPY 32 billion investment to expand its Rohtak plant and establish a new facility in Maharashtra to localize automatic transmissions and CVTs, reflecting an installed-base shift away from manual-only configurations in a high-volume market. In July 2026, Aisin Automotive Haryana Private Limited finalized a lease for over 900,000 square feet in Shendra MIDC (Chhatrapati Sambhaji Nagar, Maharashtra) to support manufacturing for automatic transmission and related powertrain components, creating room for local Tier-2 friction materials, precision machining, and actuator sub-suppliers as transmission and clutch modules become more complex.
Recent Industry Developments
- May 2026: Schaeffler started volume production of its MultiMode dedicated hybrid transmission, integrating clutches with electric machines and power electronics. The increase in mechatronic clutch content per hybrid drivetrain shifts competitive differentiation toward system integration and validation capabilities.
- November 2025: Schaeffler announced the relocation of a clutch manufacturing line from Sheffield, UK, to Hosur, India. The transfer supports closer-to-customer supply for cost-sensitive manual and AMT applications while aligning manufacturing footprints with growth markets and localization requirements.
- November 2024: Schaeffler initiated structural measures to relocate passenger car clutch production to Szombathely, Hungary, with completion planned between 2025 and 2027. This restructuring reflects capacity rebalancing in Europe as powertrain mix changes, while protecting supply continuity for remaining ICE and hybrid programs.


Research Methodology Framework and Report Scope
Market Definition and Coverage
For this study, the automotive clutch market is defined as the revenue generated from clutches and related clutch modules used to transmit engine torque in on-road and off-highway vehicles, across OEM fitment and replacement demand, measured in current USD.
Scope exclusions: Fully battery-electric drivetrains that do not use a clutch for power transfer are kept outside the sizing.
Segmentation Overview
-
By Transmission Type
- Manual Transmission
- Automatic Transmission (Torque-Converter)
- Automated Manual Transmission (AMT)
- Dual-Clutch Transmission (DCT)
- Others (e-Clutch, CVT Clutch Packs, etc.)
-
By Vehicle Type
- Passenger Cars
- Light Commercial Vehicles
- Medium and Heavy Commercial Vehicles
- Off-Highway (Agricultural and Construction)
-
By Clutch Component
- Clutch Disc and Hub
- Pressure Plate and Cover
- Release Bearing/Slave Cylinder
- Flywheel (Single and Dual-Mass)
- Actuation Systems (Hydraulic, Electro-Hydraulic, Electronic)
-
By Sales Channel
- Original Equipment Manufacturer (OEM)
- Aftermarket
-
By Geography
-
North America
- United States
- Canada
- Rest of North America
-
South America
- Brazil
- Argentina
- Rest of South America
-
Europe
- Germany
- United Kingdom
- France
- Italy
- Spain
- Russia
- Rest of Europe
-
Asia-Pacific
- China
- India
- Japan
- South Korea
- Rest of Asia-Pacific
-
Middle East and Africa
- Saudi Arabia
- United Arab Emirates
- South Africa
- Rest of Middle East and Africa
-
North America
Data Sources, Market Sizing, and Validation
Desk Research
Desk research was used to set the hard outer boundaries of demand and to anchor the model to real-world vehicle activity. We referenced public production and registration series, transmission mix signals, and trade flows for clutch-relevant components, before assumptions were carried into the sizing model.
Sources reviewed included non-paywalled material such as OICA vehicle production data, UNECE and national transport statistics for registrations and parc indicators, U.S. EPA and EU publications that track powertrain shifts, customs import and export releases, and technical papers in SAE-style journals that describe clutch architectures and lifecycle behavior. We also used company annual reports and investor presentations for product exposure context, along with a paid subscription for company financials and another for patent and technology tracking when public disclosures were thin. These examples are illustrative only, and many other sources were used for data collection, cross-checking, and clarification.
Primary Interviews and Surveys
Primary work focused on validating what the desk inputs could not reliably show on their own, especially replacement cycles, regional price bands, and how clutch content differs by transmission type. We spoke with a mix of component suppliers, distributors, fleet and workshop voices, and vehicle ecosystem experts across major regions so assumptions could be stress-tested and adjusted before final totals were locked.
Distribution of primary research fieldwork respondents
| Company type | Respondent position | Region |
|---|---|---|
| Top tier: 34% | CXOs: 18% | APAC: 46% |
| Mid tier: 48% | Functional/Unit leaders: 39% | EMEA: 33% |
| Smaller Players: 18% | Managers: 43% | Americas: 21% |
Market-Sizing & Forecasting
Sizing starts with a top-down demand pool build that reconstructs clutch consumption from vehicle production, in-use parc behavior, and transmission mix by region, which are then translated into clutch-equivalent volumes for OEM and aftermarket. That structure is corroborated with selective bottom-up checks such as sampled price-by-region for key clutch modules, channel feedback on replacement frequency, and supplier-side sanity checks on addressable clutch categories.
Key inputs used in the model include vehicle production and assembly volumes, the split of manual, AMT, torque-converter automatic, and DCT applications, average clutch content by vehicle type, aftermarket replacement intervals tied to mileage and duty cycle, and observed price movement for clutch kits and major subcomponents (disc and hub, pressure plate, release bearing, flywheel, and actuation systems). Where local gaps exist, proxying is done using neighboring markets with similar vehicle mix and service patterns, followed by a correction factor from interviews.
For forecasting, scenario analysis is applied around transmission adoption and electrification pace, and then the yearly curve is smoothed using exponential smoothing where demand is mainly parc-led. Final growth paths are reviewed with expert consensus so the forecast stays explainable and consistent with observable vehicle and powertrain signals.
Data Validation & Update Cycle
Outputs are validated through triangulation across independent signals, including production trends, transmission penetration, and replacement-driven demand logic, and then checked for outliers by region and channel. When a variance is unusually large, the assumptions behind volumes, prices, or mix are reopened, and targeted re-contacts are triggered to confirm what changed.
Before sign-off, a second analyst reviews the calculation chain, and the narrative is aligned to the same inputs used in the model so it remains traceable. The report is refreshed annually, and interim updates are done when material events occur, with a final pre-delivery pass to ensure the latest market direction is reflected.
Mordor Intelligence's Automotive Clutch Market Size Compared Against Other Published Estimates
Published numbers for automotive clutches often differ because the scope boundary is set differently and because pricing and mix are treated in different ways across years. In practice, the split between OEM and aftermarket, the handling of DCT and AMT clutch content, and the choice of current-year currency timing can all move the stated market value.
A frequent gap driver is the way average selling prices are carried forward, since some estimates keep a flat ASP or apply a uniform inflation factor even when product mix is shifting toward higher-content systems. Another driver is refresh cadence, because a slower update cycle can miss the latest transmission share moves and regional production swings, which is why the model here rechecks FX timing and price bands close to publication before finalizing the total, a step emphasized in Mordor Intelligence.
Benchmark comparison
| Source | Market Size | Gaps in Research Methodology |
|---|---|---|
| Mordor Intelligence | USD 15.39 B (2026) | |
| Industry Publisher A | USD 14.89 B (2024) | Uses an earlier base year and a longer forecast window, and the scope appears to be shaped more by broad clutch type labels, which can understate newer clutch-content growth in DCT and AMT applications. |
| Industry Publisher B | USD 12.60 B (2022) | Anchors the series to an older starting point and reports a size that can reflect older regional price levels, which can diverge from current-year FX timing and updated OEM versus aftermarket mix. |
Overall, the spread mostly comes from timing, scope edges, and how ASP and transmission mix are updated year to year. By keeping the sizing tied to observable vehicle activity and then pressure-testing the price and mix assumptions with targeted field inputs, the resulting value is easier to replicate and to adjust when market conditions shift.


Key Questions Answered in the Report
How large is the automotive clutch market in 2026?
The automotive clutch market size stood at USD 15.39 billion in 2026 and is expected to reach USD 20.51 billion by 2031.
Which transmission type is growing fastest?
Wet dual-clutch systems are forecast to expand at a 9.37% CAGR through 2031 as OEMs seek quick shifts and lower CO₂.
Why is aftermarket demand rising?
Retrofit programs in India, Brazil, and Southeast Asia call for emission-compliant clutch kits, pushing aftermarket revenue at a 5.79% CAGR.
Which region leads clutch consumption?
Asia-Pacific commanded 49.62% revenue in 2025 thanks to high vehicle output in China and India.
What is the main threat to clutch suppliers?
Rapid battery-electric vehicle adoption removes conventional clutch assemblies, trimming the ICE replacement base in key markets.
Page last updated on:






