
Automotive Catalyst Market Size and Share
Market Overview
| Study Period | 2020 - 2031 |
|---|---|
| Market Volume (2026) | 121.66 Thousand ounces |
| Market Volume (2031) | 147.55 Thousand ounces |
| Growth Rate (2026 - 2031) | 3.91 % |
| Fastest Growing Market | Middle East and Africa |
| Largest Market | Asia Pacific |
| Market Concentration | Medium |
Major Players *Disclaimer: Major Players sorted in no particular order Image © Mordor Intelligence. Reuse requires attribution under CC BY 4.0. | |
Automotive Catalyst Market Analysis by Mordor Intelligence
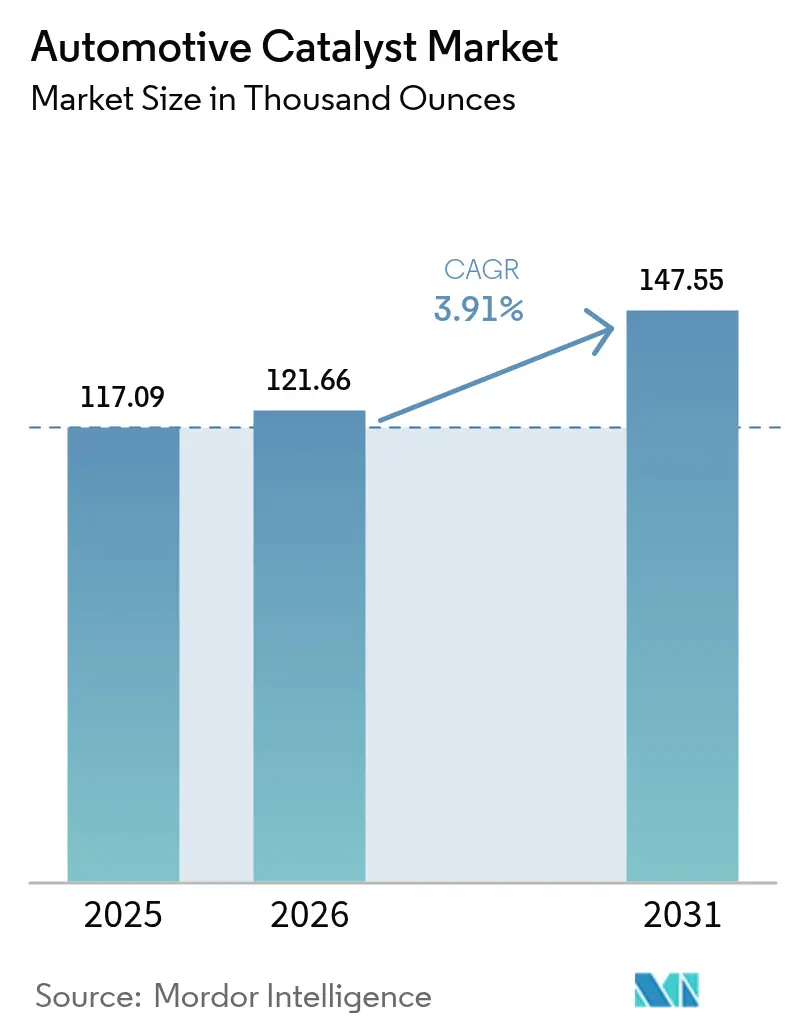
The Automotive Catalyst market size is expected to grow from 117.09 Thousand ounces in 2025 to 121.66 Thousand ounces in 2026 and is forecast to reach 147.55 Thousand ounces by 2031 at 3.91% CAGR over 2026-2031. This healthy trajectory reflects the market’s resilience as hybrid powertrains, commercial diesel fleets, and range-extender electric vehicles continue to rely on advanced aftertreatment technologies despite the wider electrification trend. Demand is reinforced by Euro 7 and US 2027 regulations that tighten particulate and nitrogen oxide limits, while precious-metal substitution strategies improve cost economics for automakers. Catalyst suppliers are also capitalizing on off-road and marine engine mandates that open new revenue streams. Collectively, these forces sustain robust volumes of palladium, platinum, and rhodium even as battery electric vehicles gain ground in select regions. The automotive catalysts market therefore retains strategic importance for both OEMs and chemical companies, serving as a critical bridge technology during the multi-decade powertrain transition.
Key Report Takeaways
- By material type, palladium held 43.85% of the automotive catalysts market share in 2025, while rhodium is projected to grow at a 4.42% CAGR to 2031.
- By vehicle type, passenger cars accounted for 58.27% share of the automotive catalysts market size in 2025, whereas heavy commercial vehicles are advancing at a 4.23% CAGR through 2031.
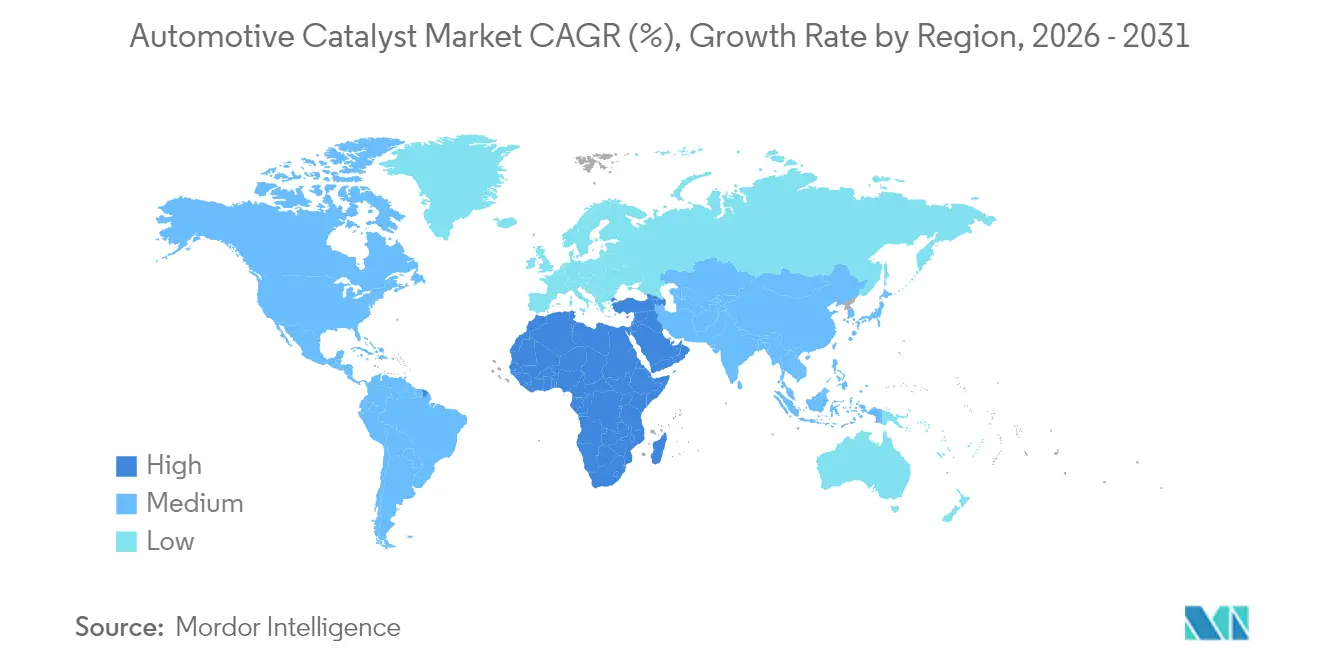
- By geography, Asia-Pacific commanded 51.45% share of the automotive catalysts market in 2025, and the Middle East and Africa region is set to post the fastest 4.63% CAGR to 2031.
Note: Market size and forecast figures in this report are generated using Mordor Intelligence’s proprietary estimation framework, updated with the latest available data and insights as of 2026.
Market Trends and Insights
Drivers Impact Analysis of Automotive Catalyst Market*
| Driver | (~) % Impact on CAGR Forecast | Geographic Relevance | Impact Timeline |
|---|---|---|---|
| Stringent Global Emission Limits Tighten Further Through Euro 7/US 2027 Rules | +1.1% | Europe, North America, with spillover to Asia-Pacific | Medium term (2-4 years) |
| Re-Acceleration of ICE-Hybrid Sales in Major Markets | +0.8% | Global, with concentration in China and Europe | Short term (≤ 2 years) |
| Platinum-For-Palladium Substitution Lowers Catalyst Cost for OEMs | +0.6% | Global, particularly North America and Europe | Medium term (2-4 years) |
| Emerging Mandates on Off-Road And Marine Engines | +0.4% | North America, Europe, with expansion to Asia-Pacific | Long term (≥ 4 years) |
| Range-Extender EV Boom Sustains PGM Demand in China and Europe | +0.3% | China, Europe, selective ASEAN markets | Medium term (2-4 years) |
| Source: Mordor Intelligence | |||
Stringent Global Emission Limits Tighten Further Through Euro 7/US 2027 Rules
Euro 7 introduces a particle-number threshold of 10 nanometers and enforces on-board monitoring capable of flagging emission exceedances at 2.5 times the limit. Diesel light-duty vehicles must add close-coupled SCR-coated filters, electric heaters up to 4 kW, and ammonia-slip catalysts. These upgrades enlarge catalyst volumes by nearly 2.8 times versus Euro 6 systems and extend required durability to 160,000 km, driving higher precious-metal demand and more complex aftertreatment architectures[1]“Particle-Number Limits and Catalyst Sizing under Euro 7,” Emission Control Science and Technology, emissioncontrolst.com .
Re-Acceleration of ICE-Hybrid Sales in Major Markets
China’s plug-in hybrid sales surged 84% year-over-year in 2024 to 4.3 million units, while European consumers increasingly purchase range-extender models that offset charging gaps. Hybrid layouts necessitate conventional three-way catalysts alongside rapid light-off formulations that tolerate frequent thermal cycling. Thailand and other ASEAN markets are offering investment incentives for hybrid assembly, reinforcing regional demand for compliant catalyst systems.
Platinum-For-Palladium Substitution Lowers Catalyst Cost for OEMs
A USD 1,150 price gap between palladium and platinum in 2024 enabled OEMs to cut per-vehicle catalyst costs by up to 20%. Bimetallic designs leverage platinum’s thermal stability and palladium’s oxidation efficiency, while single-atom dispersion methods from Johnson Matthey reduce overall loading by 30% without performance loss. The strategy also mitigates supply risk as 80% of palladium mining stems from Russia and South Africa.
Emerging Mandates on Off-Road and Marine Engines
California Tier 5 regulations effective 2025 require construction and farm machinery to install particulate filters and SCR units similar to highway vehicles. EPA Tier 4 marine standards extend to vessels above 600 kW, demanding sulfur-resistant catalysts that operate across broad temperature windows. Stage V rules in Europe add analogous requirements for non-road mobile machinery. Collectively, these programs could raise demand by 15-20% of today’s automotive catalyst volumes.
Restraints Impact Analysis of Automotive Catalyst Market*
| Restraint | (~) % Impact on CAGR Forecast | Geographic Relevance | Impact Timeline |
|---|---|---|---|
| Rapid BEV Cost-Parity Squeezes Future ICE Volumes | -0.7% | Global, with acceleration in Europe and China | Medium term (2-4 years) |
| OEM Thrifting and Zoned Catalyst Designs Cut PGM Grams/Vehicle | -0.5% | Global, led by North American and European OEMs | Short term (≤ 2 years) |
| Russia–Ukraine Supply Sanctions Disturb PGM Trade Flows | -0.4% | Global, with acute impact on European and North American OEMs | Short term (≤ 2 years) |
| Source: Mordor Intelligence | |||
Rapid BEV Cost-Parity Squeezes Future ICE Volumes
Tesla reduced Model 3 production cost to USD 28,000 in 2024, erasing much of the traditional price gap with ICE sedans. EU fleet CO2 penalties at EUR 95 per gram above target could total EUR 16 billion in 2025, incentivizing automakers to pivot faster toward battery models. China already achieved a 35% BEV market share in 2024, illustrating how policy and cost trajectories can suppress long-term catalyst demand.
OEM Thrifting and Zoned Catalyst Designs Cut PGM Grams/Vehicle
Automakers now deploy computational modeling to concentrate precious metals only in hot zones, while integrating electrically heated catalysts to speed light-off. Cummins reported a 30% reduction in PGM loading using single-can SCR-DPF systems. Atomic-layer deposition and 3D-printed substrates further multiply surface area, enabling equal performance with fewer metals and lowering orders for suppliers.
*Our forecasts treat driver/restraint impacts as directional, not additive. The impact forecasts reflect baseline growth, mix effects, and variable interactions.
Automotive Catalyst Market Segment Analysis
By Material Type:
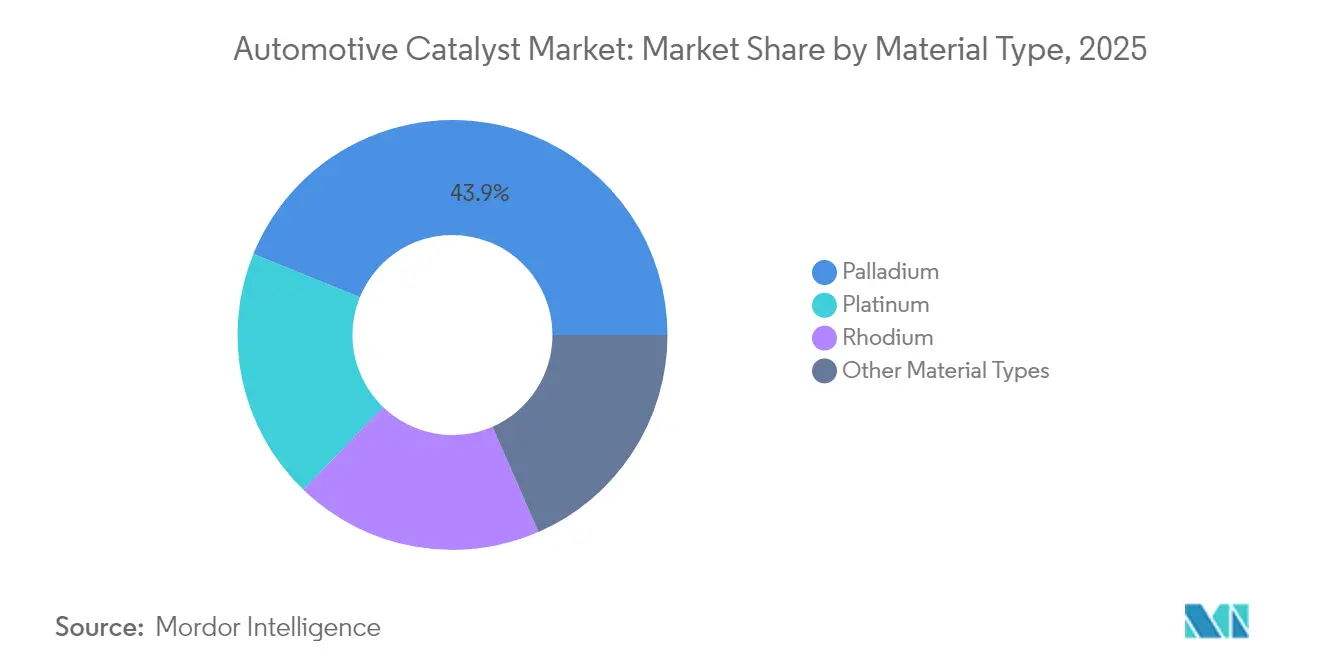
Rhodium Drives Premium PerformanceRhodium plays an irreplaceable role in lowering NOx on gasoline three-way catalysts and is forecast to grow at a 4.42% CAGR to 2031. The automotive catalysts market size for rhodium therefore rises faster than any other precious metal as Euro 7 demands simultaneous reduction of all regulated pollutants. Palladium remains the volume leader due to its 43.85% share in 2025, yet price volatility and sanctions risk encourage OEMs to diversify toward platinum. Platinum’s uptake in gasoline platforms is renewing because its average 2024 spot price was 55% lower than palladium, supporting multiple platinum substitution programs. The automotive catalysts market share held by niche base-metal or zeolite promoters is small but growing as suppliers commercialize atom-efficient designs that slash precious-metal dependence without compromising durability.
The shift from conventional washcoats to single-atom and bimetallic architectures enables a potential 90% reduction in precious-metal use per catalyst. Johnson Matthey and BASF are piloting production lines that embed isolated platinum atoms in ceria-zirconia matrices, creating more active sites per gram. At the same time, rhodium recycling rates have improved through closed-loop partnerships with auto shredder operators, easing supply tightness. Collectively, these actions stabilize the automotive catalysts market even under long-term electrification scenarios.


By Vehicle Type:
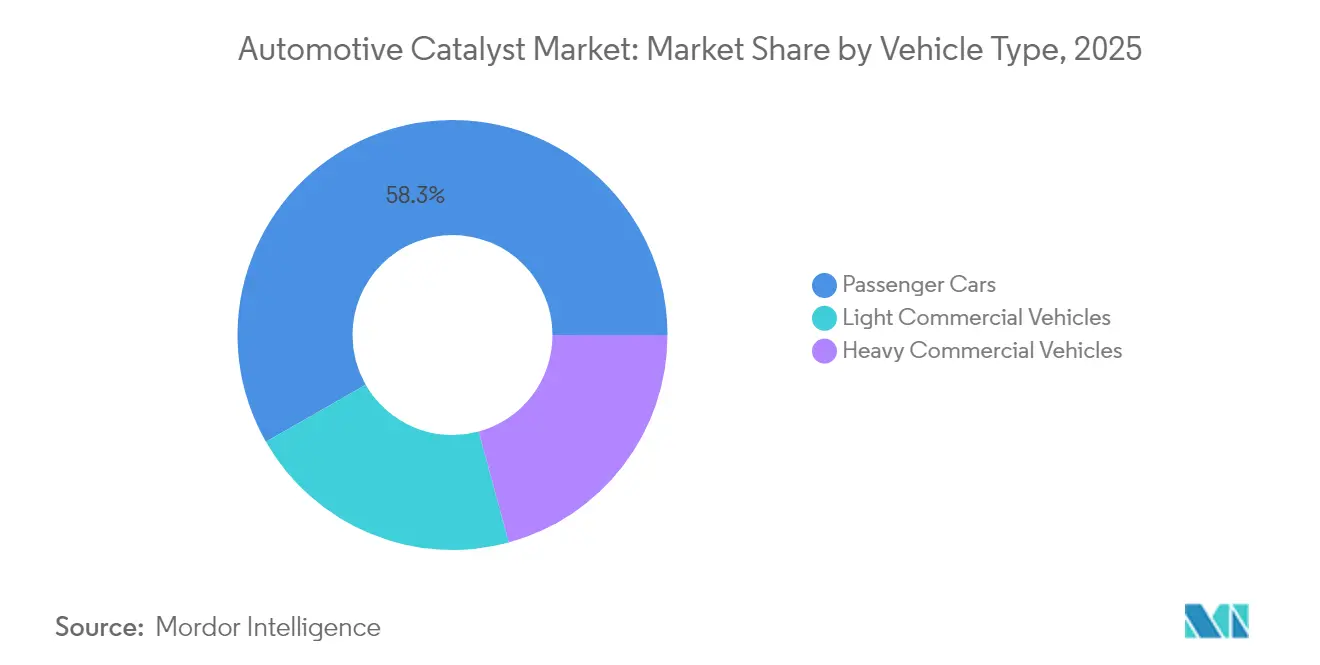
Commercial Segments Accelerate GrowthHeavy commercial vehicles are expected to post the quickest 4.23% CAGR through 2031 as global freight demand collides with rigorous diesel standards. A typical heavy-duty truck SCR system requires 15-20 liters of catalyst, dwarfing the 2-3 liters installed on a passenger car. Consequently, the automotive catalysts market size tied to commercial vehicles grows faster than the underlying truck build rate. Passenger cars still control 58.27% of total volume in 2025 because hybrids keep three-way catalysts relevant across mainstream segments. Light commercial vehicles show steady expansion as e-commerce magnifies parcel delivery needs and fleets gravitate toward hybrids for range and payload optimization.
Commercial fleets also generate a lucrative aftermarket because operators retain vehicles for 10-15 years, extending replacement cycles for coated substrates. Dual-SCR layouts, ammonia-slip catalysts, and electric heater modules raise component value per vehicle. Off-road equipment and marine vessels further diversify demand, with California Tier 5 and EPA marine rules adding sizable catalyst modules for bulldozers, harvesters, and coastal freighters. These factors together secure a multi-decade runway for the automotive catalysts market despite rising BEV penetration.
Geography Analysis
APAC Automotive Catalyst Market
Asia-Pacific contributed 51.45% of the automotive catalysts market in 2025. China produced 30.2 million vehicles, and plug-in hybrids grew 84% during the year, ensuring solid uptake of three-way and SCR systems. Local suppliers often partner with global firms to integrate advanced washcoats while maintaining cost competitiveness. India is scaling vehicle output rapidly, aided by government initiatives that encourage domestic catalyst manufacturing clusters. Japan and South Korea provide cutting-edge R&D, while ASEAN incentives sustain hybrid assembly volumes.
North America Automotive Catalyst Market
North America represents a mature yet opportunity-rich arena. EPA Tier 3 rules force automakers to maintain high catalyst performance, and robust recycling infrastructure feeds palladium and platinum back into the circular economy. Mexico’s production growth anchors localized substrate coating operations that shorten supply chains and cut lead times. Canada’s cold winters impair battery range, preserving internal-combustion usage in many regions and keeping catalysts on the bill of materials through the forecast horizon.
EMEA and South America Automotive Catalyst Market
Europe faces a 2035 new-vehicle ICE ban but near-term demand is buoyed by Euro 7 rollouts. Advanced recycle plants in Belgium and Germany recover up to 95% of spent precious metals, reinforcing regional self-sufficiency. Hybrid models prolong catalyst relevance even in markets with the highest BEV uptake. The Middle East and Africa automotive catalysts market is on track for a 4.63% CAGR thanks to Morocco’s 582,000-unit 2023 output and Saudi industrial investments of USD 2.9 billion. South Africa remains a major export hub although BEV momentum in Europe could dilute long-haul catalyst shipments in later years. South America grows more modestly given macroeconomic headwinds, but Brazil and Argentina still underpin regional substrate demand.

Value Chain Analysis
The value chain starts with sourcing platinum group metals (PGMs) and other required inputs, followed by refining and precursor chemical production (salts, chlorides, and organometallics). Suppliers then formulate washcoats and coat these onto ceramic or metallic substrates. The coated substrates are assembled into converter and aftertreatment modules, including close-coupled and underfloor architectures, and in diesel systems, SCR-coated filters and ammonia-slip catalysts, before shipment to OEMs and Tier-1 exhaust suppliers for vehicle integration and homologation testing.
The aftermarket and end-of-life loop is also central to commercial viability. Spent catalyst collection, decanning, sampling, and smelting or refining return PGMs back into the supply pool, helping reduce reliance on concentrated primary mine supply. This closed-loop approach supports supply resilience as OEMs and catalyst makers manage volatility through platinum-for-palladium substitution, bimetallic formulations, and lower-grams-per-vehicle designs. At the same time, compliance-driven system complexity, tied to Euro 7 and US 2027 timelines referenced in the report context, increases technical content per unit and raises quality and traceability requirements across the chain.
Competitive Landscape
Johnson Matthey, BASF, and Umicore collectively control approximately 60% automotive catalysts market share. Their integrated business models span precious-metal leasing, formulation, substrate coating, and end-of-life recycling, creating scale advantages and high switching costs for OEMs. Honeywell’s USD 2.4 billion agreement to purchase Johnson Matthey’s Catalyst Technologies unit will add process-technology licensing to Honeywell’s existing controls portfolio, potentially reshaping competitive dynamics from 2026 onward.
Technology leadership surrounds single-atom dispersion, washcoat porosity optimization, and sensor-embedded substrates that provide real-time data to engine controllers. Smaller firms such as CDTi Advanced Materials and Ecocat India leverage regional proximity or niche chemistries to serve customers outside the scope of multinationals. Sustainability performance is now integral. Umicore reports 95% precious-metal recovery rates and low-carbon refining powered by renewable energy, aligning with OEM decarbonization audits. Companies are also scaling pilot lines for ammonia-slip catalysts able to meet Euro 7 cold-start limits without over-dosing urea.
Market participants are responding to OEM thrifting by launching efficacy guarantees tied to precious-metal load grams. Suppliers that achieve equal tailpipe numbers with lower platinum-group metals earn volume commitments and early-program awards. As BEV volumes rise, catalyst businesses hedge exposure by expanding into hydrogen combustion, fuel-cell membrane coating, and industrial emissions control, positioning themselves for long-term growth beyond the roadway segment.
Automotive Catalyst Industry Leaders
BASF SE
Johnson Matthey
Umicore
CATALER CORPORATION
Forvia SE
- *Disclaimer: Major Players sorted in no particular order

Automotive Catalyst Market Companies Covered in this Report
- BASF SE
- CATALER CORPORATION
- CDTi Advanced Materials Inc.
- Clariant
- Cummins Inc.
- DCL International Inc.
- Ecocat India Pvt Ltd.
- Forvia SE
- Heraeus Precious Metals
- INTERKAT Catalyst GmbH
- Johnson Matthey
- Klarius Group Ltd.
- N.E. CHEMCAT CORPORATION
- Solvay
- Tenneco Inc.
- Umicore

Market Opportunities and Future Outlook
In the near term, whitespace is concentrated in higher-content aftertreatment designed for tighter particulate and NOx control. Euro 7-type requirements drive added components such as close-coupled SCR-coated filters and ammonia-slip catalysts, alongside durability and monitoring requirements that increase testing burden and formulation sophistication. Off-road and marine mandates cited in the report context, including California Tier 5 effective 2025 and EPA marine Tier 4 coverage above 600 kW, broaden the served addressable base for catalyst and coated-filter modules beyond on-road light duty. That creates room for suppliers with diesel systems know-how, sulfur-resistant chemistries, and packaging expertise.
Manufacturing and formulation innovation also supports opportunities to offset OEM thrifting and precious-metal volatility without sacrificing performance. In March 2026, BASF commissioned an industrial-scale production plant for 3D-printed catalysts at Ludwigshafen, pointing to geometry-driven performance gains and more efficient catalyst usage. In parallel, DOE-funded research referenced in the evidence pack describes demonstrations of substantial palladium and rhodium loading reductions in three-way catalysts through process and support engineering, reinforcing supplier focus on atom-efficient architectures and recycling-backed sourcing as differentiators for OEM program awards.
Recent Industry Developments in Automotive Catalyst Market
- May 2026: Johnson Matthey announced the acquisition of CORMETECH Inc. for an enterprise value of USD 360 million, adding selective catalytic reduction (SCR) catalyst manufacturing capability in stationary emissions control. The acquisition broadens its catalyst portfolio beyond on-road automotive applications and deepens exposure to SCR technologies that share material science and production linkages with vehicle aftertreatment.
- April 2025: Tenneco Inc. received a strategic investment from Apollo Fund X for its Clean Air and Powertrain businesses to accelerate growth while maintaining operational independence. The financing supports continued product development and program execution in emissions control, reinforcing competitive intensity among Tier-1 exhaust and catalyst system suppliers.
- August 2024: BASF inaugurated a Research, Development, and Application laboratory in Chennai, Tamil Nadu, at its Mahindra World City site to develop automotive emissions control catalysts for the Indian market. The facility strengthens local development and customer collaboration as emissions standards tighten and OEMs increase localization of compliant aftertreatment solutions.


Automotive Catalyst Market Report Scope and Research Methodology
Market Definition and Coverage
This market covers automotive exhaust catalysts used to reduce regulated tailpipe emissions, counted across vehicle production and the installed base where replacement demand exists. Sizing is expressed as catalyst demand volume, measured in ounces, across major vehicle categories and key regions.
Scope exclusions: It excludes non-automotive emission catalysts used in industrial processes, power generation, marine, and other stationary or non-road applications.
Segments Covered in This Report
- By Material Type
- Palladium
- Platinum
- Rhodium
- Other Material Types
- By Vehicle Type
- Passenger Cars
- Light Commercial Vehicles
- Heavy Commercial Vehicles
- By Geography
- Asia-Pacific
- China
- India
- Japan
- South Korea
- ASEAN Countries
- Rest of Asia-Pacific
- North America
- United States
- Canada
- Mexico
- Europe
- Germany
- United Kingdom
- France
- Italy
- Russia
- NORDIC Countries
- Rest of Europe
- South America
- Brazil
- Argentina
- Rest of South America
- Middle East and Africa
- Saudi Arabia
- South Africa
- Rest of Middle East and Africa
- Asia-Pacific
Data Sources, Market Sizing, and Validation
Desk Research
Desk research starts by mapping the demand pool using public vehicle production and parc signals, followed by emissions rule timelines that drive catalyst loading and replacement behavior. For this market, sources such as OICA vehicle production releases, US EPA and EU regulation publications, UN Comtrade trade statistics for relevant exhaust parts, and peer-reviewed catalysis and emissions-control papers help anchor the model inputs.
We also review company annual reports and investor presentations for demand commentary, capacity updates, and regional mix, then cross-check big step changes against reputable press coverage and trade association updates. Where needed, paid subscriptions are used for company financials and intelligence, patent databases, and shipment-level import and export views to sanity-check directional movement. The desk sources listed above are illustrative, and many other public references were used during data collection, validation, and clarification.
Primary Interviews and Surveys
Primary interviews and surveys are used to validate catalyst demand drivers and convert desk signals into practical assumptions that match how the market is behaving. We speak with catalyst and substrate suppliers, emissions-system stakeholders, recyclers, and vehicle ecosystem experts across APAC, EMEA, and the Americas. The input is then used to close gaps on loadings, replacement cycles, and the near-term production outlook.
Distribution of primary research fieldwork respondents
| Company type | Respondent position | Region |
|---|---|---|
| Top tier: 32% | CXOs: 18% | APAC: 44% |
| Mid tier: 50% | Functional/Unit leaders: 31% | EMEA: 36% |
| Smaller Players: 18% | Managers: 51% | Americas: 20% |
Market-Sizing & Forecasting
Sizing is built using a top-down demand reconstruction that starts with vehicle production, the on-road parc, and emissions-standard adoption, which are then translated into catalyst ounces through typical loading factors by fuel and vehicle class. To keep the totals realistic, we corroborate the outcome with selective bottom-up approximations, such as sampled ounce-per-vehicle checks, channel feedback on replacement volumes, and sanity checks against regional supply availability.
A few practical inputs that shape the model include annual light and heavy vehicle production, the gasoline versus diesel mix by region, the timing of tightening standards (such as Euro 7 type milestones), and the average replacement interval in the aftermarket. Where gaps exist in public indicators, assumptions are filled using interview consensus and then tested against adjacent signals like catalytic-system trade flows and changes in hybrid penetration, since hybrids still need exhaust aftertreatment.
For forecasting, scenario analysis is used so the outlook can reflect different paths for ICE and hybrid production, regulatory enforcement, and scrappage rates. Final forecast movement is adjusted only after the short list of variables is rechecked for internal consistency and for whether the direction matches what practitioners are seeing on the ground.
Data Validation & Update Cycle
Validation is done by comparing outputs against independent indicators, including vehicle build trends, policy timelines, and observed shifts in regional emissions hardware demand, before numbers are finalized. Outliers are reviewed, drivers are re-tested, and any large variances trigger a second look at loadings, region splits, and conversion factors.
A multi-step analyst review is followed so calculation logic and assumptions stay traceable, and follow-up outreach is done when interview feedback conflicts with desk signals. Reports are refreshed annually, with interim updates when material events occur, and a final pre-delivery pass is completed so clients receive the latest view.
Mordor Intelligence's Automotive Catalyst Market Sizing Compared With Other Published Estimates
Published market sizes for automotive catalysts can differ widely because each publisher chooses its own units, inclusions, and update timing, and those choices shift the total even when the theme is similar. Some studies report revenue, others report physical demand, and the conversion between the two is not consistent because metal prices and loadings move quickly.
The main gap comes from value-versus-volume treatment and converter scope, where Mordor Intelligence sizes the market in ounces tied to catalyst demand signals rather than converting into USD using assumed metal prices and blended ASPs that can swing by year and region.
Benchmark comparison
| Source | Market Size | Gaps in Research Methodology |
|---|---|---|
| Mordor Intelligence | USD 0.12 M (2026) | |
| Industry Research Publisher A | USD 89.60 B (2024) | Reported as revenue and appears to mix catalyst and catalytic converter value, so results depend heavily on assumed PGM pricing, OEM versus aftermarket splits, and currency timing rather than ounces demanded. |
| Market Publisher B | USD 15.60 B (2024) | Uses a USD revenue lens and may apply standardized ASP progression and channel shares, which can understate or overstate totals when loadings, regulation-driven designs, and regional mix shift during the base year. |
The spread in the table is mainly explained by unit choice and what is being priced, since ounces-based demand does not translate cleanly into revenue without a full set of metal price and formulation assumptions. By keeping the model anchored to vehicle output, emissions rule adoption, and practical loading factors, we keep the estimate easier to audit and simpler to update when market conditions change.


Key Questions Answered in the Report
What is the current market size of automotive catalysts?
The current market size of automotive catalysts is estimated at 121.66 thousand ounces and forecast to reach 147.55 thousand ounces by 2031.
Which metal currently dominates catalyst formulations?
Palladium led with 43.85% share of total ounces in 2025, although platinum substitution is rising.
Which vehicle segment will grow fastest through 2031?
Heavy commercial vehicles are expected to expand at a 4.23% CAGR owing to stricter diesel rules and larger catalyst volumes.
How will Euro 7 regulations influence catalyst demand?
Euro 7 imposes lower particle-number thresholds and on-board monitoring, increasing catalyst size and precious-metal loading especially in diesel applications.
Page last updated on:


 Your data is secure and never sold or shared.


