
Automotive Bushing Market Size and Share
Market Overview
| Study Period | 2020 - 2031 |
|---|---|
| Market Size (2026) | USD 180.43 Billion |
| Market Size (2031) | USD 226.1 Billion |
| Growth Rate (2026 - 2031) | 4.62 % |
| Fastest Growing Market | Asia Pacific |
| Largest Market | Asia Pacific |
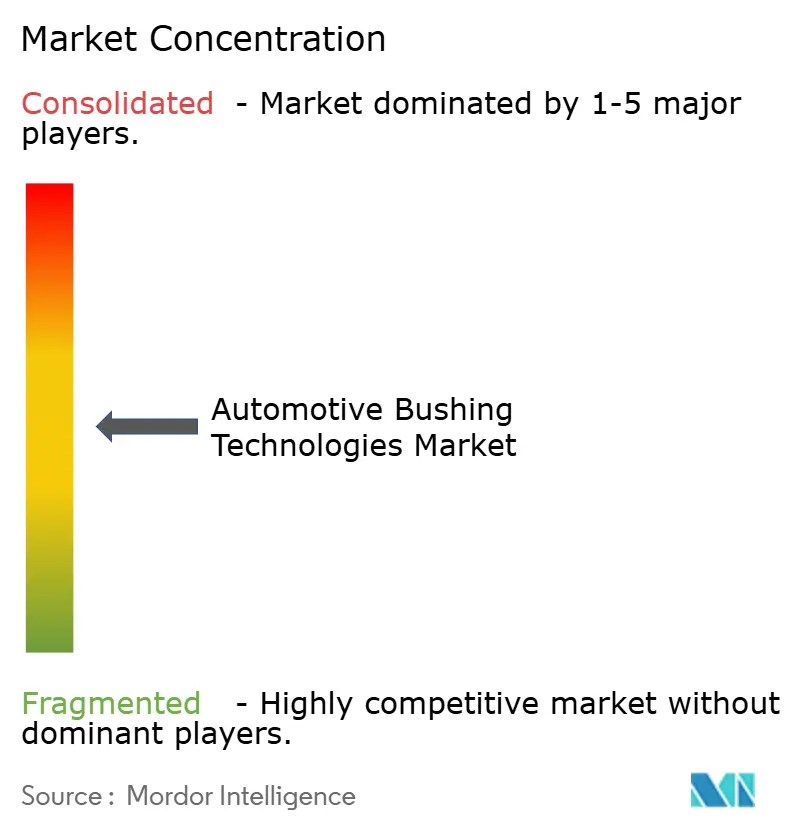
| Market Concentration | Medium |
Major Players
*Disclaimer: Major Players sorted in no particular order Image © Mordor Intelligence. Reuse requires attribution under CC BY 4.0. |
|
Automotive Bushing Market Analysis by Mordor Intelligence
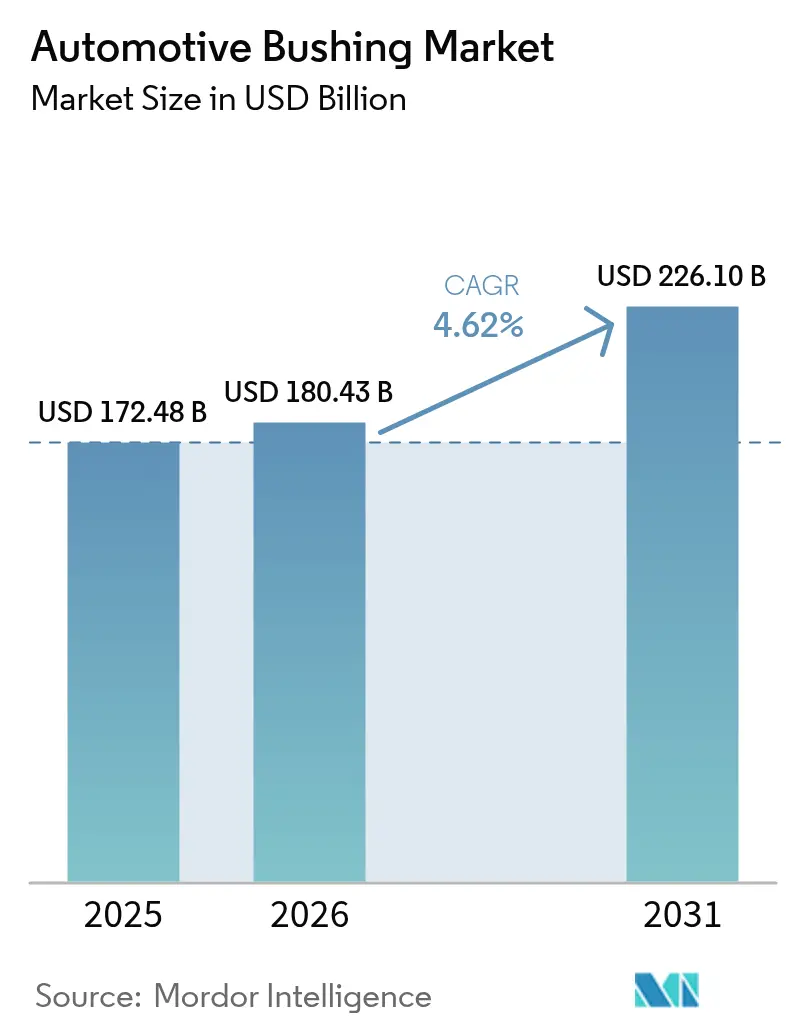
The automotive bushing market size is expected to grow from USD 172.48 billion in 2025 to USD 180.43 billion in 2026 and is forecast to reach USD 226.1 billion by 2031 at 4.62% CAGR over 2026-2031. Rising electrification is reshaping vehicle chassis requirements, pushing suppliers to develop lightweight, multi-material bushings that manage battery mass, reduce noise, and cope with higher thermal loads. Passenger-car programs underpin volume demand, while battery-electric platforms create the steepest growth curve for bespoke solutions. Suspension applications hold sway because automakers link ride comfort and handling precision more closely to brand value. On the supply side, raw-material volatility and a looming natural rubber deficit force procurement diversification and greater use of polyurethane and bio-based polymers. Competitive intensity remains moderate as tier-one suppliers invest in sensor integration and strategic partnerships to secure electrified platforms.
Key Report Takeaways
- By vehicle type, passenger cars captured 60.86% of the automotive bushing technologies market share in 2025; passenger cars expand at a 7.52% CAGR to 2031.
- By application, suspension system bushings accounted for 45.21% of the automotive bushing technologies market size in 2025, and transmission and driveline bushings are advancing at a 8.76% CAGR through 2031.
- By material, natural rubber led with 52.67% of the automotive bushing technologies market share in 2025, while polyurethane registers the fastest 9.18% CAGR to 2031.
- By sales channel, OEMs held a 68.62% of the automotive bushing technologies market share in 2025, whereas the aftermarket recorded a stronger 9.74% CAGR to 2031.
- By electric vehicle type, battery electric vehicles held a 46.55% of the automotive bushing technologies market share and recorded the fastest growth of 7.28% CAGR through 2031.
- By geography, Asia-Pacific commanded a 46.05% of the automotive bushing technologies market share in 2025 and is growing at a 5.63% CAGR through 2031.
Note: Market size and forecast figures in this report are generated using Mordor Intelligence’s proprietary estimation framework, updated with the latest available data and insights as of 2026.
Market Trends and Insights
Drivers Impact Analysis of Automotive Bushing Market*
| Driver | (~) % Impact on CAGR Forecast | Geographic Relevance | Impact Timeline |
|---|---|---|---|
| Surging EV and Hybrid Volumes Requiring Bespoke Bushings | +1.5% | Asia-Pacific Core, Spill-Over to Europe and North America | Long Term (≥ 4 Years) |
| Increasing Global Light-Vehicle Production Rebound | +1.2% | Global, with Strongest Impact in Asia-Pacific and North America | Medium Term (2–4 Years) |
| OEM Focus on NVH Reduction for Ride Comfort | +0.9% | Global, Particularly Premium Segments in Europe and North America | Long Term (≥ 4 Years) |
| Shift to Lightweight Multi-Material Bushings for Battery-Heavy Vehicles | +0.8% | Global, Led by EV Manufacturing Hubs in China, Europe, and North America | Medium Term (2–4 Years) |
| Use of Recyclable or Bio-Based Materials in Bushing Manufacturing | +0.6% | Europe Leading, Followed by North America and Select Asia-Pacific Markets | Long Term (≥ 4 Years) |
| Embedded Health-Sensor Bushings Enabling Predictive Aftermarket Sales | +0.4% | North America and Europe Initially, Expanding to Asia-Pacific | Long Term (≥ 4 Years) |
| Source: Mordor Intelligence | |||
Surging EV and Hybrid Volumes Requiring Bespoke Bushings
Electric vehicle adoption is accelerating globally, with China leading in new vehicle sales being electrified in 2024, while the battery electric vehicle market share is projected to rise globally in 2024. This transition demands specialized bushing solutions to address unique challenges, including increased vehicle weight from battery packs, altered weight distribution, and different vibration characteristics compared to internal combustion engines. Electric vehicles contain significantly more plastics and polymer composites than traditional vehicles, with a mid-size EV potentially containing 450 pounds of plastics compared to 426 pounds in average vehicles, indicating substantial opportunities for advanced bushing materials[1]"Chemistry and Automobiles Driving the Future", American Chemistry Council, americanchemistry.com.. The chemistry value in EVs is estimated to be 85% higher than in internal combustion engine vehicles, reflecting the premium pricing potential for specialized bushing technologies. ASEAN markets are witnessing a surge in Chinese OEM investments in electric vehicle production, with companies like BYD and Chery establishing manufacturing facilities that will drive regional demand for EV-specific bushing solutions.
Increasing Global Light-Vehicle Production Rebound
Global automotive production recovery is creating sustained demand for bushing technologies, though the trajectory remains cautious with modest growth projections. Global vehicle sales growth, influenced by high vehicle prices and consumer debt levels. The recovery pattern varies significantly by region, with Sub-Saharan Africa expected to outperform at 4.7% growth while North America and MENA regions lag at 2.4% each. This uneven recovery creates opportunities for bushing suppliers to optimize regional capacity allocation and develop market-specific product portfolios. The production rebound benefits suspension and chassis bushing segments, as automakers prioritize vehicle dynamics and comfort features to justify premium pricing in a cost-conscious market environment.
OEM Focus on NVH Reduction for Ride Comfort
The transition to electric powertrains has fundamentally altered noise-vibration-harshness management requirements, creating new opportunities for advanced bushing technologies. Electric vehicles eliminate engine noise masking, making drivetrain and road noise more prominent, which demands sophisticated vibration isolation solutions throughout the vehicle architecture[2]Krisztián Horváth, "Simulating Noise, Vibration, and Harshness Advances in Electric Vehicle Powertrains: Strategies and Challenges", MDPI, mdpi.com. . Covestro's polyurethane solutions demonstrate this trend, offering lightweight, eco-friendly materials with porous structures optimized for sound absorption and low-density designs that enhance overall vehicle comfort. The shift creates competitive advantages for suppliers developing multi-functional bushings that combine traditional vibration isolation with acoustic management capabilities. This trend particularly benefits premium vehicle segments where manufacturers differentiate through superior ride quality, driving demand for high-performance bushing materials and designs that can address the unique NVH challenges of electric powertrains.
Shift to Lightweight Multi-Material Bushings for Battery-Heavy Vehicles
The automotive industry's weight reduction imperative drives innovation in bushing materials and design, particularly for electric vehicles, where every kilogram impacts range and performance. Research demonstrates that composite leaf springs can achieve 40% weight reduction compared to steel alternatives while providing superior damping properties and reduced force transmission to the vehicle chassis. SABIC's thermoplastic solutions for electric vehicle applications can reduce component weight by 30-50% compared to traditional materials, with their EV battery pack concept integrating lightweight thermoplastics to enhance performance and reduce costs[3]"SABIC Advances Thermoplastic Solutions for Critical EV Battery Technologies", SABIC, sabic.com.. The trend toward multi-material bushings combines the benefits of different materials within single components, such as metal cores for structural integrity with polymer outer layers for vibration isolation and weight reduction. This approach enables manufacturers to optimize performance characteristics while meeting stringent weight targets essential for electric vehicle efficiency and range requirements.
Restraints Impact Analysis of Automotive Bushing Market*
| Restraint | (~) % Impact on CAGR Forecast | Geographic Relevance | Impact Timeline |
|---|---|---|---|
| Raw-Material Price Volatility (Synthetic Rubber / PU) | -0.7% | Global, with Highest Impact in Asia-Pacific Manufacturing Hubs | Short Term (≤ 2 Years) |
| Regulatory Scrutiny on Micro-Plastic Shedding from Rubber Parts | -0.4% | Europe and North America, Expanding Globally | Long Term (≥ 4 Years) |
| Adoption of Maintenance-Free Solid Mounts in Performance Vehicles | -0.3% | North America and Europe Premium Segments | Medium Term (2–4 Years) |
| Increasing Environmental Regulations on Automotive Component Waste | -0.2% | Europe, North America, and Asia-Pacific | Medium Term (2–4 Years) |
| Source: Mordor Intelligence | |||
Raw-Material Price Volatility (Synthetic Rubber / PU)
Global rubber supply constraints are creating significant cost pressures across the automotive bushing supply chain, with a looming rubber shortfall expected in 2025 due to stagnant output from major producing regions. The Thai rubber industry, a major global supplier, faces challenges from labor shortages, disease outbreaks, and geopolitical tensions affecting input costs, despite projected growth driven by automotive sector demand. Synthetic rubber markets are experiencing additional pressure from US tariffs affecting tire manufacturers, with 25% tariffs on imports complicating supply chains for SBR-based products, particularly from Europe and Indonesia. The volatility particularly impacts smaller bushing manufacturers with limited hedging capabilities and forces strategic decisions about material substitution and supply chain diversification.
Regulatory Scrutiny on Micro-Plastic Shedding from Rubber Parts
Environmental regulations are intensifying focus on micro-plastic emissions from automotive components, with Euro 7 regulations introducing limits on particle emissions from brakes and tires effective November 2026 for new passenger cars and light commercial vehicles. The United States Environmental Protection Agency has finalized amendments to National Emission Standards for Hazardous Air Pollutants for rubber tire manufacturing, establishing emission limits for total hydrocarbons and filterable particulate matter that will require additional control devices and impact operational costs. The tire industry consortium has released a preliminary analysis identifying five potential alternatives to 6PPD in tires following California's Safer Consumer Product Regulations, indicating the regulatory pressure extending to bushing materials. This regulatory environment creates compliance costs and drives research into alternative materials, potentially favoring suppliers with advanced material science capabilities and sustainable product portfolios. The scrutiny particularly affects natural and synthetic rubber segments, creating opportunities for thermoplastic and bio-based alternatives with lower environmental impact.
*Our forecasts treat driver/restraint impacts as directional, not additive. The impact forecasts reflect baseline growth, mix effects, and variable interactions.
Automotive Bushing Market Segment Analysis
By Vehicle Type:
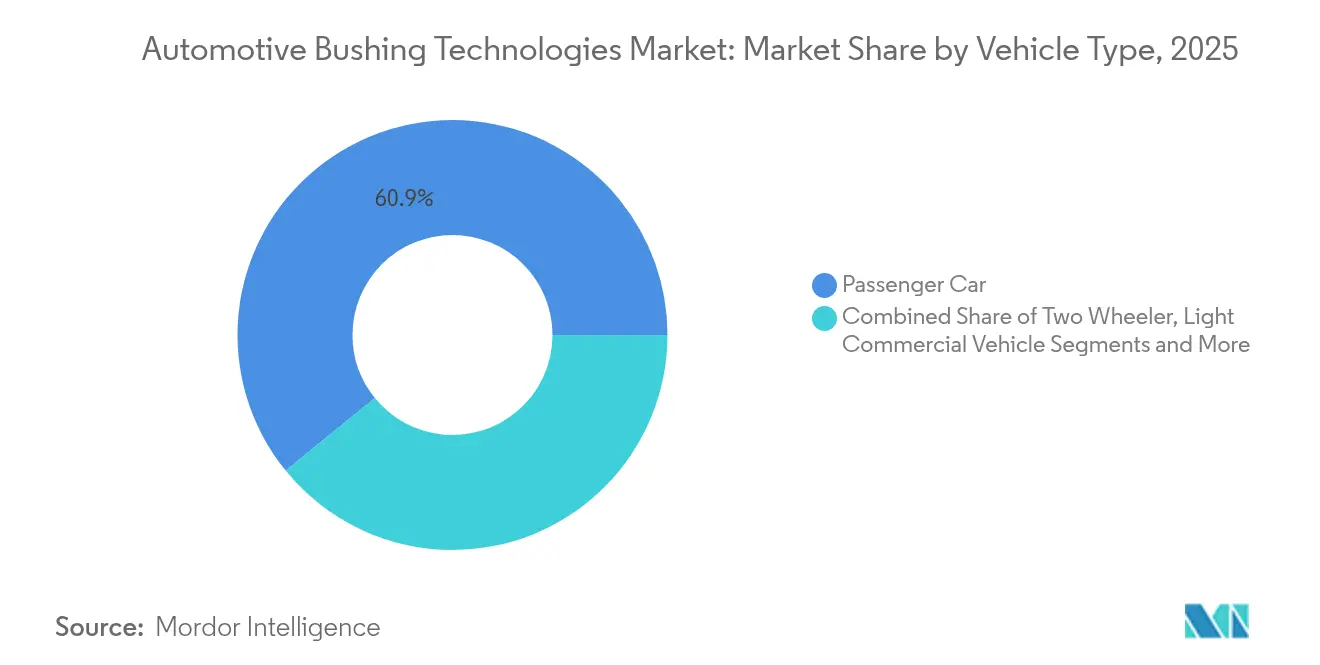
Passenger Cars Dominate Despite EV AccelerationPassenger cars maintain market leadership with 60.86% share of the automotive bushing technologies market in 2025, reflecting the segment's volume dominance across global markets, while the segment emerges as the fastest-growing segment at 7.52% CAGR through 2031. The passenger car segment benefits from consistent replacement demand and expanding model portfolios, particularly in emerging markets where vehicle ownership continues rising. Light commercial vehicles represent a stable secondary segment driven by e-commerce growth and last-mile delivery requirements. In contrast, heavy commercial vehicles demand specialized high-durability bushing solutions for extended service intervals. Though smaller in value, two-wheeler applications offer growth opportunities in Asia-Pacific markets where motorcycle and scooter adoption remains strong.
The electric vehicle transition is reshaping bushing requirements across all vehicle types, with battery electric vehicles demanding specialized solutions for weight management, thermal isolation, and enhanced NVH control. Off-highway vehicles in agriculture and construction applications present niche opportunities for heavy-duty bushing technologies designed for extreme operating conditions and extended maintenance intervals. The segmentation reflects the industry's dual challenge of serving traditional internal combustion engine requirements while developing next-generation solutions for electrified powertrains, creating opportunities for suppliers with diversified product portfolios and advanced material capabilities.


By Application Type:
Suspension Systems Lead Innovation DriveSuspension system bushings command 45.21% market share of the automotive bushing technologies market in 2025, reflecting their critical role in vehicle dynamics, ride comfort, and handling precision across all vehicle platforms. The transmission and driveline bushings segment exhibits the fastest growth at 8.76% CAGR through 2031, driven by increasing sophistication in suspension designs and the need for enhanced vibration isolation in electric vehicles. Engine mount bushings face transformation as the industry transitions to electric powertrains, with traditional applications declining while new opportunities emerge in electric motor mounting and battery pack isolation. Transmission and driveline bushings adapt to electric vehicle architectures, with simplified drivetrains creating different vibration characteristics and mounting requirements.
Chassis and body bushings benefit from increasing vehicle complexity and the need for precise component isolation, particularly in premium segments where manufacturers prioritize refinement and durability. Steering system bushings represent a specialized segment requiring high precision and reliability, with growth driven by advanced driver assistance systems and evolving steering technologies. The application segmentation reveals the industry's evolution from traditional mechanical isolation to integrated solutions combining vibration control with thermal management, electrical isolation, and sensor integration capabilities.
By Material Type:
Natural Rubber Leads While Polyurethane AcceleratesNatural rubber maintains material leadership with 52.67% market share of the automotive bushing technologies market in 2025, benefiting from proven performance characteristics, cost-effectiveness, and established supply chains despite supply constraints and price volatility. Polyurethane is the fastest-growing material segment at 9.18% CAGR through 2031, driven by superior performance in electric vehicle applications, lightweight properties, and enhanced durability under extreme conditions. Synthetic rubber variants, including SBR, EPDM, and NBR, serve specialized applications requiring specific chemical resistance, temperature stability, or performance characteristics not achievable with natural rubber. Thermoplastics, including PTFE and Delrin, offer unique advantages in high-temperature applications and provide design flexibility for complex geometries.
Metal-polymer composites represent the premium segment, combining structural strength with vibration isolation capabilities, which is particularly valuable in high-performance and commercial vehicle applications. The material evolution reflects the industry's response to electric vehicle requirements, with polyurethane's lightweight properties and superior damping characteristics making it ideal for battery-heavy vehicles requiring enhanced NVH control. Bio-based alternatives are emerging as regulatory pressure increases, with biodegradable polymer composites based on polypropylene and hybrid fillers showing promise for non-structural automotive applications.
By Sales Channel:
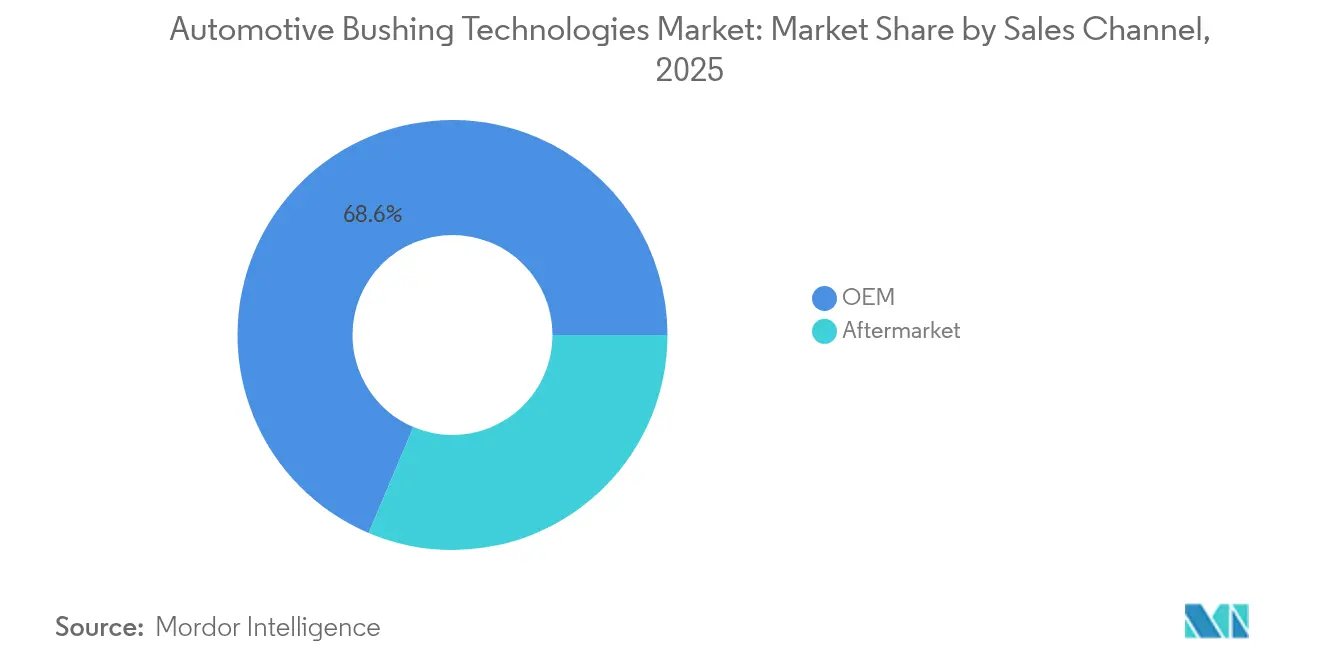
OEM Dominance Faces Aftermarket GrowthOEM channels command 68.62% market share of the automotive bushing technologies market in 2025, reflecting the primary role of original equipment manufacturers in specifying and sourcing bushing technologies for new vehicle production. The aftermarket segment demonstrates stronger growth momentum at 9.74% CAGR through 2031, driven by increasing vehicle age, rising maintenance requirements, and expanding service networks.
The channel dynamics reflect changing industry structure, with OEMs increasingly insourcing components while aftermarket suppliers adapt to digital transformation and direct-to-consumer sales models. The average vehicle age of 12.5 years supports aftermarket growth, as older vehicles require more frequent component replacement and maintenance. The transition to electric vehicles presents challenges and opportunities for aftermarket channels, with reduced maintenance requirements for some components offset by new service needs for battery systems and electric drivetrains.
By Electric-Vehicle Type:
BEV Leadership Drives SpecializationBattery electric vehicles dominate the segment with 46.55% market share of the automotive bushing technologies market in 2025 and maintain the fastest growth at 7.28% CAGR through 2031, reflecting their position as the primary electrification pathway for most automakers. Hybrid electric vehicles serve as transitional technology, requiring dual powertrains, creating complex bushing requirements for internal combustion engines and electric motors. Plug-in hybrid electric vehicles represent a premium segment with sophisticated powertrain architectures demanding specialized isolation solutions for multiple power sources and complex control systems. Fuel-cell electric vehicles remain a niche segment with unique requirements for hydrogen storage systems and fuel cell stack mounting.
The electric vehicle segmentation reveals the industry's technology evolution. Pure battery electric vehicles drive the most significant changes in bushing requirements due to their simplified drivetrains, increased weight, and altered vibration characteristics. Chinese OEMs are leading electric vehicle adoption, creating substantial demand for EV-specific bushing technologies. The segmentation also reflects regional preferences, with different electric vehicle technologies gaining traction in different markets based on infrastructure availability, regulatory support, and consumer preferences.
Geography Analysis
APAC Automotive Bushing Market
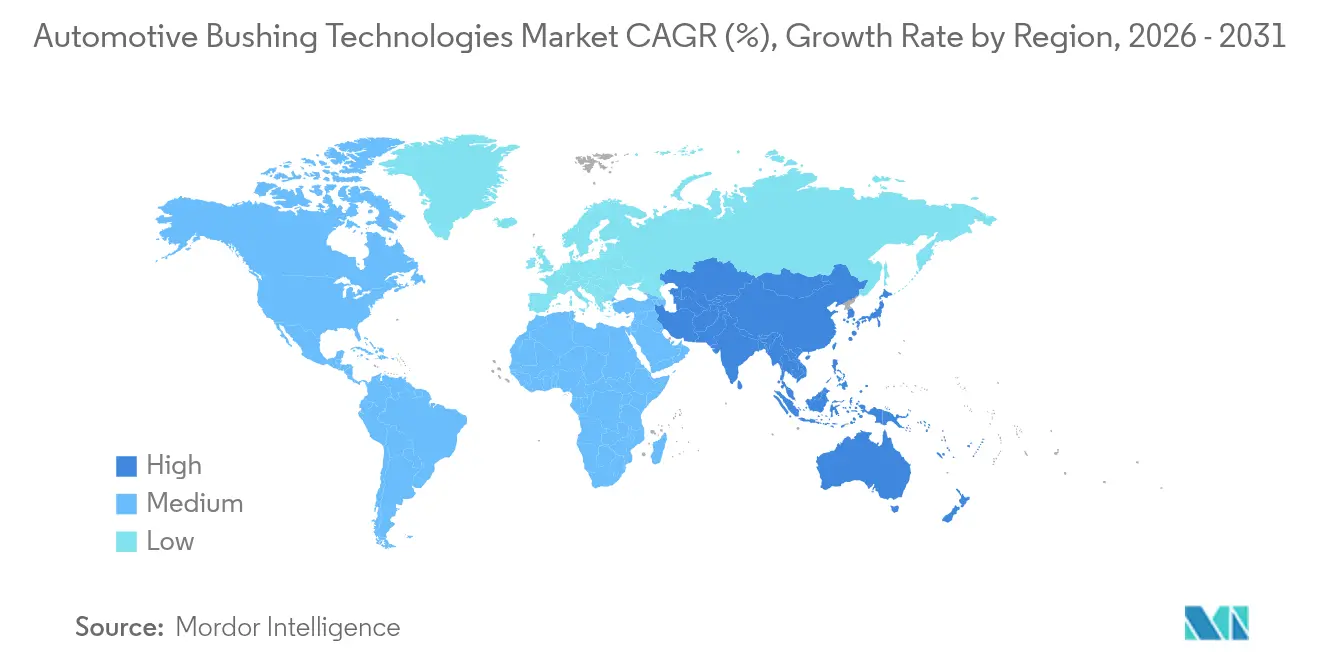
Asia-Pacific led the automotive bushing technologies market with 46.05% revenue in 2025, owing to China’s scale and rising ASEAN production. Automakers localizing battery-electric lines to capture incentive programs in Thailand and Indonesia buoyed the regional CAGR of 5.63%. Investment examples include BYD and Chery greenfield plants that intensify the local sourcing pull. Suppliers locate compounding units near these clusters to skirt tariff exposure and shorten lead times.
North America Automotive Bushing Market
North America follows as a mature yet stable arena. Replacement cycles and stringent safety standards uphold baseline demand even as economic headwinds temper new-vehicle sales. Federal incentives under the Inflation Reduction Act accelerate localized EV assembly, stimulating fresh tooling orders for high-durometer battery-pack bushings.
Europe Automotive Bushing Market
Europe contends with production contraction and incoming Euro 7 compliance. OEMs pivot to premium EVs to protect margins, elevating demand for high-spec bushings that meet NVH and sustainability targets. Potential tariffs on Chinese EV imports may return sourcing toward intra-EU suppliers, partially offsetting volume decline. At the same time, research funding under Horizon Europe channels grants toward bio-based elastomer projects, positioning the region as a test bed for low-emission bushing materials.

Regulatory Landscape
Automotive bushing suppliers operate under safety and quality-system requirements enforced through OEM and tier approvals, with regulators providing the broader oversight framework. In the United States, NHTSA administers FMVSS under 49 CFR Part 571, and IATF 16949 Rules 6th Edition, published in April 2024 and effective January 1, 2025, tightens oversight across the automotive supply chain. Sanctioned Interpretations issued in November 2025 become effective in April 2026, reinforcing conformance with audit and scope rules. Regulation (EU) 2026/1455, adopted June 25, 2026, implements tariff commitments under the EU-US framework signed in 2025, which defined the tariff environment for autos and auto parts.
Value Chain Analysis
The automotive bushing value chain starts with upstream elastomers and metals, then moves into compounding, molding or extrusion, and bonding, followed by durability and NVH validation testing. Tier suppliers deliver bushings as part of chassis modules to OEMs, while aftermarket supply runs through wholesalers, service networks, and platform-led distributors, where fitment data and quality certification affect sell-through. Current pinch points center on procurement and logistics. Natural-rubber and polymer price volatility is pushing formulators toward polyurethane and alternative compounds, and tariffs are driving regionalization and dual-sourcing for elastomer inputs and machined metal components. Supply chain resilience actions have also translated into higher inventories and working-capital strain versus pre-2019 norms. An automation gap persists across tiers, with robotics adoption materially higher at OEM and Tier-1 levels than at Tier-3, which creates fragility for smaller sub-suppliers handling high-mix bushing families and metal insert machining.
Competitive Landscape
The automotive bushing technologies market is dominated by several key players, such as Continental AG, ZF Friedrichshafen, and Sumitomo Riko anchor the tier-one group, each coupling conventional rubber expertise with electrification-focused R&D. Continental plans to separate its Automotive unit by 2025, allowing dedicated capital deployment into electric-mobility products.
Strategic transactions confirm a consolidation trend. In November 2024, Standard Motor Products acquired Nissens Automotive for USD 390 million to strengthen European thermal-management and bushing portfolios.
In April 2024, ASK Automotive formed a joint venture with AISIN to access South-Asian distribution, underscoring the aftermarket’s growth allure. Partnerships between material chemists and molders accelerate hybrid-composite bushing introductions, giving integrators a first-mover advantage on lightweight EV contracts.
Technology differentiation revolves around embedding sensors for condition monitoring. TDK micro-modules integrate vibration and temperature diagnostics, enabling predictive maintenance services that suppliers monetize via software subscriptions. Companies that bundle hardware with data platforms create sticky revenue streams and strengthen their bargaining position with OEMs. Despite looming raw-material swings, vertically integrated players cushion volatility through captive rubber plantations and multi-year feedstock contracts.
Automotive Bushing Industry Leaders
-
Continental AG
-
Vibracoustic SE
-
MAHLE GmbH
-
Delphi Technologies Inc.
-
Sumitomo Riko Co. Ltd.
- *Disclaimer: Major Players sorted in no particular order
Automotive Bushing Market Companies Covered in this Report
- Delphi Technologies Inc. (BorgWarner)
- Continental AG
- Sumitomo Riko Co. Ltd.
- Vibracoustic SE
- Boge Rubber and Plastics
- Hyundai Polytech India
- Cooper-Standard Holdings Inc.
- DuPont Inc.
- Mahle GmbH
- Tenneco Inc. (DRiV)
- ZF Friedrichshafen AG
- Federal-Mogul (DRiV)
- Oiles Corporation
- Freudenberg Group
- KYB Corporation
- Hutchinson SA
- SKF Group
- EPTG Ltd (Powerflex)
- GJ Bush Industrial

Market Opportunities and Future Outlook
Electrification and platform weight growth are widening the specification gap between legacy rubber designs and newer multi-material solutions. That gap supports opportunities for polyurethane, thermoplastic, and hybrid bushing architectures that manage higher loads and EV-specific NVH. Localization programs and new manufacturing clusters are also creating sourcing openings for chassis-component suppliers that can qualify to OEM quality systems and deliver cost stability. India is one visible example of capacity buildout around EV-related components, including Uno Minda board-approved greenfield investment (May 2026) for high-voltage four-wheeler EV powertrain products in Maharashtra, and Hirschvogel Components India signing an MoU (January 2026) for additional foreign direct investment in Maharashtra for EV-related parts. These steps strengthen localized supplier ecosystems that can pull adjacent elastomer and isolation components into local bills of material. Demand opportunities extend to hydraulic and frequency-dependent damping bushings for heavier SUVs and EVs, along with sensor-enabled bushings that support predictive maintenance models. In this report framing, the aftermarket channel already grows faster than OEM, which shapes how suppliers prioritize qualification and SKU planning for replacement demand.
Recent Industry Developments in Automotive Bushing Market
- May 2026: Uno Minda board-approved greenfield investment for high-voltage four-wheeler EV powertrain products in Maharashtra. The project expands local manufacturing capacity for EV components and tightens integration with OEMs seeking domestic supply chains. This move reinforces the India localization trend and broadens the local elastomer and isolation component ecosystem within Maharashtra.
- May 2026: Continental AG inaugurated the expansion of its tire plant in Rayong, Thailand, investing more than EUR 300 million to add capacity of 3 million passenger and light truck tires per year. The expansion signals continued localization of elastomer-intensive manufacturing in Asia-Pacific and strengthens supply-chain clustering around rubber processing and testing capabilities used across adjacent components.
- October 2025: Continental AG expanded its aftermarket spare-parts portfolio for chassis and steering systems, adding hundreds of new items and announcing that hydraulic bushings would be among the additions rolling into early 2026. The move strengthens competitive intensity in the replacement channel, where wider SKU coverage and fitment depth influence distributor preference and service-bay adoption.


Automotive Bushing Market Report Scope and Research Methodology
Market Definition and Coverage
For this study, the market includes revenue earned from automotive bushings used to isolate vibration and manage noise in vehicles, covering both OEM fitment and aftermarket replacement. Revenue is counted at the point of bushing supply into the automotive value chain.
Scope exclusions: We do not count upstream raw rubber or polymer production value, or unrelated vibration control parts that are not sold as bushings.
Segments Covered in This Report
-
By Vehicle Type
- Passenger Car
- Light Commercial Vehicle
- Heavy Commercial Vehicle
- Two-Wheeler
- Off-Highway Vehicle (Agriculture and Construction)
-
By Application Type
-
Suspension System Bushings
- Control-Arm
- Stabilizer-Bar
- Strut-Mount
- Engine Mount Bushings
- Transmission and Driveline Bushings
- Chassis and Body Bushings
- Steering System Bushings
-
Suspension System Bushings
-
By Material Type
- Natural Rubber
- Synthetic Rubber (SBR/EPDM/NBR)
- Polyurethane
- Thermoplastics (PTFE, Delrin)
- Metal-Polymer Composites
-
By Sales Channel
- OEM
- Aftermarket
-
By Electric Vehicle Type
- Battery Electric Vehicle (BEV)
- Hybrid Electric Vehicle (HEV)
- Plug-in Hybrid Electric Vehicle (PHEV)
- Fuel-Cell Electric Vehicle (FCEV)
-
By Geography
-
North America
- United States
- Canada
- Rest of North America
-
South America
- Brazil
- Argentina
- Rest of South America
-
Europe
- Germany
- United Kingdom
- France
- Italy
- Spain
- Russia
- Rest of Europe
-
Asia-Pacific
- China
- India
- Japan
- South Korea
- Rest of Asia-Pacific
-
Middle East and Africa
- Saudi Arabia
- United Arab Emirates
- Egypt
- Turkey
- South Africa
- Rest of Middle East and Africa
-
North America
Data Sources, Market Sizing, and Validation
Desk Research
Desk research starts with the real demand pool, anchored to vehicle production and the in-use parc, and then mapped to the typical bushing content per vehicle across major systems. For vehicle volume inputs, we reference public sources such as OICA vehicle production statistics and national transport departments for vehicle registrations, and we use U.S. International Trade Commission trade data plus Eurostat and UN Comtrade for cross-border flows. For application use cases, we rely on standards and technical papers from SAE International and similar bodies.
We then incorporate manufacturer disclosures, including annual reports, investor decks, and press releases, to interpret capacity moves, pricing commentary, and platform trends. For gap areas like company financial splits or shipment proxy checks, we may use paid subscription sources for company financials and news, and we cross-check material and design direction using patent databases (for example, rubber-to-polyurethane shifts). These desk sources are illustrative rather than exhaustive, and multiple public and paid references are used together for data collection, clarification, and cross checks.
Primary Interviews and Surveys
Primary work is used to verify what desk sources cannot fully show, especially how bushing demand changes by vehicle mix, platform architecture, and service life. We speak with participants across the supply chain, including component manufacturers, distributors, OEM-facing sales teams, and independent aftermarket stakeholders. Inputs are validated across major producing and consuming regions to keep assumptions realistic.
Distribution of primary research fieldwork respondents
| Company type | Respondent position | Region |
|---|---|---|
| Top tier: 33% | CXOs: 14% | APAC: 44% |
| Mid tier: 52% | Functional/Unit leaders: 27% | EMEA: 33% |
| Smaller Players: 15% | Managers: 59% | Americas: 23% |
Market-Sizing & Forecasting
Sizing is built using a top-down approach where vehicle production and in-use parc data are converted into an addressable bushing demand pool, and then expanded into value using system-level fitment and replacement behavior. To keep totals grounded, we corroborate with selective bottom-up checks, such as sampled ASP x volume checks for key bushing families and channel checks across OEM and aftermarket splits, and then adjust where the two views do not align.
Key inputs include global and regional vehicle production by passenger and commercial categories, EV penetration by major region, typical bushing content in suspension and engine mounting systems, replacement cycles tied to mileage and road conditions, and observed ASP movement based on material mix (natural rubber, synthetic rubber, and polyurethane). When a direct input is missing for a country, we use proxy ratios from comparable markets and validate those ratios with interview feedback before applying them.
Forecasting uses scenario analysis driven by near-term build plans, powertrain mix shifts, and the expected split between OEM and aftermarket demand. Assumptions are held consistent year-to-year so forecast changes can be traced back to a limited set of clear drivers.
Data Validation & Update Cycle
Model outputs are checked against independent signals such as vehicle production trends, trade direction, and implied bushing value per vehicle. This step helps flag results that appear too high or too low. When a variance shows up, it is reviewed in stages, starting with the input, then the regional roll-up, and finally the global total before sign-off.
Reports are refreshed annually, with interim updates when material events occur, such as sharp production swings, major capacity additions, or sudden input cost changes that can shift pricing. Before delivery, a final analyst pass is completed to ensure clients receive the latest updated view and any last-minute anomalies are resolved.
Mordor Intelligence's Automotive Bushing Market Size Compared With Other Published Estimates
Published numbers for this market often diverge because the scope boundary is not identical across studies, and because pricing and replacement assumptions are carried differently. Differences also come from what each study counts as a bushing, whether both OEM and aftermarket are included, and how EV mix is treated in the forward years.
The table shows a spread across published figures. In Mordor Intelligence's model, the value is counted at the bushing supply level across OEM and aftermarket, while excluding upstream elastomer value and broader mount assemblies unless the bushing itself is clearly priced and shipped as the unit.
Benchmark comparison
| Source | Market Size | Gaps in Research Methodology |
|---|---|---|
| Mordor Intelligence | USD 172.48 B (2025) | |
| Trade Journal A | USD 167.47 B (2025) | Often uses a single headline revenue series with limited visibility on what is excluded, and it may apply a more conservative ASP path without separately validating OEM versus aftermarket pricing. |
| Press Release B | USD 175.31 B (2025) | May fold in adjacent anti-vibration components and use earlier-year conversion rates and base-year assumptions, which can shift the 2025 value when compared on like-for-like scope. |
Across the three figures, most of the gap can be explained by what is included as a bushing item and how pricing is carried forward into the current year. By linking the model to vehicle output, replacement behavior, and a clear price-per-unit logic, the result remains traceable and can be repeated when updated production or mix data becomes available.


Key Questions Answered in the Report
How big is the automotive bushing market in 2026?
The automotive bushing market size is USD 180.43 billion in 2026.
Which vehicle category drives the highest demand for bushings?
Passenger cars lead with 60.86% market share in 2025, supported by large production volumes and diversified model lines.
What is the fastest-growing application for bushings?
Transmission and driveline bushings grow at a 8.76% CAGR through 2031 as multi-link designs spread across EV and crossover segments.
Why are polyurethane bushings gaining traction?
Polyurethane offers weight savings, higher load-bearing capacity, and durability that align with battery-electric vehicle requirements.
Page last updated on:


 Your data is secure and never sold or shared.


