
Automotive Battery Market Size and Share
Market Overview
| Study Period | 2019 - 2031 |
|---|---|
| Market Size (2026) | USD 153.67 Billion |
| Market Size (2031) | USD 349.23 Billion |
| Growth Rate (2026 - 2031) | 17.84 % |
| Fastest Growing Market | South America |
| Largest Market | Asia-Pacific |
| Market Concentration | Medium |
Major Players *Disclaimer: Major Players sorted in no particular order Image © Mordor Intelligence. Reuse requires attribution under CC BY 4.0. | |
Automotive Battery Market Analysis by Mordor Intelligence
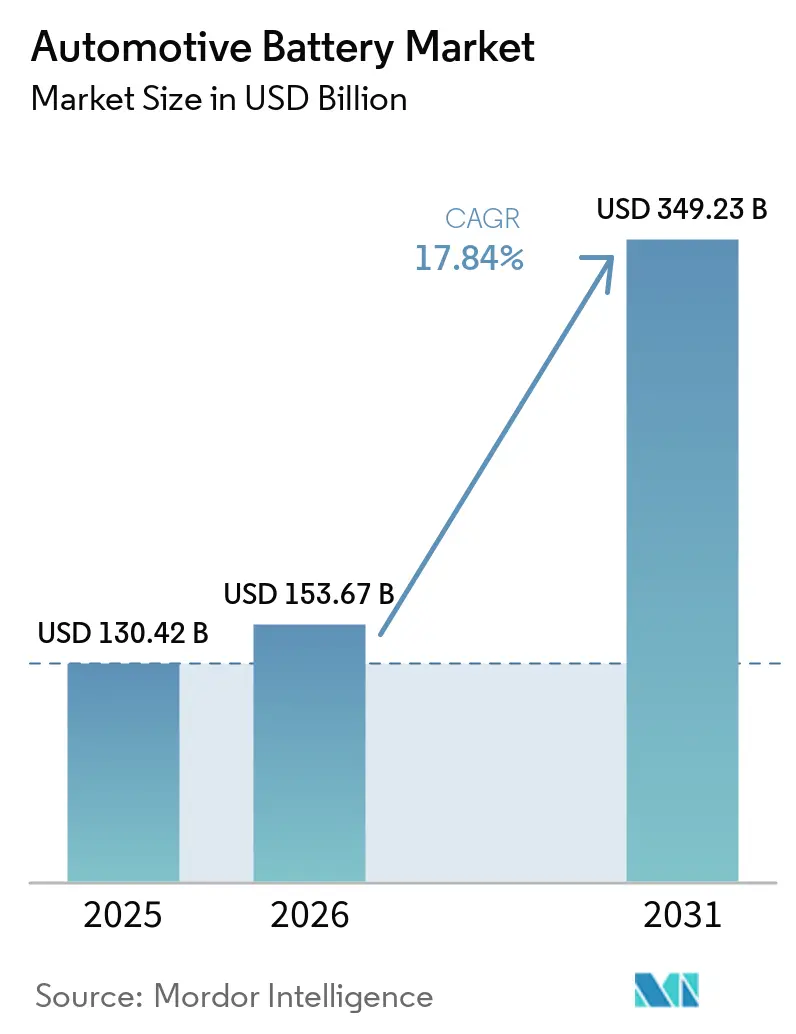
The automotive battery market size was valued at USD 130.42 billion in 2025 and is estimated at USD 153.67 billion in 2026, and is forecast to reach USD 349.23 billion by 2031 at a 17.84% CAGR over 2026-2031. This expansion reflects a sharper shift toward vehicle electrification, as electric cars represented 25% of global vehicle sales in 2025 and global EV sales moved above 20 million units, which broadened battery demand beyond early adopter markets and into the mainstream vehicle base [1]“Global EV Outlook 2025,” IEA, iea.org. The volume effect is rising faster in energy terms than in vehicle counts because battery-electric commercial vehicles use much larger packs than passenger cars, which raises cell demand, pack demand, and replacement planning across the automotive battery market. Policy support is also shaping investment timing, with the US advanced manufacturing production credit and the EU batteries framework pushing new capacity, recycling readiness, and supply chain traceability deeper into procurement decisions. Asia-Pacific remains the operating center because China combines very large domestic EV uptake with scale manufacturing, while South America is opening a new growth lane through tariff-led localization and local assembly plans that are starting to spread battery demand into new production hubs. Competition is concentrated at the top end, and mineral supply concentration plus recurring battery safety recalls continue to influence sourcing, localization, chemistry choices, and warranty planning across the automotive battery market.
Key Report Takeaways
- By battery type, Lead-Acid held 48.72% of the automotive battery market share in 2025, while Others is forecast to expand at 18.06% CAGR through 2031.
- By vehicle type, Passenger Cars held 70.05% revenue share in 2025, while Commercial Vehicles are projected to grow at 18.61% CAGR through 2031.
- By drive type, ICE (SLI & Start-Stop) accounted for 82.55% of revenue in 2025, while BEV is set to record the highest CAGR at 19.18% through 2031.
- By application, Starting-Lighting-Ignition accounted for a 72.32% share of the automotive battery market size in 2025, while Propulsion is forecast to grow at 18.22% CAGR through 2031.
- By sales channel, OEM held 61.74% of revenue in 2025, while Aftermarket is projected to advance at 17.95% CAGR through 2031.
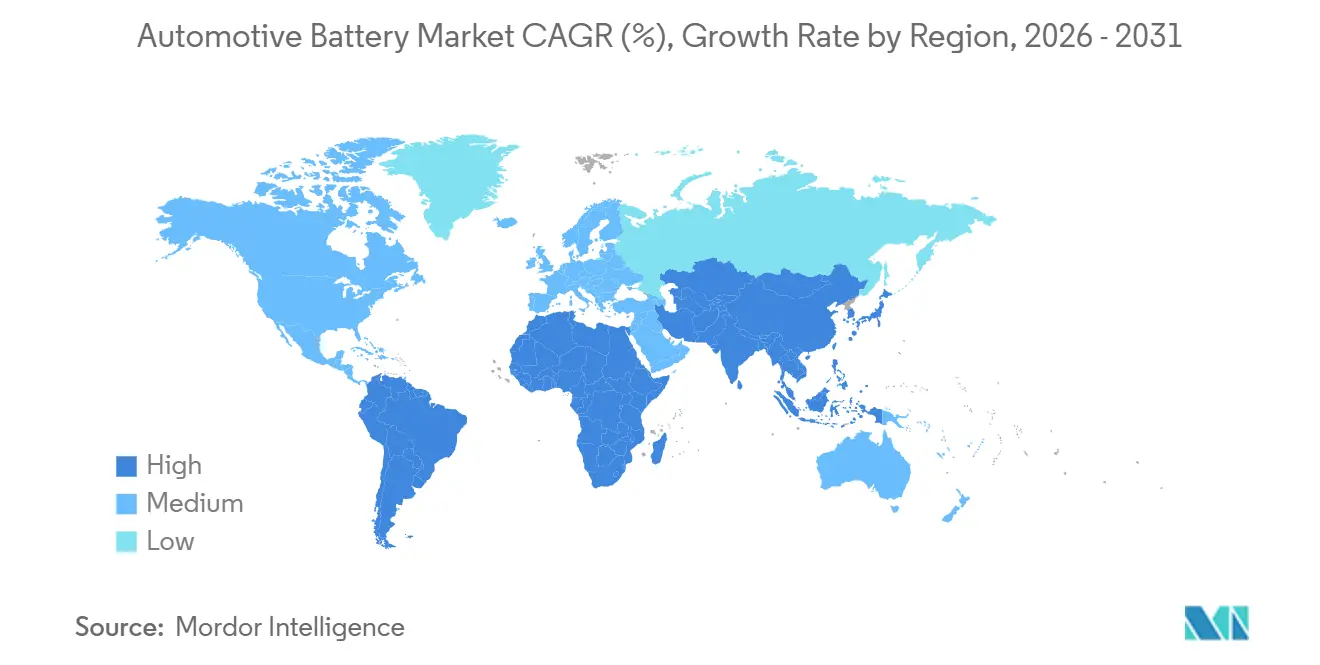
- By geography, Asia-Pacific accounted for 42.68% share of the automotive battery market size in 2025, while South America is forecast to expand at 18.01% CAGR through 2031.
Note: Market size and forecast figures in this report are generated using Mordor Intelligence’s proprietary estimation framework, updated with the latest available data and insights as of 2026.
Market Trends and Insights
Drivers Impact Analysis of Automotive Battery Market*
| Driver | (~) % Impact on CAGR Forecast | Geographic Relevance | Impact Timeline |
|---|---|---|---|
| Surging EV Production and Sales | +5.8% | Global, strongest in China, Europe, and emerging Asia-Pacific markets | Medium term (2-4 years) |
| Government Incentives and Emission Norms | +3.2% | North America, Europe, and major Asia-Pacific EV markets | Medium term (2-4 years) |
| Decline in Li-Ion Price | +2.6% | Global, strongest in China with spillover into Europe and North America | Medium term (2-4 years) |
| Vehicle-To-Grid Pilots | +1.4% | Europe, China, Australia, and North America | Long term (≥ 4 years) |
| IRA and EU Battery Subsidies | +1.2% | North America and Europe | Medium term (2-4 years) |
| 12V Start-Stop Replacements | +0.8% | Global, especially Europe and North America aftermarket channels | Medium term (2-4 years) |
| Source: Mordor Intelligence | |||
Surging EV Production and Sales
Global EV sales exceeded 20 million units in 2025, and electric cars accounted for 25% of all cars sold worldwide, which materially lifted the volume base for the automotive battery market across both passenger and commercial platforms. China remained the dominant engine of this expansion, with domestic new energy vehicle penetration moving above 50% in 2025 and then above 60% in December 2025, which kept local battery demand high across mainstream and premium vehicle categories [2]“Industry Updates and NEV Data,” CAAM, caam.org.cn. The demand effect is no longer explained by vehicle counts alone because electric commercial trucks require much larger battery packs, and CATL stated in late 2025 that one battery-electric heavy truck can carry battery capacity equal to 3 to 4 passenger cars. That changes procurement behavior because a smaller number of fleet wins can generate a much larger call on cell output, pack assembly, logistics planning, and future replacement services than passenger vehicle contracts of similar unit size. The growth base is also becoming more geographically distributed, as Brazil’s EV market doubled to 125,000 units in 2024 and local production activity started moving into 2026, which supports a broader manufacturing footprint for the automotive battery market beyond China-centric growth patterns. As a result, suppliers that can serve both passenger vehicles and high-capacity fleet platforms are positioned to capture a larger share of incremental GWh demand even if their unit volumes do not lead the market.
Government Incentives and Emission Norms
Policy remains one of the clearest demand anchors for the automotive battery market because incentive design now affects where cells are made, how supply chains are documented, and which producers can qualify for local sourcing benefits. In the United States, the advanced manufacturing production credit under Section 45X continues to support domestic cell and module output, which keeps plant investment active even when consumer demand signals move unevenly across vehicle segments. In Europe, Regulation (EU) 2023/1542 established a binding framework for carbon footprint disclosure, recycled content, due diligence, labeling, and digital battery passport requirements, which shifts battery competition away from price alone and toward compliance readiness[3]“Regulation (EU) 2023/1542,” EUR-Lex, eur-lex.europa.eu. These rules matter because they raise the cost of weak traceability and reward suppliers that can certify sourcing, recycling, and performance data early in the vehicle program cycle. The practical effect is that battery suppliers are now being assessed not only on chemistry and capacity but also on whether they can protect OEM access to regulated end markets over the life of each vehicle platform. That makes regulation a continuing demand support for the automotive battery market, even in periods when retail EV adoption temporarily varies by country or subsidy structure.
Rapid Decline in Li-Ion Price/kWh
A sustained decline in lithium-ion battery cost improves the economics of electric vehicles and supports broader adoption across passenger and commercial platforms. As pack costs fall, OEMs gain more room to price battery electric models closer to internal combustion alternatives, which expands demand beyond policy-driven buyers into more price-sensitive customer groups. Lower battery costs also support wider use of larger pack configurations in commercial vehicles, where range, payload planning, and duty-cycle reliability matter more than in passenger cars. The effect is especially important for manufacturers with scale and integrated supply chains because they can pass cost reductions into vehicle pricing faster and defend margins more effectively than smaller rivals. Cost compression also pushes chemistry selection toward lower-cost formats, which can shift demand away from nickel-rich systems and reshape supplier positioning across the automotive battery market.
Vehicle-To-Grid Pilots Boosting Second-Life Demand
Vehicle-to-grid (V2G) and second-life applications are reshaping the automotive battery market, broadening a battery's commercial role beyond its initial vehicle use. Research indicates that if a significant portion of Europe's electric vehicle (EV) fleet engaged in V2G, it could meet the region's stationary storage needs by the mid-2030s. This underscores the dual functionality of automotive batteries in both mobility and grid services over time. A 2025 study in 'Sustainability' highlighted that V2G economics are heavily influenced by electricity pricing structures. For instance, Chengdu outperformed markets with stringent price caps, suggesting that business models will flourish in areas where tariff spreads are favorable. The EU's battery regulation has laid a legal foundation for repurposing retired EV batteries, streamlining the process for OEMs, recyclers, and energy storage operators to reuse batteries before their final recycling. This trend is pivotal for the automotive battery market: suppliers who harness battery health data, establish collection channels, and forge repurposing partnerships can tap into recurring value streams, independent of the initial vehicle sale.
Restraints Impact Analysis of Automotive Battery Market*
| Restraint | (~) % Impact on CAGR Forecast | Geographic Relevance | Impact Timeline |
|---|---|---|---|
| Critical Mineral Supply Volatility | -1.8% | Global, especially cobalt, lithium, and nickel, supply chains | Medium term (2-4 years) |
| Thermal-Runaway Recalls and Safety Perceptions | -0.9% | Global, with the strongest legal and reputational impact in North America, Europe, and China | Medium term (2-4 years) |
| Solid-State and Na-Ion Tech Risk Stranding Current Assets | -0.7% | Global, strongest in North America and Europe | Long term (≥ 4 years) |
| Recycling Over-Capacity Pressuring Margins | -0.4% | China, North America, and Europe | Long term (≥ 4 years) |
| Source: Mordor Intelligence | |||
Critical Mineral Supply Volatility
Critical minerals remain a structural restraint on the automotive battery market because lithium, nickel, and cobalt supply chains are still more concentrated than vehicle demand itself. The International Energy Agency reported that the top 3 refining countries accounted for the majority of global cobalt refining capacity, which means downstream battery producers remain exposed to disruptions that originate far upstream in a limited number of countries. This concentration matters even when battery makers diversify chemistry because mineral exposure does not disappear; it simply shifts from one material mix to another and can still affect cathodes, pricing, or qualifying supply volumes. The practical result is that procurement teams now place more value on long-term offtake security, recycling pathways, and chemistry optionality than they did when lithium-ion growth was starting from a smaller base. It also explains why LFP has gained strategic weight, since it reduces cobalt exposure and helps producers manage part of the volatility that has historically weighed more heavily on nickel-rich systems. Even so, the automotive battery market will remain sensitive to upstream shocks because mining, refining, and processing capacity still scale more slowly than demand for electrified mobility.
Thermal-Runaway Recalls and Safety Perceptions
Thermal-runaway incidents remain a real restraint because battery-related recalls create direct costs for OEMs and battery suppliers while also weakening consumer confidence in EV ownership. In December 2025, Chrysler filed NHTSA Recall 25V741 covering 320,065 Jeep Wrangler and Grand Cherokee PHEV units after battery cells were found to carry a fire risk, and the remedy involved inspection and replacement of affected packs. In November 2025, Ford also recalled 20,558 Escape and Lincoln Corsair PHEV vehicles due to high-voltage battery internal short-circuit risk, which again showed how cell-level manufacturing issues can scale into fleet-wide corrective action. These events matter commercially because recalls raise warranty exposure, disrupt vehicle usage, and can lead to temporary charging or parking restrictions that reduce the everyday convenience of electrified vehicles. Safety concerns also slow adoption in buyer groups that are still comparing EVs with hybrids or conventional vehicles on reliability and total ownership risk. For the automotive battery market, this means quality control, traceability, separator integrity, and pack-level safety design are now central competitive requirements rather than only engineering considerations.
*Our forecasts treat driver/restraint impacts as directional, not additive. The impact forecasts reflect baseline growth, mix effects, and variable interactions.
Automotive Battery Market Segment Analysis
By Battery Type:
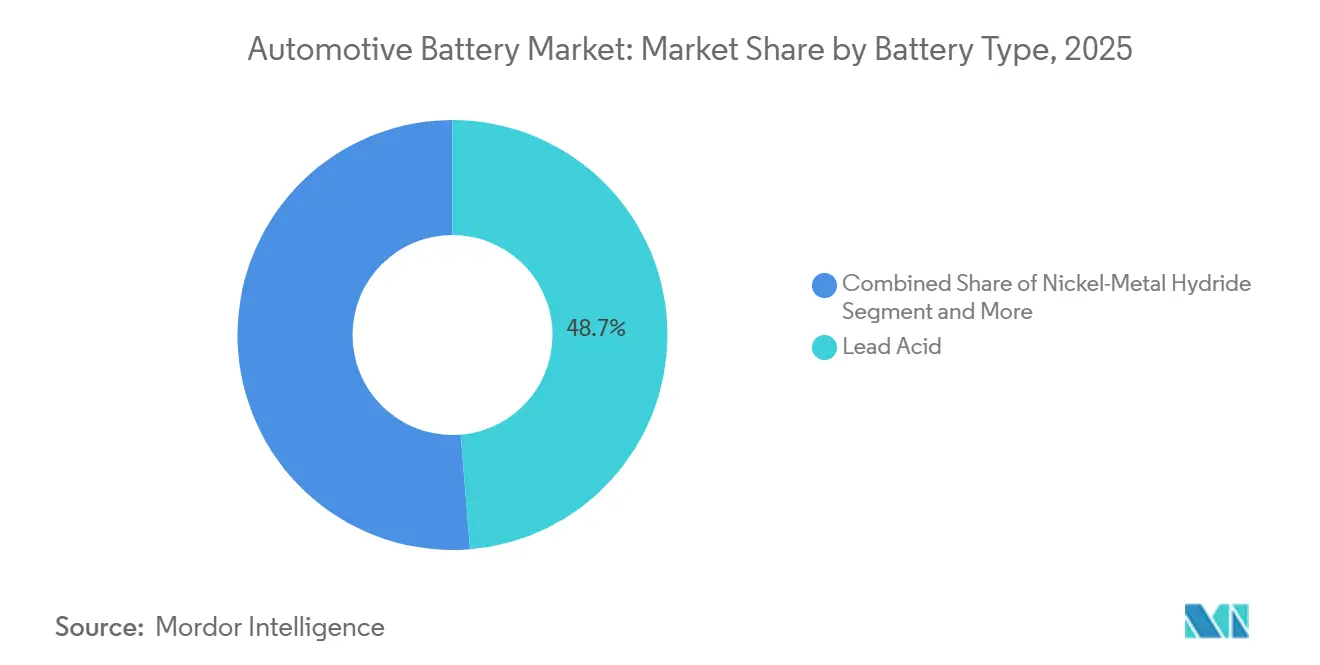
Lead-Acid Volume Holds as Chemistry Economics Shift Beneath ItLead-Acid held 48.72% of revenue in 2025, which shows that the automotive battery market still depends heavily on the installed global ICE fleet and its recurring replacement cycle for starting, lighting, and ignition systems. This position remains durable because a very large vehicle parc continues to require low-cost and widely available 12V batteries, and replacement demand is less cyclical than new vehicle production. The segment also benefits from familiar service networks, strong recycling economics, and standardized fitment across many established vehicle platforms, which keep it commercially relevant even as EV penetration rises. At the same time, the operating role of lead-acid is narrowing in some newer vehicle architectures because start-stop systems and low-voltage support applications increasingly reward better cycle life and faster recharge performance. That means Lead-Acid still anchors volume, but the automotive battery market is steadily assigning more future value to chemistries that support electrified platforms and higher energy throughput.
Lithium-ion remains the main growth engine inside the automotive battery market because it serves BEV propulsion, a rising share of PHEV requirements, and a growing number of 12V auxiliary and start-stop upgrades. Nickel-Metal Hydride still holds a niche role in conventional hybrids, especially where OEMs continue to favor proven HEV architectures and modest battery sizing over full battery-electric transitions. The Others segment is projected to grow at 18.06% CAGR through 2031, which reflects a broader industry push to reduce dependence on a narrow set of mineral pathways and to improve cold-weather performance, safety, or cost flexibility. CATL stated in May 2026 that its Naxtra sodium-ion battery will enter mass production by the end of 2026, which gives the segment a concrete near-term anchor rather than only a laboratory narrative CATL. That matters for the automotive battery industry because chemistry diversification is moving from strategic discussion into product planning, and that will gradually reshape how manufacturers balance cost, raw material exposure, and vehicle fit across the forecast period.


By Vehicle Type:
Commercial Fleet Electrification Resets Battery Demand IntensityPassenger Cars held 70.05% of revenue in 2025, which kept them as the largest contributor to the automotive battery market because EV adoption is still led by mainstream and premium passenger vehicle volumes in China, Europe, and North America. This dominance reflects a broad installed base across ICE, hybrid, and battery-electric drivetrains, which means passenger cars draw demand from both replacement batteries and original equipment programs. The segment is also where policy support, charging access, and consumer model choice are currently the most developed, which helps it retain scale even as adoption rates vary across countries. Even so, passenger car demand no longer tells the whole story because battery intensity per vehicle differs sharply across segments, and that is changing where suppliers find incremental GWh growth. As the automotive battery market matures, suppliers that focus only on car volumes may miss the stronger energy demand now emerging from larger vehicle platforms.
Commercial Vehicles is projected to expand at 18.61% CAGR through 2031, and that growth carries unusual weight because each fleet vehicle can require far more battery capacity than a typical passenger car. CATL noted in late 2025 that one battery-electric heavy truck can carry battery capacity equal to 3 to 4 passenger cars, which means fleet electrification can reshape capacity planning even before it dominates unit sales. This is why municipal fleets, logistics operators, buses, and urban delivery programs have become strategically important accounts for battery suppliers despite their smaller vehicle counts. Two-wheelers also matter in Asia because they widen the electrification base and add large unit volumes in lower-cost mobility segments, even when pack sizes are modest. Off-highway equipment remains a smaller category, but tightening emissions rules and early procurement activity suggest that specialized work vehicles will become a more visible demand pocket for the automotive battery market over time.
By Drive Type:
ICE Fleet Sustains Revenue as BEV Investment Commands Growth CapitalInternal combustion engine applications held 82.55% of revenue in 2025, which confirms that the automotive battery market is still funded largely by the global combustion fleet and the replacement cycle tied to SLI and start-stop systems. This remains true because the installed ICE vehicle base is far larger than the electrified fleet, and replacement demand continues regardless of new powertrain adoption trends. The segment also benefits from stable service channels and well-understood product specifications, which make demand easier to forecast than traction batteries tied to newer vehicle platforms. In commercial terms, ICE therefore remains the revenue floor of the market even as long-term capital and R&D are shifting elsewhere. That creates a two-speed structure in which legacy demand pays for scale while growth capital moves toward higher-voltage electrified applications across the automotive battery market.
BEV is projected to grow at 19.18% CAGR through 2031, which makes it the fastest-growing drive type as OEMs continue to place more product and capacity bets on pure-electric platforms. This transition is reinforced by the simple fact that BEVs require larger and more complex battery systems than hybrid or ICE platforms, so each production win carries more value for cell suppliers, pack assemblers, and battery management system providers. Hybrid and plug-in hybrid models still serve as an important middle ground because they help OEMs balance cost, range, regulation, and consumer familiarity in regions where charging convenience remains uneven. FCEVs remain a niche, but they preserve strategic relevance in heavy transport use cases where range, uptime, and payload economics are difficult to solve with battery-electric formats alone. The automotive battery industry, therefore, sits in a transitional period where ICE sustains present revenue, hybrids support portfolio flexibility, and BEV programs absorb the largest share of future investment attention.
By Application:
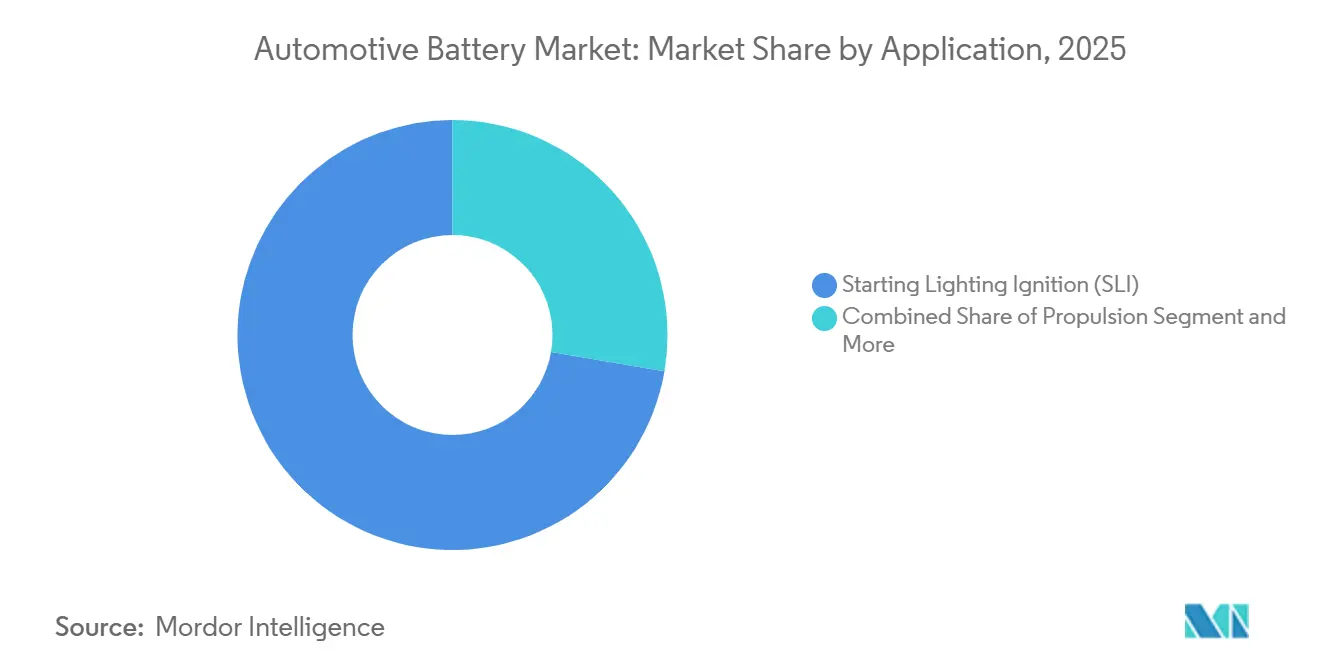
SLI Revenue Mass Contrasts with Propulsion Growth LeadershipStarting-Lighting-Ignition accounted for 72.32% share of the automotive battery market size in 2025, which shows how strongly current revenue still reflects the installed base of conventional vehicles rather than the future mix of new vehicle sales. This segment remains reliable because batteries in SLI service face predictable replacement timing, broad workshop familiarity, and a large global vehicle parc that continues to generate replacement turnover. It also spans a wider set of low-voltage functions than the label suggests, since modern vehicles depend on stable electrical support for comfort, control, and safety systems even when propulsion is not battery-electric. For that reason, SLI is likely to remain a major revenue contributor throughout the forecast period even as its share gradually moderates. In short, the automotive battery market still earns most of its present income from batteries that support mobility rather than directly power it.
Propulsion is projected to grow at 18.22% CAGR through 2031, and this is the segment that captures the clearest structural change in the market because battery value is moving from support systems toward the core powertrain. Rising EV sales, larger average pack requirements, and the spread of battery-electric commercial fleets are all raising the share of battery spending tied directly to propulsion. CATL’s battery-swap rollout adds another layer to this segment because it turns traction batteries into a recurring service model rather than a one-time hardware sale, which changes ownership, utilization, and replacement economics. Start-stop systems are also undergoing a chemistry shift as 12V lithium solutions move into roles once held mainly by AGM and EFB lead-acid products, especially where better cycle life and charge acceptance matter. Auxiliary and low-voltage systems remain commercially important as EV architectures become more electrified, which means the automotive battery market is expanding around propulsion without eliminating the need for supporting battery functions.
By Sales Channel:
Aftermarket Growth Marks the Maturation of First EV CohortsOEM accounted for 61.74% of revenue in 2025, which kept it as the largest sales channel in the automotive battery market because automakers still control the primary flow of high-value battery demand through new vehicle programs and long-term sourcing contracts. OEM supply agreements matter because they determine chemistry roadmaps, qualification standards, pricing structures, warranty allocation, and future plant utilization over several model years. They also give large battery manufacturers visibility into volume planning and customer concentration, which supports investment in factories, module lines, and localization. This makes the OEM channel the main route to scale, especially in BEV propulsion batteries, where design integration and safety validation are tightly linked to the vehicle program. As a result, the automotive battery market continues to reward suppliers that can win strategic OEM platforms and stay embedded through the full product cycle.
Aftermarket is projected to grow at 17.95% CAGR through 2031, which indicates that the market is entering a more mature phase where the installed electrified fleet starts generating a larger replacement and service opportunity. Two trends are driving this shift: early BEV cohorts are moving closer to traction battery replacement needs, and lithium-based 12V upgrades are gaining interest in performance-conscious and start-stop replacement segments. Aftermarket demand is also more geography-specific than OEM demand because fitment standards, voltage requirements, repair practices, and certification rules differ more sharply across local vehicle parcs. Second-life battery channels could widen this space further because repurposed EV batteries may create lower-cost options for certain applications before final recycling, a pathway that is increasingly recognized in European regulation and academic work. The automotive battery industry therefore faces a sales mix shift in which OEM remains the scale driver, but aftermarket becomes a more meaningful profit and service arena as the installed EV base ages.
Geography Analysis
APAC Automotive Battery Market
Asia-Pacific held 42.68% of revenue in 2025, which made it the largest regional contributor to the automotive battery market and confirmed the region’s lead in both manufacturing scale and EV adoption. China anchors that position because domestic new energy vehicle penetration moved above 60% in December 2025, which kept vehicle demand, battery production, and supplier activity tightly linked in one large market. This matters because local battery makers benefit from proximity to automakers, dense supplier ecosystems, and a domestic market large enough to absorb rapid product cycles and scale advantages. Japan and South Korea remain important in the automotive battery market, but their path is more technology-led than cost-led, with stronger emphasis on differentiated chemistries, premium applications, and strategic R&D rather than mass-market price leadership. China is also tightening end-of-life governance, and the Ministry of Industry and Information Technology moved in 2026 toward stronger full-chain traceability for retired power batteries, which supports more formal recycling and reuse systems over time.
Europe and North America Automotive Battery Market
Europe and North America together form the next major demand center for the automotive battery market, but the two regions are moving through the current cycle in different ways. Europe remains strongly policy-shaped, with battery regulation, carbon disclosure, due diligence, and battery passport requirements pushing suppliers to build more transparent and regionally compliant value chains. That regulatory structure supports long-term localization, but it also raises operating expectations for manufacturers that want durable access to European OEM programs and aftermarket channels. North America is more dependent on the balance between local manufacturing support and retail demand conditions, and Section 45X continues to support domestic cell production even when vehicle sales mix changes across powertrain types. The Northvolt failure also shaped regional thinking because it showed that capital alone does not ensure cost competitiveness, especially when Chinese producers retain stronger scale and established learning curves across the automotive battery market.
MEA and South America Automotive Battery Market
South America is projected to grow at 18.01% CAGR through 2031, which makes it the fastest-growing region as tariff-led localization and urban EV adoption begin to reinforce each other. Brazil is the center of that shift because its EV market has grown quickly and the tariff structure has pushed Chinese automakers such as BYD and GWM toward local production plans that should deepen regional supply chains. The Middle East and Africa remain earlier-stage regions, but policy-led fleet procurement and trade access are making them more relevant to future battery assembly, EV distribution, and service networks. That leaves the automotive battery market with a clear geographic pattern, Asia-Pacific sets the scale, Europe and North America shape compliance and localization, and South America provides the sharpest growth runway during the forecast period.

Regulatory Landscape
Policy continues to shape automotive battery localization, traceability, and sustainability compliance across major markets. In the European Union, Regulation (EU) 2023/1542 follows a phased implementation path, with EV battery performance and durability requirements applying from 18 August 2024, and subsequent implementation activity in July 2025 finalizing methodology for calculating and verifying recycling efficiency and material recovery for waste batteries.
In 2026, regulatory text updates also influenced operational compliance, including an Official Journal corrigendum published on 10 April 2026 that amends specific marking requirements under Article 13. In the United States, final Treasury/IRS regulations for the Section 30D clean vehicle credit took effect on 5 July 2024, and the Battery Component Requirement steps up to 70% for calendar year 2026, raising the bar for domestic and free-trade-aligned sourcing across cells, modules, and packs used in eligible vehicles.
Value Chain Analysis
The automotive battery value chain spans upstream raw-material extraction (lithium, nickel, cobalt, graphite), refining and precursor/cathode processing, cell manufacturing, module and pack assembly, vehicle integration, and end-of-life collection and recycling. Concentration remains a defining feature, with China accounting for over 80% of global EV battery production capacity in 2023, while deployment momentum continues, with global EV battery deployment reaching 1.2 TWh in 2025 (up 30% from 2024).
Regionalization is changing where different chain steps sit, and it also affects how suppliers qualify for incentive-linked demand. North American scaling has accelerated alongside policy-linked domestic content needs, reflected in U.S. battery production growth of nearly 140% between 2020 and 2025 and new joint-venture capacity ramp-ups, including SK On and Hyundai Motor Group beginning initial production at their joint venture facility in Bartow County, Georgia in July 2026. Materials localization is also moving into OEM supply lanes, including LG Chem beginning cathode material shipments to Toyota Motor Engineering and Manufacturing North America in July 2026, using precursors sourced via its Korea Precursor Co. joint venture.
Competitive Landscape
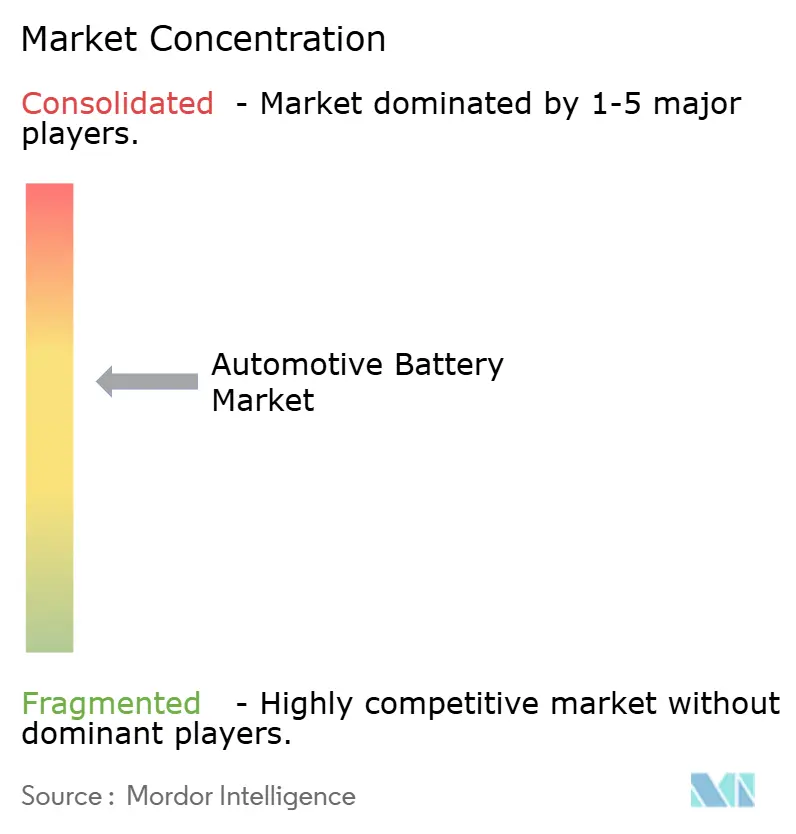
The automotive battery market is concentrated at the top and much more fragmented below that top tier, which creates a structure where a few companies shape pricing, technology direction, and capacity timing for the rest of the field. In 2025, CATL dominated the global EV battery installations, while BYD followed closely. Together, these two giants commanded a significant share of the market, positioning them far ahead of their competitors. That leads matters because scale in batteries affects not only cost, but also purchasing leverage, plant utilization, chemistry flexibility, and the ability to support multiple automakers across several geographies at once. Western and Korean manufacturers still matter in selected programs, premium applications, and regional partnerships, but they are operating from a weaker position in the mass-market battery race. The automotive battery market, therefore, looks less like a broad field of equal competitors and more like a top-heavy structure where the leading Chinese firms set the commercial tone.
Northvolt’s bankruptcy in March 2025 also changed how competitors and OEMs view Western battery expansion because it showed how difficult it is to sustain gigafactory economics without steady demand, policy support, and cost-competitive technology. That episode strengthened the case for phased localization, joint ventures, and imported cells with local pack assembly rather than fully independent regional battery ecosystems from day one. Regulation adds another layer to competition because the EU battery passport and due diligence framework will favor producers that can prove supply chain visibility and end-of-life management before the requirements become fully binding. Strategic moves from leading companies also show how competition is broadening beyond cell supply alone. CATL is building out its Chocolate battery-swap network. CATL has also moved sodium-ion closer to production through Naxtra, and BYD introduced a fast-charging battery platform in 2026 that pointed to shorter charging times as a direct competitive lever.
These moves matter because they shift competition from pure manufacturing scale toward ecosystem control, service models, charging experience, and chemistry optionality. The strongest companies are trying to bind customers through infrastructure, product architecture, and long-term software and service relationships rather than through hardware pricing alone. This creates white-space opportunities in second-life battery channels, V2G software, recycling coordination, and specialized fleet support, where the largest cell makers do not automatically dominate every layer. Even so, the automotive battery market remains difficult for mid-tier firms because the leaders already combine manufacturing scale, technology breadth, and customer reach in ways that are hard to match quickly.
Automotive Battery Industry Leaders
Contemporary Amperex Technology Co., Limited (CATL)
LG Energy Solution
Panasonic Energy Co., Ltd.
BYD Co. Ltd.
Samsung SDI Co., Ltd.
- *Disclaimer: Major Players sorted in no particular order
Automotive Battery Market Companies Covered in this Report
- Contemporary Amperex Technology Co., Limited (CATL)
- LG Energy Solution
- Panasonic Energy Co., Ltd.
- BYD Co. Ltd.
- Samsung SDI Co., Ltd.
- Clarios
- GS Yuasa Corporation
- VARTA AG
- Exide Technologies
- EnerSys
- A123 Systems Corp.
- Prime Planet Energy & Solutions, Inc.
- Robert Bosch GmbH
- SK On
- EVE Energy Co., Ltd.
- Farasis Energy
- SVOLT Energy Technology Co., Ltd
- Saft Groupe SA

Market Opportunities and Future Outlook
Localization-driven capacity buildouts create near-term whitespace for suppliers that can deliver compliant cells, materials, and packs at scale across multiple chemistries. This is occurring alongside OEM expansion of multi-sourcing strategies and increased standardization of formats. North America offers visible momentum: NextStar Energy (LG Energy Solution and Stellantis) marked the grand opening of its Windsor, Ontario battery plant in March 2026, noting more than one million battery cells produced since November 2025, and SK On and Hyundai opened a USD 5 billion battery manufacturing plant in North Georgia in July 2026 to supply the Hyundai Metaplant.
Product and portfolio diversification is widening demand beyond propulsion packs into low-voltage systems and adjacent storage applications supported by automotive-grade manufacturing. The market is actively prioritizing LFP expansion to address cost sensitivity, while liquid lithium-ion remains the volume-production standard. Solid-state efforts in 2026 are focused on pilot-line validation and sample shipments rather than mass integration, supporting opportunities for cathode and precursor joint ventures, battery management electronics for 12 V to 48 V architectures, and circular pathways that connect collection, diagnostics, and recycling into OEM and aftermarket service models.
Recent Industry Developments in Automotive Battery Market
- July 2026: LG Energy Solution commenced operations of new LFP cell production lines for ESS applications at the Ultium Cells plant in Spring Hill, Tennessee. The move broadens North American output beyond EV-focused chemistries and aligns cell manufacturing with local-content and supply-resilience priorities that influence battery procurement decisions.
- June 2026: CATL unveiled the Tener Sodium energy storage system and stated that commercial deliveries would begin in June 2027. The announcement highlights accelerating investment in alternative chemistries to reduce exposure to lithium and nickel constraints, with potential spillover into automotive qualification pathways as sodium-ion scales.
- February 2025: Idemitsu and Toyota Motor advanced a next-generation all-solid-state battery commercialization program, including plans for a new plant by June 2027 and an investment cited at 21.3 billion yen (about USD 143 million). The program reinforces continued OEM-led funding for post-lithium-ion platforms while signaling that near-term manufacturing focus remains on pilot-to-industrial transition steps.


Automotive Battery Market Report Scope and Research Methodology
Market Definition and Coverage
For this methodology, the automotive battery market covers batteries installed in on-road vehicles for starting, auxiliary power, and electric propulsion, counted in value terms at the point of sale across OEM and aftermarket channels.
Scope exclusions: We exclude batteries used in non-automotive uses (such as stationary energy storage and consumer electronics) even when the same chemistries are used.
Segments Covered in This Report
- By Battery Type
- Lead-Acid
- Lithium-ion
- Nickel-Metal Hydride
- Others (Li-S, Na-ion, Zinc-air)
- By Vehicle Type
- Passenger Cars
- Hatchback
- Sedan
- Multi-Purpose Vehicle and Sport-Utility Vehicle
- Commercial Vehicles
- Light Commercial Vehicles
- Medium and Heavy Trucks
- Bus and Coach
- Two-Wheelers
- Off-Highway
- Construction Equipment
- Agricultural Machinery
- Passenger Cars
- By Drive Type
- Internal Combustion Engine (SLI and Start-Stop)
- Hybrid (HEV and PHEV)
- Battery Electric Vehicle (BEV)
- Fuel-Cell Electric Vehicle (FCEV)
- By Application
- Starting-Lighting-Ignition (SLI)
- Propulsion
- Start-Stop
- Auxiliary/12 V Systems
- Battery-as-a-Service / Swap
- By Sales Channel
- OEM
- Aftermarket
- By Geography
- North America
- United States
- Canada
- Rest of North America
- South America
- Brazil
- Argentina
- Rest of South America
- Europe
- Germany
- France
- United Kingdom
- Italy
- Spain
- Rest of Europe
- Asia-Pacific
- China
- Japan
- India
- South Korea
- Rest of Asia-Pacific
- Middle-East and Africa
- United Arab Emirates
- Saudi Arabia
- Egypt
- South Africa
- Rest of Middle-East and Africa
- North America
Data Sources, Market Sizing, and Validation
Desk Research
We started with desk research to map demand and supply signals that can be checked through public sources, then used them to set up the market model. Common inputs came from sources such as International Energy Agency EV outlooks, International Organization of Motor Vehicle Manufacturers production statistics, UN Comtrade trade flows, USGS mineral summaries, and government transport and energy agencies in major markets.
After that, annual reports, earnings decks, and credible press were reviewed to understand pricing direction, capacity additions, and mix shifts between 12 V batteries and traction packs. When needed, we also relied on paid subscriptions for company financial intelligence, patent lookups, and shipment-level import and export views to support spot checks. These desk sources are illustrative only and not exhaustive, and we used additional public documents and data series for data collection, validation, and clarification.
Primary Interviews and Surveys
Primary work was used to pressure test assumptions that desk sources cannot settle cleanly, especially around average selling price movements, chemistry mix, and the split between OEM fitment and replacement demand. We spoke with a mix of battery suppliers, vehicle ecosystem participants, distributors, and industry experts across key regions, so gaps in regional adoption curves and pricing logic could be addressed before finalizing the model.
Distribution of primary research fieldwork respondents
| Company type | Respondent position | Region |
|---|---|---|
| Top tier: 27% | CXOs: 15% | APAC: 44% |
| Mid tier: 52% | Functional/Unit leaders: 30% | EMEA: 36% |
| Smaller Players: 21% | Managers: 55% | Americas: 20% |
Market-Sizing & Forecasting
Sizing was built using the top-down demand pool approach, where vehicle production, EV and hybrid penetration, and battery fitment rates are used to reconstruct annual battery demand by application and channel, then translated into value using observed price bands. To keep the totals realistic, outputs were cross-checked with selective bottom-up approximations, including sampled volume and price checks for major battery categories, plus channel-level sanity checks.
Practical inputs that moved the model included EV sales growth by region, average pack size trends, 12 V replacement cycles, chemistry mix shifts (lead-acid versus lithium-ion and emerging types), and commodity-linked cost direction that influences pricing. Forecasts were driven mainly through scenario analysis, where assumptions on adoption speed and price declines were tuned using expert feedback and then applied consistently across regions. Where bottom-up evidence was uneven, we used conservative interpolation between known anchor points and verified direction through follow-up checks.
Data Validation & Update Cycle
Results are validated through multiple checks so the final numbers do not rely on a single indicator. We compare totals against independent signals such as vehicle output trends, trade movements for battery categories, and public expansion or utilization commentary, then investigate variances that fall outside expected ranges.
Before sign-off, a second analyst review is completed, and respondents are re-contacted when a key assumption changes materially, such as an unexpected price shift or a policy-driven demand swing. The report is refreshed annually, with interim updates for material events, and a final pre-delivery pass is done so clients receive the latest view available at the time.
Mordor Intelligence's Automotive Battery Market Size Measured Against Other Published Estimates
Published market sizes for automotive batteries often differ because the refresh timing and pricing treatment can change the value outcome quickly, even when the underlying demand story is similar. Differences also come from what gets counted as automotive use, and whether replacement demand and OEM demand are handled with the same care.
When one estimate uses earlier currency conversion windows and smoother average selling price curves, the value can land lower in a year where pack sizes, chemistry mix, and vehicle mix are moving fast, and that refresh discipline is a key reason the final 2025 number differs in Mordor Intelligence.
Benchmark comparison
| Source | Market Size | Gaps in Research Methodology |
|---|---|---|
| Mordor Intelligence | USD 130.42 B (2025) | |
| Global Consultancy A | USD 79.18 B (2025) | Often applies a narrower counted set of automotive battery uses and leans on conservative pack pricing with earlier-year currency conversion timing, which can understate traction value in high growth regions. |
| Industry Publisher B | USD 80.12 B (2025) | Typically assumes steadier price declines and longer replacement intervals, which can dampen value when OEM fitment growth and pack-size progression are changing quickly across regions. |
The spread across figures is mainly explained by how fast pricing inputs are refreshed, how traction versus 12 V demand is separated, and whether OEM and aftermarket value are both captured. We keep the steps repeatable by tying the totals to vehicle output, adoption indicators, and price checks that can be re-run during the next update cycle.


Key Questions Answered in the Report
What is driving growth in automotive batteries through 2031?
Growth is being led by EV adoption, larger battery requirements in commercial vehicles, policy support for local manufacturing, and a wider role for batteries in second-life and grid-linked applications.
How large will this space become by 2031?
The automotive battery market is forecast to reach USD 349.23 billion by 2031 from USD 153.67 billion in 2026, at a 17.84% CAGR over 2026-2031.
Which battery type still leads revenue today?
Lead-Acid remained the largest battery type in 2025 with 48.72% share because the installed ICE fleet still creates a very large and steady replacement cycle.
Which vehicle segment is creating the strongest incremental battery demand?
Commercial Vehicles is projected to grow fastest at 18.61% CAGR, and its impact is amplified because one electric heavy truck can require battery capacity equal to 3 to 4 passenger cars.
Page last updated on:


 Your data is secure and never sold or shared.


