
Automotive and Transportation Connector Market Size and Share
Market Overview
| Study Period | 2020 - 2031 |
|---|---|
| Market Size (2026) | USD 15.02 Billion |
| Market Size (2031) | USD 18.91 Billion |
| Growth Rate (2026 - 2031) | 4.69 % |
| Fastest Growing Market | Asia Pacific |
| Largest Market | Asia Pacific |
| Market Concentration | Medium |
Major Players *Disclaimer: Major Players sorted in no particular order Image © Mordor Intelligence. Reuse requires attribution under CC BY 4.0. | |
Automotive and Transportation Connector Market Analysis by Mordor Intelligence
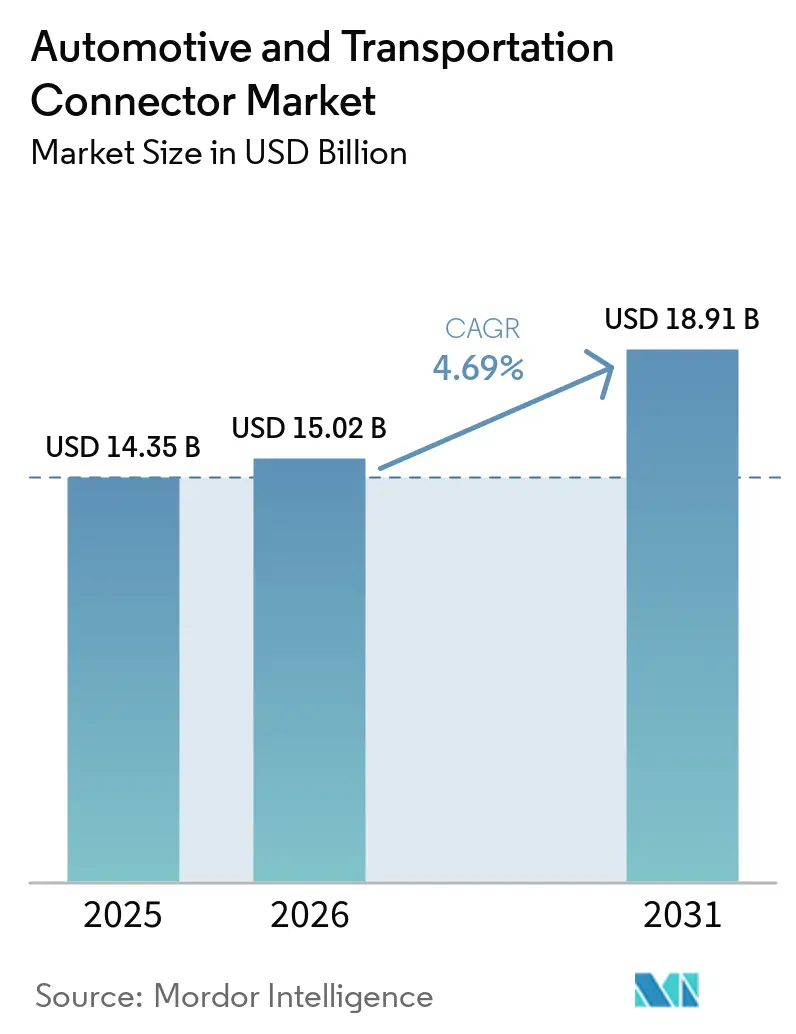
The automotive and transportation connector market size in 2026 is estimated at USD 15.02 billion, growing from 2025 value of USD 14.35 billion with 2031 projections showing USD 18.91 billion, growing at 4.69% CAGR over 2026-2031. Growth now hinges less on sheer unit volume and more on the design complexity that supports high-voltage electrified powertrains, multi-gigabit data exchange for automated driving, and fast-evolving global compliance regimes. Demand bifurcates between legacy wire-to-board formats that anchor mature body-wiring looms and advanced high-density interfaces required for zonal vehicle architectures. Automakers’ shift to software-defined platforms keeps data-rate performance in focus, while sourcing policies shaped by geopolitical concerns push design engineers to qualify multiple regional supply bases. These crosscurrents elevate development spending on high-reliability seals, electromagnetic shielding, and thermal management, allowing suppliers that master these disciplines to capture outsized value per vehicle.
Key Report Takeaways
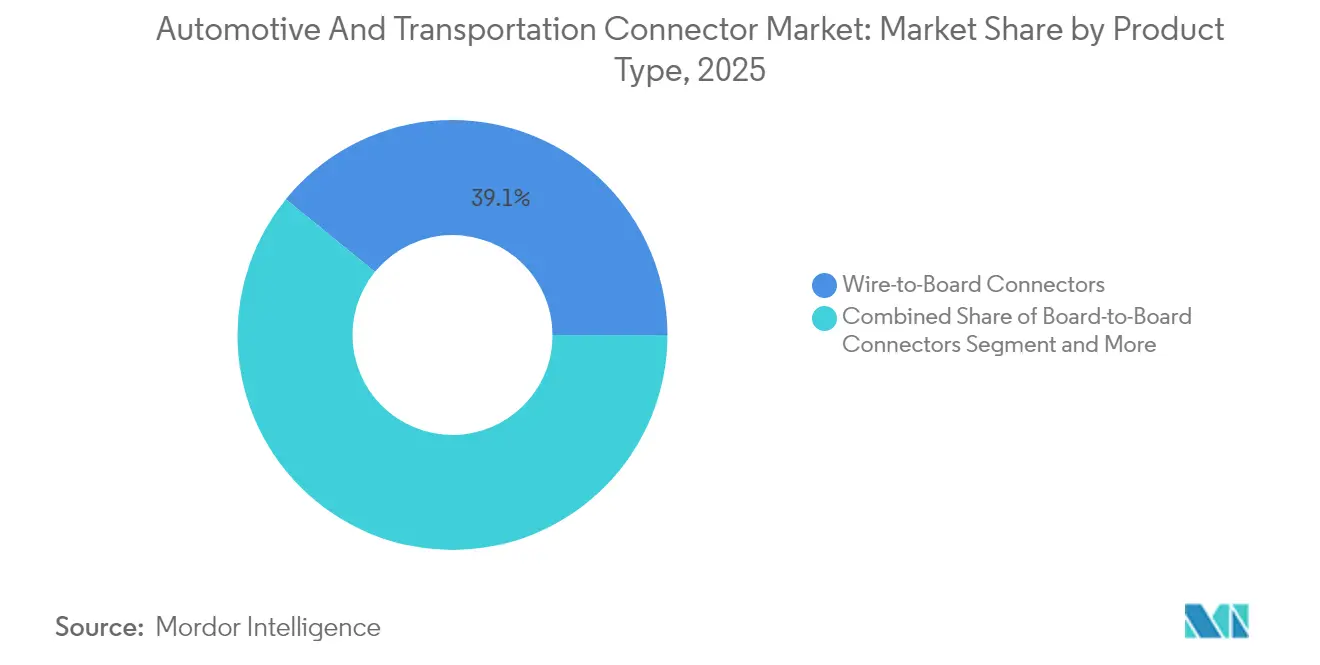
- By product type, wire-to-board solutions led with 39.12% of the automotive and transportation connector market share in 2025, whereas high-voltage/EV interfaces are projected to expand at a 9.17% CAGR through 2031.
- By application, body wiring and power distribution held a 37.74% share of the automotive and transportation connector market size in 2025, while advanced driver-assistance/autonomous electronics are forecast to grow at 11.74% CAGR.
- By vehicle type, passenger cars dominated with 47.10% revenue share in 2025; light commercial vehicles post the fastest expected CAGR at 6.78% to 2031.
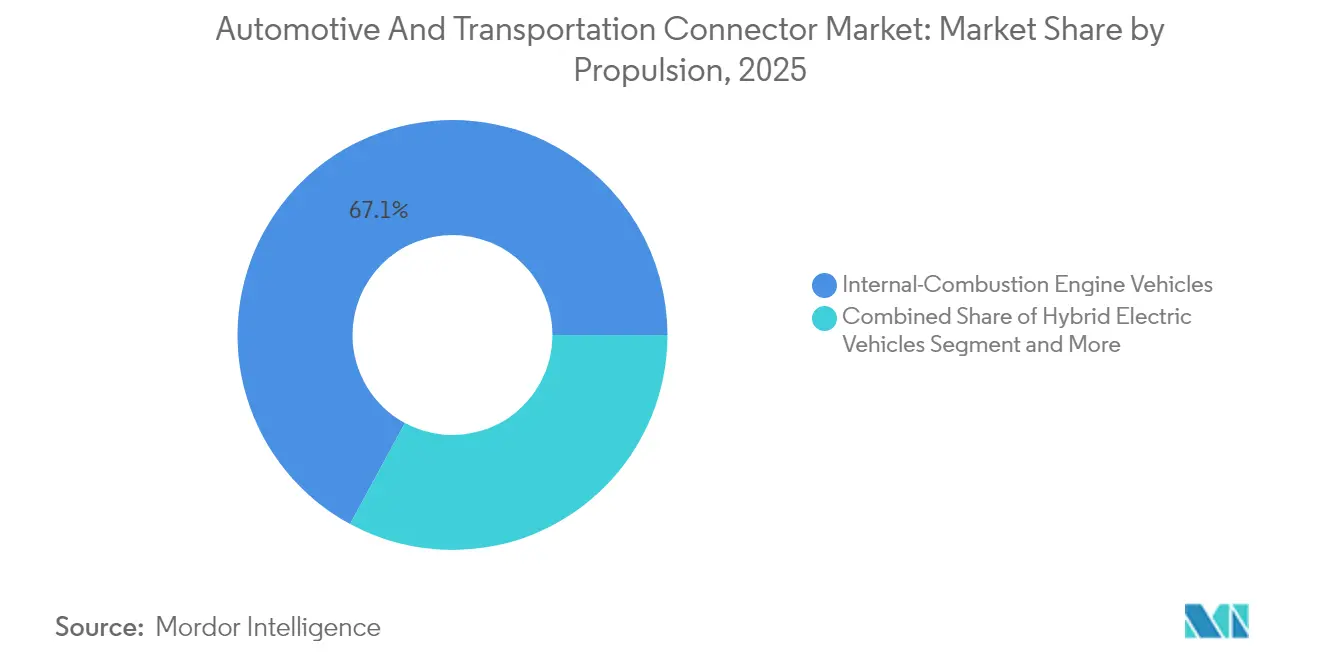
- By propulsion, internal-combustion platforms retained a 67.10% share in 2025, yet battery electric vehicles will rise at a 6.85% CAGR.
- By sales channel, the OEM route commanded 86.90% of 2025 shipments, though aftermarket business is climbing 7.05% CAGR on retrofit demand.
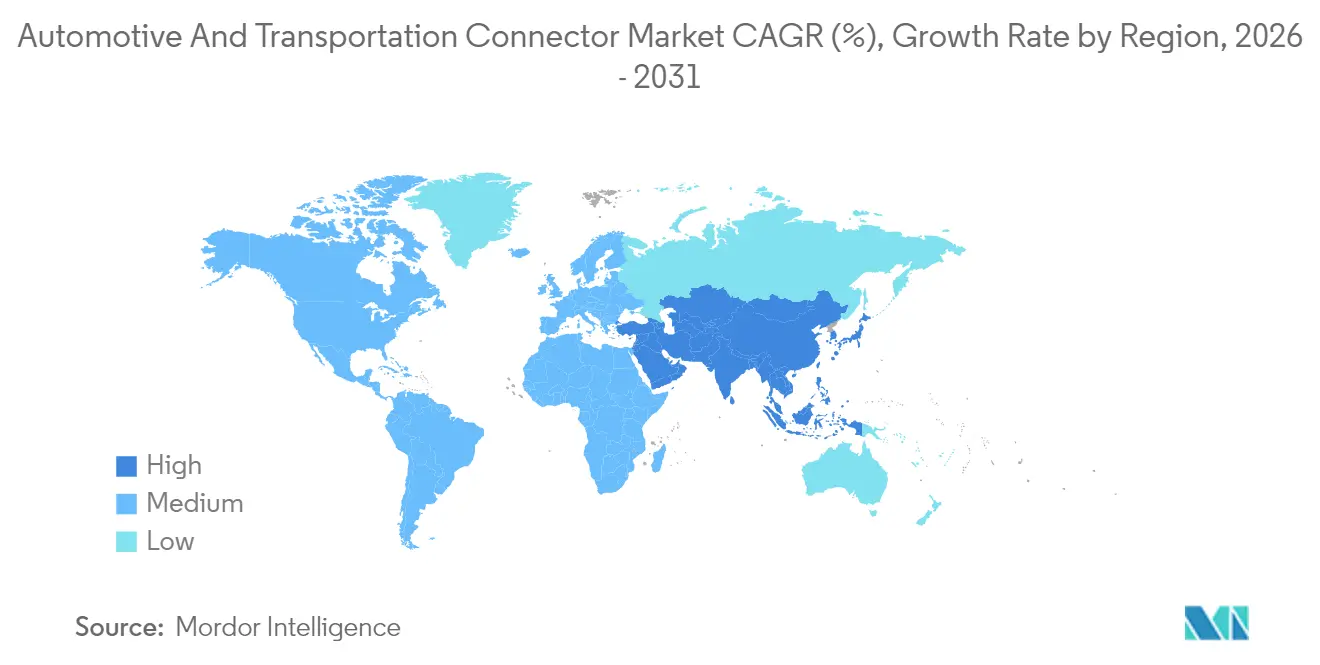
- By geography, Asia-Pacific captured 45.05% of 2025 revenue and is advancing at 5.03% CAGR, powered by Chinese electric-vehicle production scale.
Note: Market size and forecast figures in this report are generated using Mordor Intelligence’s proprietary estimation framework, updated with the latest available data and insights as of 2026.
Market Trends and Insights
Drivers Impact Analysis of Automotive and Transportation Connector Market*
| Driver | (~) % Impact on CAGR Forecast | Geographic Relevance | Impact Timeline |
|---|---|---|---|
| Electrification Surge Spurs High-Voltage Connector Demand | +1.2% | Global, led by APAC and Europe | Medium term (2-4 years) |
| ADAS & Infotainment Drive High-Speed Data Connectors | +0.9% | North America and EU premium models; expanding to APAC | Short term (≤ 2 years) |
| Zonal E/E Shift Boosts High-Density Board-Edge Connectors | +0.8% | Global premium OEMs | Medium term (2-4 years) |
| ISO 26262 & UN R155 Raise Reliability Requirements | +0.6% | Global with stricter EU and North-American enforcement | Long term (≥ 4 years) |
| Gigabit Ethernet & FAKRA-Mini Coax Migration | +0.5% | Global, early in premium vehicles | Short term (≤ 2 years) |
| Emerging 48 V Sub-Systems in ICE Vehicles | +0.4% | Global, fastest in Europe | Medium term (2-4 years) |
| Source: Mordor Intelligence | |||
Electrification Surge Spurring High-Voltage Connector Demand
Electric vehicles require nearly three times more copper than comparable combustion models, driving a parallel jump in connector amperage and creepage design discipline. In the EV connector market, Plug-in Hybrid Electric Vehicles maintain steady demand in markets with limited charging infrastructure, while Hybrid Electric Vehicles require specialized connectors for battery management and power distribution between electric and internal combustion systems. TE Connectivity’s AMP+ range already supports 800 V architectures, using touch-safe housings and optimized insulation paths that withstand charging currents above 350 A [1]. Immersion-cooled connector assemblies are emerging as currents climb, ensuring thermal limits during ultra-fast charging sessions. Suppliers capable of balancing dielectric strength, vibration resistance, and automated manufacturability gain preferred-source status among global EV programs.
ADAS and Infotainment Integration Driving High-Speed Data Connectors
Autonomous prototypes generate over 4 TB of data per day, dictating connector systems that endure high vibration while transmitting 20 GHz signals at under-1 dB insertion loss. Aptiv’s H-MTD miniature coax family meets 56 Gbps requirements within a sealed automotive housing, shrinking footprint versus legacy FAKRA designs. Ethernet shifts such as 1000BASE-T1 simplify wiring harnesses to a single twisted pair, supporting weight reduction targets on premium vehicles. Reliable connector EMI performance directly shapes camera-based sensor fusion accuracy that underpins level-3 autonomy.
Shift to Zonal Architectures Boosting High-Density Board-Edge Connectors
Consolidated zone controllers cut harness length by up to 85% and demand board-edge connectors that combine power, data, and signal in stackable arrays. Molex’s MX-DaSH hybrid system illustrates the trend, embedding 20 Gbps differential pairs alongside 50 A power blades within a compact housing that supports automated insertion [2]. Suppliers offering such multifunctional blocks raise their content per vehicle and help OEMs transition toward centralized computing.
Safety-Critical Compliance Heightening Reliability Needs
ISO 26262 demands quantitative proof that connector hardware cannot jeopardize functional safety goals, pushing suppliers to demonstrate single-digit FIT rates across a 15-year service life. UN R155 adds cybersecurity obligations, so housing now integrates tamper-evident seals and secure back-shells that resist probing. The 2024 publication of ISO/PAS 8800 extends oversight to AI-enabled condition monitoring, compelling connector makers to embed diagnostic circuitry that can flag thermal aging before failures emerge.
Restraints Impact Analysis of Automotive and Transportation Connector Market*
| Restraint | (~) % Impact on CAGR Forecast | Geographic Relevance | Impact Timeline |
|---|---|---|---|
| Copper-price Volatility Inflating BOM Costs | -0.8% | Global, strongest in cost-sensitive regions | Short term (≤ 2 years) |
| Local-sourcing Mandates limiting Low-cost Procurement | -0.6% | North America, EU and China | Medium term (2-4 years) |
| Recalls from Connector Seal or Crimp Failures | -0.4% | Global with strict developed-market oversight | Medium term (2-4 years) |
| Rising In-vehicle Wireless Sensor Nodes reducing Hard-wired Ports | -0.3% | Global, earliest in premium models | Long term (≥ 4 years) |
| Source: Mordor Intelligence | |||
Copper-Price Volatility Inflating BOM Costs
Global copper supply lags electrification demand, and the US Geological Survey notes declining ore grades lift extraction costs, contributing to price swings that averaged USD 8,490 per tonne in 2024. Connector bills of material are therefore indexed more frequently, and engineering teams test aluminum alloys for non-critical power pins even though conductivity remains lower. Recycling now covers 32% of worldwide copper consumption, but automotive-grade cleanliness limits still confine the practice [3].
Local-Sourcing Mandates Limiting Procurement Flexibility
National-security rules now compel automakers to regionalize electronics sourcing, eroding long-standing cost-arbitrage strategies. The U.S. Connected Vehicles Rule bans connectivity systems that originate in China or Russia from model year 2027 onward, obliging manufacturers to provide full traceability dossiers and restructure procurement footprints. China already requires 25% local chip content by 2025, while Taiwan enforces minimum domestic-value thresholds that raise component costs. These overlapping mandates fragment supply networks, multiply qualification and inventory costs, and shrink competitive bidder pools, pressuring connector margins even as compliance-tracking software and audit protocols add overhead.
*Our forecasts treat driver/restraint impacts as directional, not additive. The impact forecasts reflect baseline growth, mix effects, and variable interactions.
Automotive and Transportation Connector Market Segment Analysis
By Product Type:
High-Voltage Interfaces Outpace Legacy FormatsWire-to-board designs kept 39.12% of 2025 revenue, confirming their evergreen role in instrumentation panels, yet the automotive and transportation connector market now directs major R&D toward high-voltage assemblies that will grow 9.17% CAGR to 2031. The high-current category benefits from silicon-carbide inverters operating at 800 V, which demand reinforced creepage gaps and liquid-cooled pins. RF & coax connectors also gain renewed relevance as radar and camera counts increase. Suppliers such as JAE incorporate electromagnetic locks and emergency unmating in 200 A CHAdeMO plugs to satisfy global safety codes.
Standard ECU packaging still leans on board-to-board mezzanine decks, but zonal hardware elevates density beyond 120 pins per inch. Hybrid housings that mix signal and 50 A blades inside one header reduce SKU count and simplify automated pick-and-place. As a result, module integrators now treat the connector as a functional sub-system rather than a commodity fastening point, sustaining premium pricing inside the automotive and transportation connector market.

By Application:
Data-Centric Domains Capture Budget ShareBody wiring and power distribution commanded 37.74% of 2025 spend, yet ADAS and autonomous electronics will log a 11.74% CAGR as camera, radar, and lidar sensor proliferation intensifies. That uptrend positions ADAS connectivity as the fastest pathway to margin expansion for specialized suppliers. Cockpit entertainment platforms follow closely because immersive displays and over-the-air upgrades need multi-gigabit backbones.
The automotive and transportation connector market size for powertrain and battery systems is projected to climb in tandem with EV unit growth, opening space for scale economies on shielded high-voltage interfaces. Meanwhile, safety-security modules integrate redundant power pins within a single housing, limiting space overhead while meeting ISO 26262 diagnostics requirements.
By Vehicle Type:
Passenger Cars Anchor Demand SpectrumPassenger cars accounted for the largest share of revenue in 2025, delivering 47.10%, and are expected to grow at a CAGR of 5.98% over the forecast period. However, the light commercial vehicle (LCV) segment is projected to be the fastest growing, with a CAGR of 6.78%. Commercial fleets are increasingly adopting telematics-enabled maintenance planning, which boosts connector content per vehicle, particularly as fleet operators begin piloting autonomous platooning. In India and Southeast Asia, two-wheeler electrification is driving demand for miniature battery connectors capable of withstanding intense monsoon conditions.
Light commercial vans, especially in last-mile delivery, are seeing increased connector counts as refrigerated payloads require independent 48 V power loops. Meanwhile, heavy commercial vehicles are adopting redundant 2-wire Ethernet backbones to ensure fail-operational control of steering and braking systems, further expanding the automotive and transportation connector market beyond traditional passenger vehicle applications.
By Propulsion:
Dual-Track Portfolio Requirements IntensifyInternal-combustion offerings kept 67.10% 2025 share, so connector roadmaps must support both legacy 12 V nets and 48 V mild-hybrid add-ons. The automotive and transportation connector market share for battery electric drivetrains will rise at a 6.85% CAGR, accelerating unit volumes, propelling high-voltage pin shipments. Hybrid and plug-in hybrid variants demand dual power domains, increasing interface counts by 30-40% versus pure ICE.
Connector vendors hedge propulsion uncertainty by modularizing contact geometry so common housings can swap between 400 V and 800 V blades. That flexibility reduces retooling costs and positions suppliers to serve multiple OEM cycle plans regardless of propulsion mix.
By Sales Channel:
OEM Integration Dominates but Aftermarket Momentum BuildsThe OEM route absorbed 86.90% of 2025 orders because connectors must be fixed during final assembly; nonetheless, 7.05% aftermarket CAGR showcases rising vehicle electrification retrofits and infotainment upgrades. Standardization programs such as Tesla’s low-voltage connector family simplify service-bay diagnostics, encouraging distributors to stock automotive-grade parts for collision repair networks.
Component houses like Mouser now carry sealed headers rated for -40 °C to 125 °C and cross-reference them to VIN-decoded service manuals, enabling independent garages to participate in technology refresh cycles. The trend widens exposure for second-tier connector brands, otherwise missing from OEM nomination lists, expanding the automotive and transportation connector market.
Geography Analysis
APAC Automotive and Transportation Connector Market
Asia-Pacific contributed 45.05% of 2025 revenue, reflecting its position as both the world’s largest vehicle assembly hub and the fastest-growing electric-mobility cluster. Chinese OEMs generate concentrated demand for high-voltage and battery-management connectors, while Japan and Korea supply precision board-to-board and coaxial formats for global premium nameplates. Indonesia’s passenger-car output of 1.4 million units in 2024 underscored Southeast Asia’s rise as a secondary production base that stimulates local connector tooling even as US sourcing rules tighten qualification paths for Chinese-made parts.
North America Automotive and Transportation Connector Market
North America maintains premium-truck demand that favors sealed circular power connectors rated beyond IP68. The Inflation Reduction Act channels incentives into domestic battery plants, spurring localized high-voltage terminal supply. Canadian copper output of 508,250 tonnes in 2024 shores up raw-material availability for regional stamping operations that hedge price shocks. Connector makers also confront upcoming U.S. content rules slated for 2027 that bar Chinese telematics modules, accelerating dual-source qualifications.
EMEA Automotive and Transportation Connector Market
Europe combines advanced EV production with cost pressure from surging imports. Germany built 1.35 million electric cars in 2024, yet EU manufacturers lost 53,669 jobs in the same year. The European Commission’s Strategic Dialogue is funneling Horizon funds into interoperable 10BASE-T1S networking to cut harness weight, while Middle East and African projects tap Gulf smart-city investments and South-African export contracts. The UK’s pledge to lower industrial power tariffs by 25% from 2027 aims to restore connector stamping competitiveness.
Regulatory Landscape
Automotive and transportation connectors are shaped by a combination of safety, electromagnetic compatibility, cybersecurity, and charging-interface standards, which increasingly affect connector design verification and supplier documentation. ISO continued to shape harness-connector requirements through its wiring-harness connector standard ISO 8092-5:2021, which entered a systematic review in January 2026 and was confirmed by June 2026. This sustains continuity in qualification expectations for suppliers serving global OEM programs.
Electrification and connected-vehicle policy are adding new compliance checkpoints. IEC published IEC TS 62196-7:2026 in January 2026 to define requirements for DC charging vehicle adapters, tightening interoperability and safety expectations for charging-related interfaces. In the United States, the Bureau of Industry and Security (BIS) connected-vehicle rule finalized in January 2025 took effect in March 2025, restricting connected vehicle hardware and software with a sufficient nexus to China or Russia (with software prohibitions applying to MY2027 vehicles and hardware to MY2030). This raises traceability demands for connectors embedded in vehicle connectivity systems. China also signaled continuing standards acceleration via MIITs 2026 Key Tasks for Automotive Standardization roadmap (June 2026), prioritizing intelligent connected vehicles, high-power charging, and data security, which increases local test and certification workloads for suppliers operating in China.
Value Chain Analysis
The value chain starts with copper alloys and engineered polymers, then moves through precision stamping, plating, and injection molding, followed by contact assembly, sealing and overmolding, and automated crimping into pigtails or harness sub-assemblies. Tier-1 harness makers and module suppliers integrate connectors into wiring looms, battery and power distribution units, and ADAS and infotainment modules before delivery to OEM vehicle plants. Distribution also includes authorized component channels that support service and retrofit demand. A structural bottleneck remains in OEM validation cycles, commonly spanning 24 to 36 months for new connector families, which limits rapid substitution even when cost or availability shifts.
Resilience actions in 2025-2026 focus on dual-location manufacturing and regional end-assembly and testing near OEM footprints to manage trade and security constraints while maintaining cost-competitive upstream processing. Industry consolidation and vertical integration are also visible in wiring and connector adjacencies, including Luxshare-ICT completing the acquisition of a 50.1% stake in Leoni AG and 100% of its Automotive Cable Solutions (ACS) division in July 2025. This strengthens European access and integration across cable, harness, and connectivity elements. Tooling and capacity lead times remain a constraint for high-precision formats, with extended tooling cycles noted into early 2026. That supports strategic buffering and multi-sourcing for high-voltage and high-speed connector programs.
Competitive Landscape
Industry concentration accelerated, and scale advantages in automated crimping and polymer over-molding underpin continued acquisition activity. TE Connectivity and Amphenol extended reach through more than USD 3.2 billion in combined takeovers that brought thermal-management and fiber-optic know-how on board. Molex pursues zonal-architecture leadership via hybrid MX-DaSH connectors bundling 20 Gbps pairs with 50 A power blades.
Aptiv is separating its conventional wiring division to sharpen its focus on data-centric modules. Komax automated crimp-validation suites cut harness defect rates to one per ten million crimps, meeting zero-PPM mandates. Contactless inductive connectors remain an emerging niche, but pilot deployments in battery-swap stations indicate a future mobility use case that could disrupt traditional mechanical pin revenue streams.
Price competition intensifies for commodity wire-to-wire housings, yet technology leaps in board-edge and coax assemblies grant top-tier firms double-digit operating margins. Suppliers that master supply-chain traceability and region-for-region manufacturing stand to win incremental share as geopolitical pressures localize sourcing inside the automotive and transportation connector market.
Automotive and Transportation Connector Industry Leaders
-
Yazaki Corporation
-
TE Connectivity
-
Aptiv PLC
-
Molex (Koch Industries)
-
Sumitomo Electric Industries
- *Disclaimer: Major Players sorted in no particular order

Automotive and Transportation Connector Market Companies Covered in this Report
- TE Connectivity
- Yazaki Corporation
- Aptiv PLC
- Amphenol Corporation
- Molex (Koch Industries)
- Sumitomo Electric Industries
- Lear Corporation
- Leoni AG
- Korea Electric Terminal (KET)
- Rosenberger Hochfrequenztechnik
- Luxshare Precision Industry
- JST Mfg.
- HARTING Technology Group
- Furukawa Electric
- ITT Cannon
- Hirose Electric
- Japan Aviation Electronics (JAE)
Read Analysis of Automotive and Transportation Connector Companies
Market Opportunities and Future Outlook
Opportunities are concentrated where OEM programs are spending to electrify powertrains and raise in-vehicle data rates, which increases connector content and qualification intensity per vehicle. North American manufacturing investment is creating specific whitespace for locally qualified connector supply tied to new lines and battery capacity: Toyota Motor North America announced a USD 3.6 billion investment (July 2026) to add a second vehicle assembly line in San Antonio, Texas, expanding the campus by 2.5 million square feet by 2030. Hyundai Motor Group began early-stage production at its USD 5 billion battery joint-venture plant with SK On in Bartow County, Georgia (July 2026). These projects support demand for regionalized supply of high-voltage and power distribution interfaces, sealed low-voltage connectors, and battery-system connectivity aligned to localized sourcing and traceability requirements.
Technology migration in software-defined and zonal architectures is also shifting demand toward higher-speed, lower-mass interconnect solutions and new test and validation services. The publication of ISO 24581:2024 for in-vehicle optical harnesses and connectors (up to 100 Gbit/s) expands the standards-backed pathway for optical and high-speed data interconnects in vehicles, while ongoing work in SAE and ISO committees reinforces performance-based connector qualification. Paired with OEM moves toward higher-speed automotive Ethernet and tighter cybersecurity compliance for connected-vehicle systems, suppliers with validated USCAR-aligned sealing, EMI control, and traceable manufacturing footprints can pursue content gains in next-generation electrical and electronic architectures across passenger and commercial platforms.
Recent Industry Developments in Automotive and Transportation Connector Market
- July 2026: Aptiv and Kyndryl partnered on edge AI and cloud deployment for the enterprise, connecting vehicle and industrial edge use cases with scalable cloud operations. The collaboration aligns ADAS and software-defined vehicle ecosystems with broader deployment and lifecycle management capabilities, reinforcing demand for robust in-vehicle data connectivity and validated interconnect solutions.
- July 2025: Luxshare-ICT completed the acquisition of a 50.1% stake in Leoni AG and 100% of its Automotive Cable Solutions division. The move strengthens European access and integration across cable, harness, and connectivity elements.
- May 2024: Molex unveiled MX-DaSH hybrid connectors that merge power, signal, and high-speed data for zonal architectures. The product direction supports the shift toward consolidated zone controllers and higher connector content per computing node, increasing the value share of modular and hybrid interfaces.
Automotive and Transportation Connector Market Report Scope and Research Methodology
Market Definition and Coverage
This market covers revenue earned from connectors used to make reliable electrical and signal connections in road vehicles and broader transportation platforms. It includes common interconnect formats used in vehicle electronics and wiring architectures, where demand is tied to vehicle production and electronic content per vehicle.
Scope exclusions: We exclude standalone wire and cable without connector terminations, as well as test equipment and installation tools that are not sold as connector hardware.
Segments Covered in This Report
- By Product Type
- Wire-to-Board Connectors
- Board-to-Board Connectors
- Wire-to-Wire Connectors
- High-Voltage/EV Connectors
- RF & Coax Connectors
- Modular/Hybrid Connectors
- By Application
- Safety and Security
- Body Wiring and Power Distribution
- Cockpit, Connectivity and Entertainment (CCE)
- Powertrain and Battery Systems
- Advanced Driver-Assistance/Autonomous
- By Vehicle Type
- Passenger Cars
- Light Commercial Vehicles
- Medium and Heavy Commercial Vehicles
- Two-Wheelers
- By Propulsion
- Internal-Combustion Engine Vehicles
- Hybrid Electric Vehicles
- Plug-in Hybrid Electric Vehicles
- Battery Electric Vehicles
- By Sales Channel
- OEM
- Aftermarket
- By Geography
- North America
- United States
- Canada
- Rest of North America
- South America
- Brazil
- Argentina
- Rest of South America
- Europe
- Germany
- United Kingdom
- France
- Italy
- Spain
- Russia
- Rest of Europe
- Asia Pacific
- China
- Japan
- South Korea
- India
- Rest of Asia Pacific
- Middle East and Africa
- Saudi Arabia
- United Arab Emirates
- Egypt
- Turkey
- South Africa
- Rest of Middle East and Africa
- North America
Data Sources, Market Sizing, and Validation
Desk Research
Desk research was used to set the base structure for the model and to align definitions across regions, vehicle types, and connector use cases. We relied on public data points that show where vehicles are produced and sold, how fast electrification is progressing, and how electrical architectures are changing.
Common sources included official vehicle production and registration statistics such as OICA and national transport departments, trade data from customs portals and UN Comtrade, and policy and safety references such as NHTSA and UNECE regulations. We also reviewed standards and technical context from bodies such as SAE and IEC, along with peer reviewed papers that explain connector performance needs in harsh automotive environments. Company filings, investor presentations, and reputable press were used to validate product focus and regional exposure, and a paid subscription for company financials and patent intelligence helped with cross checks where public disclosure was thin. These sources are illustrative, and many other public references were also reviewed for data collection, validation, and clarification.
Primary Interviews and Surveys
Primary work was used to test the demand pool logic and to correct assumptions around connector content per vehicle, ASP movement, and mix shifts by application (for example, safety and security versus body wiring and power distribution). We spoke with a balanced set of participants across connector manufacturing, component distribution, vehicle electrical engineering, and transportation OEM supply chains across APAC, EMEA, and the Americas. Gaps found in desk research were revisited until the numbers were internally consistent.
Distribution of primary research fieldwork respondents
| Company type | Respondent position | Region |
|---|---|---|
| Top tier: 36% | CXOs: 19% | APAC: 40% |
| Mid tier: 45% | Functional/Unit leaders: 30% | EMEA: 33% |
| Smaller Players: 19% | Managers: 51% | Americas: 27% |
Market-Sizing & Forecasting
Sizing starts with a top-down build that reconstructs connector demand from vehicle production by region, then applies penetration and content assumptions linked to electronic architecture intensity. For each major vehicle group, the model uses a practical chain of inputs, which include vehicle output and sales trends, EV and hybrid mix, the shift toward higher voltage systems, growth in ADAS and in-cabin electronics, and typical connector count and value by application area.
Those totals are then checked with selective bottom-up approximations, such as sampled ASP times estimated connector volumes for key application buckets, plus supplier and channel checks gathered during interviews. Where direct disclosure is limited, we fill gaps by using range-based assumptions for connector value per vehicle and then narrowing them with expert feedback and cross-region consistency checks.
Forecasts are built using scenario analysis, where the main drivers are vehicle build outlook, electrification speed, and electronics content growth, and then the slope is pressure-tested with interview consensus on pricing and mix. In the final step, growth rates are adjusted to keep them aligned with realistic adoption timing and the expected pace of platform redesigns.
Data Validation & Update Cycle
Outputs are validated through a set of cross checks so the final totals do not rely on a single data series. We compare implied connector spend per vehicle against known electronics content trends, test region splits against trade and production signals, and review outliers that appear too high or too low versus prior-year patterns.
A multi-step internal review is run before sign-off, and follow-up outreach is triggered when a key assumption shifts, such as a large swing in vehicle production outlook or an unexpected change in EV penetration. The report is refreshed on an annual cycle, and interim updates are added when material events affect production, pricing, or supply continuity. Before delivery, a final analyst pass is completed so clients receive the latest updated view.
Mordor Intelligence's Automotive and Transportation Connector Market Size Measured Against Other Published Estimates
Published numbers for automotive and transportation connectors often differ because firms do not always match on what is counted as a connector, which transportation modes are included, and whether values are reported at manufacturer revenue or at a broader channel level.
The table shows a wide spread across 2024 and 2026 estimates. In Mordor Intelligence's model, the total is anchored to a vehicle-led demand build (production and electrification mix by region) and counted around connector hardware used in automotive and transportation applications, which helps avoid pulling in wiring-only content or broader electrical components.
Benchmark comparison
| Source | Market Size | Gaps in Research Methodology |
|---|---|---|
| Mordor Intelligence | USD 15.02 B (2026) | |
| Global Consultancy A | USD 22.80 B (2024) | Uses an earlier base year and appears to apply a broader connector revenue scope, which can include wider electrical interconnect content and higher assumed electronics value per vehicle without the same vehicle-output reconciliation. |
| Industry Research Group B | USD 7.80 B (2024) | Reports a smaller 2024 base that likely reflects a narrower product mapping and more conservative ASP progression, and the approach may not fully capture transportation use cases beyond core automotive applications. |
Looking across the three figures, the differences are mainly explained by scope boundaries, base-year selection, and how per-vehicle content and ASP changes are carried forward. By tying the model to observable vehicle and electrification indicators and then checking it with targeted bottom-up sanity tests, the estimate stays traceable to clear inputs and can be repeated when new production or mix data becomes available.
Key Questions Answered in the Report
What is the current size of the automotive and transportation connector market?
The market is valued at USD 15.02 billion in 2026 and is forecast to reach USD 18.91 billion by 2031 at a 4.69% CAGR.
Which product category holds the largest share today?
Wire-to-board connectors account for 39.12% of market revenue, reflecting their foundational role in body-wiring systems.
Why are high-voltage connectors growing faster than other types?
Electric-vehicle programs need 800 V architecture and 350 A charging capacity, pushing demand for specialized high-voltage interfaces at a 9.17% CAGR.
Which region leads global demand?
Asia-Pacific captures 45.05% of revenue thanks to China’s EV scale and expanding Southeast-Asian production hubs.