
Automotive Airbags Market Size and Share
Market Overview
| Study Period | 2021 - 2031 |
|---|---|
| Market Size (2026) | USD 31.14 Billion |
| Market Size (2031) | USD 53.13 Billion |
| Growth Rate (2026 - 2031) | 11.30 % |
| Fastest Growing Market | Middle East and Africa |
| Largest Market | Asia-Pacific |
| Market Concentration | Medium |
Major Players *Disclaimer: Major Players sorted in no particular order Image © Mordor Intelligence. Reuse requires attribution under CC BY 4.0. | |
Automotive Airbags Market Analysis by Mordor Intelligence
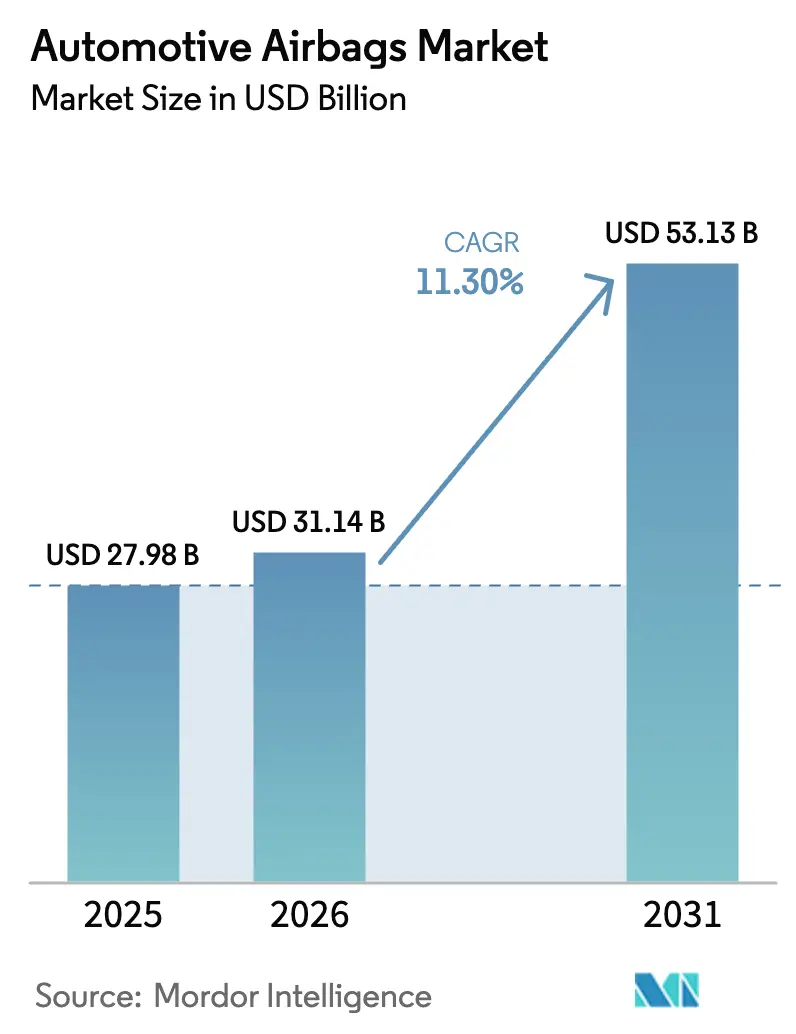
The automotive airbags market size is expected to grow from USD 27.98 billion in 2025 to USD 31.14 billion in 2026 and is forecast to reach USD 53.13 billion by 2031 at 11.30% CAGR over 2026-2031. Tighter frontal and side-impact regulations in emerging economies, the accelerating shift to electric vehicles, and sustained SUV demand provide the strongest tailwinds. Automakers are integrating more sensors and smarter electronic control units to fine-tune deployment, while suppliers invest in lighter fabrics that meet both sustainability and weight-reduction goals. The semiconductor shortage remains the chief near-term bottleneck, yet proactive inventory strategies and long-term supply agreements are mitigating its sting. Heightened retrofit activity—spurred by insurance incentives and rising safety awareness—adds another layer of momentum for the automotive airbags market.
Key Report Takeaways
- By vehicle type, passenger cars led the automotive airbags market with a 71.88% revenue share in 2025, while commercial vehicles are projected to expand at an 8.12% CAGR through 2031 as safety mandates extend to trucks and buses.
- By propulsion type, battery electric vehicles (BEVs) are emerging as the fastest-growing sub-segment, expected to grow at a 14.85% CAGR, even though ICE vehicles still dominate with an 86.65% share.
- By component, airbag modules held a 52.10% share in 2025, but crash sensors and ECUs are growing fastest at a 11.95% CAGR, driven by rising demand for algorithm-optimized deployment precision.
- By material, nylon 66 remained the dominant choice with a 65.95% share in 2025, while polyester is expected to grow at a 13.05% CAGR owing to its cost-effectiveness and recyclability.
- By airbag position, front airbags accounted for 39.05% of the market in 2025, whereas curtain airbags are projected to grow at a 13.85% CAGR, supported by heightened side-impact safety focus.
- By sales channel, OEMs contributed 90.75% of the market in 2025, but the aftermarket is gaining momentum with a 13.45% CAGR, fueled by growing retrofit demand and safety regulation compliance.
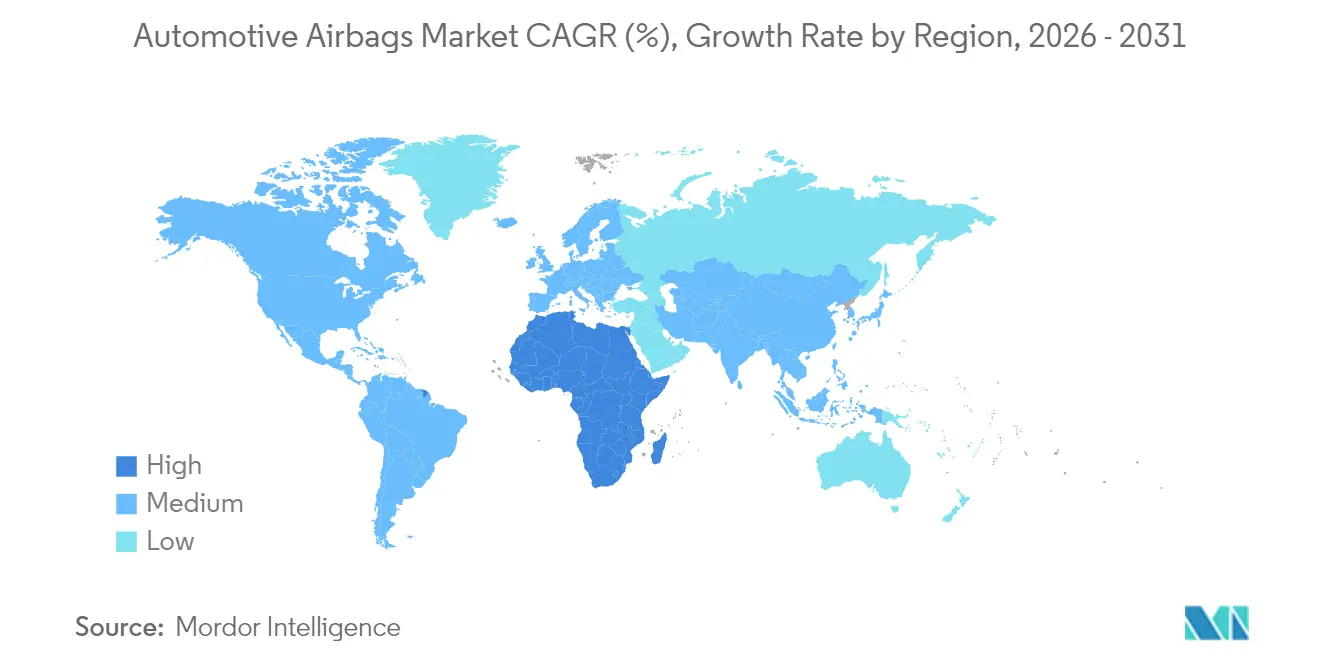
- By geography, Asia-Pacific dominated with a 42.10% market share in 2025, while the Middle East and Africa is set to be the fastest-growing region with a 14.90% CAGR through 2031, aided by rising new vehicle production and import-based airbag integration.
Note: Market size and forecast figures in this report are generated using Mordor Intelligence’s proprietary estimation framework, updated with the latest available data and insights as of 2026.
Market Trends and Insights
Drivers Impact Analysis of Automotive Airbags Market*
| Driver | (~) % Impact on CAGR Forecast | Geographic Relevance | Impact Timeline |
|---|---|---|---|
| Dual-Airbag Rules in Developing Market | +2.3% | India, Southeast Asia, Latin America | Short term (≤ 2 years) |
| Frontal and Side-Impact Mandates in Emerging Market | +2.1% | India, Brazil, ASEAN | Medium term (2-4 years) |
| EV Packaging Driving Module Integration | +1.8% | Europe, China | Medium term (2-4 years) |
| SUV Mix Driving Curtain-Airbag Demand | +1.7% | North America, spillover in Europe | Short term (≤ 2 years) |
| Chinese OEM Push for Euro NCAP Airbags | +1.5% | Global, with primary impact in China and export markets | Medium term (2-4 years) |
| Insurance-Linked Incentives for Fleet Upgrades | +1.2% | North America and Europe | Medium term (2-4 years) |
| Source: Mordor Intelligence | |||
Stringent Frontal and Side-Impact Safety Mandates in Emerging Economies
Rapid regulatory rollouts have amplified unit volumes for the automotive airbags market. India’s rule requiring dual front airbags on all passenger vehicles from January 2025 alone adds nearly 10 million annual units. Brazil’s comparable mandate pushed national airbag penetration close to full coverage. These rules dovetail with consumer awareness campaigns and favorable insurance terms, accelerating factory install rates. Suppliers are ramping localized production to meet lead-time targets while maintaining global quality standards, ensuring cost parity for price-sensitive segments.
EV-Platform Packaging Needs Driving Multi-Module Integration
Battery placement and flat-floor cabins in EVs reshape crash dynamics, compelling designers to adopt specialized airbags. Autoliv’s Bernoulli Airbag™ accommodates wide cabin geometries and reduces inflator heat by 30%. Center airbags like Hyundai Mobis’ 2025 unit prevent driver-passenger contact in side impacts. These bespoke modules increase average airbags per EV, widening the automotive airbags market opportunity while pushing R&D toward lighter gas generators that minimize thermal stress around high-voltage packs.
Rising SUV Mix Spurring Demand for Side-Curtain Airbags in North America
SUVs account for more than 70% of U.S. light-vehicle sales, elevating rollover risk. Side-curtain airbags, which remain inflated during roll events, have become a persuasive feature in dealership showrooms. The Insurance Institute for Highway Safety notes a 37% reduction in driver deaths when head-protection curtains are present [1]. Automakers are broadening coverage to third-row seats and integrating far-side units that protect against occupant-to-occupant injury. The result is a deepening penetration of curtain modules within the automotive airbags market.
Mandatory Dual-Airbag Rules in India and Similar Developing Markets
Regulators in India, Southeast Asia, and South America see dual airbags as the minimum viable safety standard. These low-cost compliance upgrades yield outsized life-saving benefits, as U.S. Department of Transportation data show frontal airbags cut driver fatalities by 29% [2]. Domestic assemblers in India, for instance, have re-engineered dashboards to house passenger bags without sacrificing cabin space. With local OEMs targeting cost-conscious consumers, this mandate delivers consistent volume gains for Tier-1 suppliers.
Restraints Impact Analysis of Automotive Airbags Market*
| Restraint | (~) % Impact on CAGR Forecast | Geographic Relevance | Impact Timeline |
|---|---|---|---|
| Semiconductor and Inflator Propellant Shortages | -1.8% | North America, Europe | Short term (≤ 2 years) |
| Rising Zero-Defect R&D Costs Squeezing Tier-2 Margins | -1.2% | Global, with concentrated impact on smaller suppliers | Medium term (2-4 years) |
| Counterfeit Aftermarket Airbags | -0.9% | Asia, Africa, Latin America | Medium term (2-4 years) |
| EV Lightweighting Driving Alternative Restraint Exploration | -0.7% | Global, with early effects in the premium EV segment | Long term (≥ 4 years) |
| Source: Mordor Intelligence | |||
Semiconductor Shortages Disrupting Output
Airbag ECUs rely on 32-bit microcontrollers, and allocation shortfalls cut 2024 global vehicle output by 2.3 million units. Suppliers reported order backlogs stretching 28 weeks, prompting automakers to favor high-margin models. Component costs climbed 12-15% against 2023 benchmarks, squeezing Tier-2 margins. Strategic buffering and foundry-level agreements are stabilizing supply, yet the situation continues to cap near-term expansion for the automotive airbags market.
Counterfeit Aftermarket Airbags Erode Consumer Confidence
NHTSA estimates 250,000 counterfeit bags entered North American vehicles in 2024, with more than 80% failing safety tests. Illicit units, often sold online, undercut legitimate offerings and jeopardize occupants. OEMs and suppliers now embed QR codes and RFID tags for verification, but this raises unit costs by USD 3–5. Persistent policing and consumer education remain critical to safeguard the aftermarket’s credibility and, by extension, sustained growth of the automotive airbags market. [3]
*Our forecasts treat driver/restraint impacts as directional, not additive. The impact forecasts reflect baseline growth, mix effects, and variable interactions.
Automotive Airbags Market Segment Analysis
By Vehicle Type:
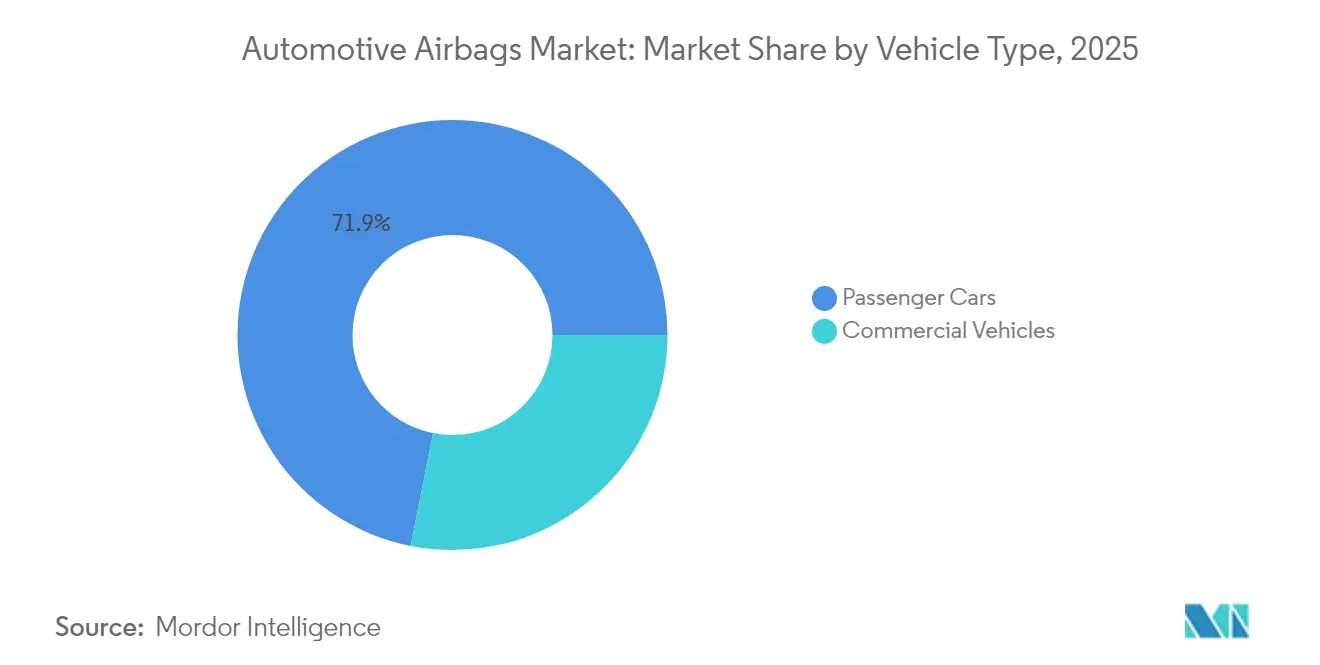
Passenger Cars Anchor Volume, Commercial Vehicles AcceleratePassenger cars accounted for 71.88% of the automotive airbags market in 2025, buoyed by larger build counts and rising airbags per car. Commercial vehicles, however, are pacing faster with an 8.12% CAGR through 2031, as Europe’s General Safety Regulation mandates advanced restraint systems for new heavy-duty models starting in 2025. Fleet managers value the documented 42% reduction in injury-related downtime delivered by full airbag suites, a payoff that offsets upfront costs. The automotive airbags market size for commercial vehicles is projected to climb steadily, leveraging telematics-driven insurance discounts that reward safety-equipped trucks.
Surging e-commerce has intensified long-haul freight activity, calling for better driver protection in congested corridors. North American fleets are specifying side-curtain and knee airbags in Class 8 tractors, elevating average airbag content from two units in 2020 to five units in 2025. With regulators eyeing further occupant-safety enhancements, commercial platforms present a robust incremental opportunity for the automotive airbags market.

By Propulsion Type:
BEVs Redefine Integration ComplexityICE vehicles still dominate volume with an 86.65% share in 2025, yet BEVs exhibit the fastest growth in the automotive airbags market with a 14.85% CAGR through 2031. Battery packs curb traditional crumple zones, prompting the adoption of external pre-crash airbags and lower-temperature inflators. Autoliv’s low-heat gas generator addresses fire-safety constraints near high-voltage systems, widening design flexibility. The automotive airbags market size for BEVs is set to compound as global electric-vehicle sales exceed 17 million units in 2024, each requiring supplementary restraint modules.
Hybrid and plug-in hybrid models are growing at a 8.85% CAGR, driving demand for dual-mode deployment algorithms that accommodate both combustion and electric components. Suppliers integrate machine-learning logic into ECUs, parsing 400 data points per second to adjust inflation force. Such complexity lifts ECU revenue share and consolidates the automotive airbags market around players with software-heavy portfolios.
By Component:
Sensors and ECUs Outpace ModulesAirbag modules commanded 52.10% of automotive airbag market revenue in 2025, yet sensors and ECUs are the fastest-growing segment, advancing at a 11.95% CAGR through 2031. Vehicles now host 6-12 accelerometers, pressure sensors, and gyroscopes feeding central processors that make release decisions within 30 milliseconds. Bosch’s 2025 AI-enabled ECU improves deployment accuracy by 10%, cutting false-trigger rates and helping automakers meet zero-defect goals. Advanced logic also underpins occupant-adaptive bags that modulate inflation to body size and seating position, a differentiator inside the automotive airbags market.
Inflators, growing at 7.55% CAGR, are trending toward cleaner propellants that trim carbon footprints. Development efforts center on replacing sodium azide with gas-generant mixes that produce fewer particulates without compromising open-time consistency.
By Material:
Polyester Surges on Sustainability EdgeNylon 66 held a 65.95% share of the automotive airbags market in 2025, driven by its superior tensile strength and heat resistance properties. Supply volatility and higher input costs, however, spur OEMs to trial polyester fabrics, which are 15-20% less expensive and nearly performance-parity. Autoliv’s 100% recycled-polyester cushion, launched in 2025, halves greenhouse-gas emissions relative to virgin polyester. SK Chemicals’ closed-loop recycling converts spent airbags to BHET monomer, showcasing circularity that may become regulatory necessity under the EU End-of-Life Vehicle Directive. Polyester’s 13.05% CAGR signals a gradual re-balancing of material shares within the automotive airbags market.
By Position:
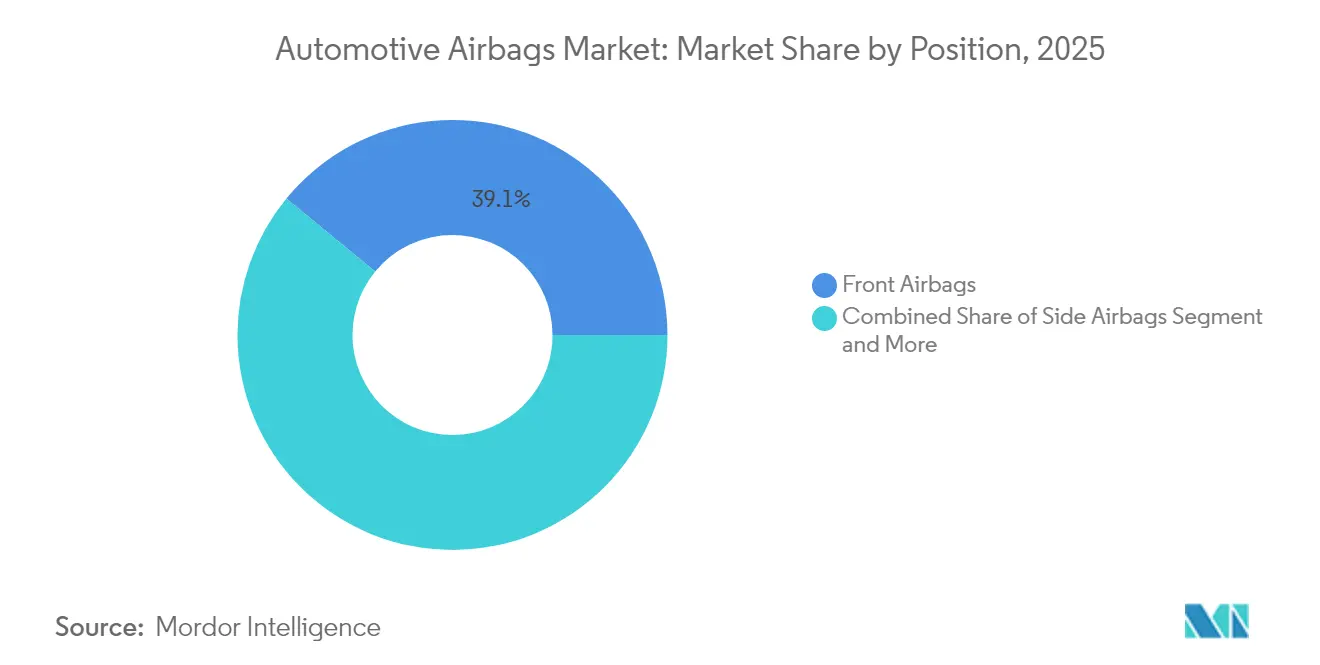
Curtain Airbags Extend Three-Row CoverageFront airbags remain ubiquitous, representing 39.05% of units in 2025. Curtain airbags are registering the fastest growth, with a 13.85% CAGR, as they help mitigate rollover fatalities, particularly in high-center-of-gravity vehicles like SUVs and vans. Third-row curtains debuted in premium SUVs such as the 2025 Kia EV9, expanding protection to family haulers. Knee airbags clock an 8.65% CAGR and are now standard in several volume models across the Middle East, nurturing wider consumer expectations for leg-injury mitigation. External airbags, though nascent, exemplify frontier innovation, pre-tensing bumper zones to absorb side-impact energy before it reaches occupants—a development likely to broaden the automotive airbags market share for advanced positions.
By Sales Channel:
Aftermarket Gains Relevance Through RetrofitOEM fitments accounted for 90.75% of the automotive airbags market size in 2025. Retrofit demand, however, is driving the aftermarket segment to grow at a 13.45% CAGR through 2031. Insurance carriers in North America and Europe offer 5–15% premium breaks for vehicles upgraded with additional airbags, driving workshops to stock certified kits. Authentication technologies fight counterfeit infiltration, preserving trust and unlocking repeat business. Emerging economies adopt similar incentives as regulators observe safety outcomes, ensuring the aftermarket remains a sturdy complement to new-vehicle installations within the automotive airbags market.
Geography Analysis
APAC Automotive Airbags Market
Asia-Pacific controlled 42.10% of the automotive airbags market in 2025, anchored by China’s production of over 220 million airbag units and India’s dual-airbag mandate. Average airbag count per vehicle in China rose from 2.3 in 2020 to 4.8 in 2025, underpinned by domestic brands chasing Euro NCAP compliance for export models. Japan and South Korea contribute engineering depth and manufacturing scale, supplying modules to global OEM platforms. Regional suppliers such as Joyson leverage proximity to major assemblers, shortening lead times and deepening integration in next-generation EV programs.
GCC Automotive Airbags Market
The Middle East is the fastest-growing sub-region, projected to grow at a 14.90% CAGR through 2031. Gulf Cooperation Council countries tighten safety regulations and favor large SUVs, boosting airbags per vehicle beyond global averages. Local assembly ventures in Saudi Arabia and the United Arab Emirates lure Tier-1s to establish inflator and cushion facilities, positioning the region as an export hub into Africa and parts of Europe. The 2025 Nissan Patrol, fitted with seven airbags including knee units, exemplifies rising consumer expectations.
North America and Europe Automotive Airbags Market
North America and Europe collectively make up nearly half of global revenue. North American growth rides on SUV popularity and stringent FMVSS side-impact updates, while Europe’s General Safety Regulation layers new obligations for far-side and pedestrian airbags starting 2026. Both regions spearhead AI-enabled ECUs and greener propellants, innovations that later cascade to emerging markets, reinforcing global homogeneity in safety standards across the automotive airbags market.
Regulatory Landscape
The regulatory environment for automotive airbags is tightening around both crash protection and electrified powertrain integrity. In the United States, the National Highway Traffic Safety Administration (NHTSA) issued a final decision in April 2026 banning the importation and sale of DTN60DB-marked frontal driver air bag inflators manufactured by Jilin Province Detiannuo Safety Technology Co., Ltd., reinforcing scrutiny of replacement inflators and illicit supply routes. In June 2026, NHTSA also finalized amendments updating references and removing obsolete provisions across FMVSS No. 214 (side impact) and related requirements in FMVSS No. 305a and No. 307, continuing the alignment of crash compliance with electric powertrain safety needs.
Internationally, UNECE-type approval remains a key driver of global occupant-protection design through updates to UN Regulations No. 94 (frontal impact) and No. 95 (lateral impact), which entered into force in 2025 and are shaping 2026 homologation programs for multiple OEM platforms. In China, GB 20072-2024 for passenger car rear-impact safety becomes mandatory for new vehicle types from July 1, 2026, with provisions relevant to electric and hybrid-electric vehicles. That change pushes suppliers to validate airbags, sensing, and restraint strategies alongside battery and high-voltage system protection requirements.
Value Chain Analysis
The automotive airbags value chain stretches from upstream petrochemicals and yarns for nylon and polyester, coated fabrics, and propellants and pyrotechnics for inflators, to precision metal parts and electronics such as crash sensors, microcontrollers, and ECUs. These components then feed into Tier-1 module assembly, including cut-and-sew cushions, inflator integration, folding, and end-of-line testing, before distribution to OEM assembly plants and certified aftermarket channels. Quality assurance and traceability run across the chain, and tighter authentication needs in replacement parts add steps for labeling and verification, while electronics availability, particularly microcontrollers used in airbag ECUs, remains a key gating input.
Supply-chain strategies are increasingly regional and partnership-led to secure capacity, shorten lead times, and synchronize design changes with EV platforms. In December 2025, Kolon Industries announced a 70 billion won investment to build a new airbag fabric facility in Ho Chi Minh City, Vietnam, intended to supply Autoliv and strengthen fabric availability for global module programs (with operations targeted for 2028). In July 2026, Autoliv (Shanghai) Management Co., Ltd., signed a strategic cooperation framework agreement with XPENG covering technology development and supply chain coordination, highlighting how Tier-1s are tightening product development, sourcing, and execution with fast-cycle EV OEMs.
Competitive Landscape
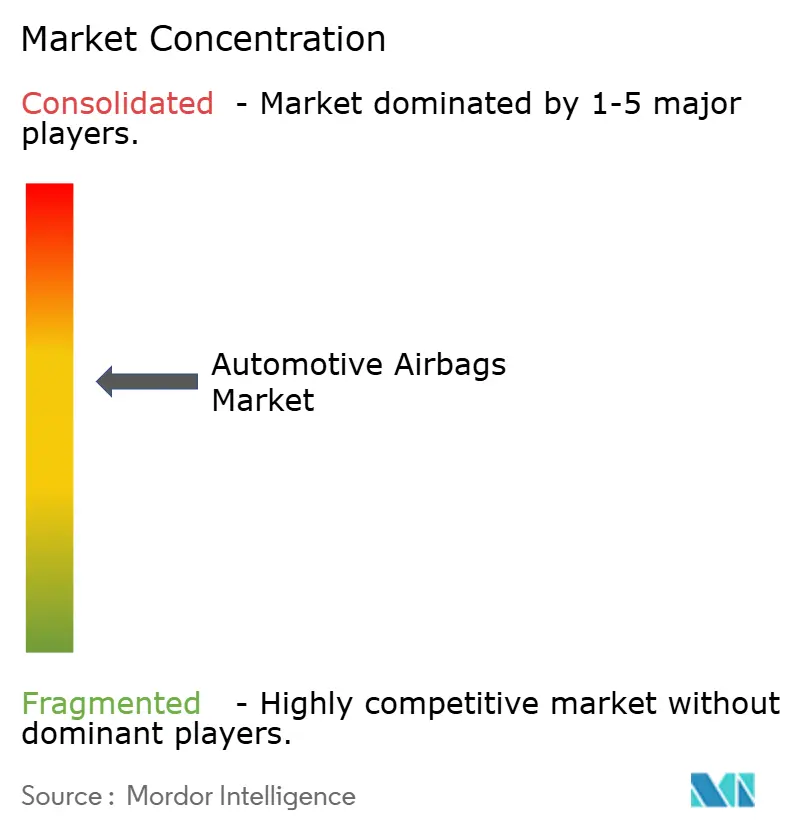
The automotive airbags market is moderately concentrated. Autoliv leads the segment, supported by 66 plants worldwide and an innovation pipeline that introduced the Bernoulli Airbag Module in 2025. ZF Friedrichshafen follows, leveraging its system-level expertise post-TRW integration to offer combined sensor-to-actuator packages. Joyson Safety Systems rounds out the top trio, focusing on value-oriented solutions for mass-market models and maintaining strong positions with Chinese OEMs.
Consolidation persists as suppliers seek scale to absorb soaring R&D costs tied to zero-defect quality targets. Chinese players such as Jinzhou Jinheng advance aggressively, using domestic demand to refine manufacturing and win export contracts. Partnerships between airbag manufacturers and semiconductor firms are common: Bosch collaborates with Autoliv on AI-infused control units, while Continental secures microcontroller supply through long-term agreements with Taiwan-based foundries. These alliances underscore the strategic importance of chip security and software prowess in sustaining leadership within the automotive airbags market.
Sustainability is another competitive axis. Autoliv’s recycled-polyester cushion and ZF’s Active Heel Airbag reveal a turn toward resource-light products that also address new injury patterns, such as foot trauma in front-seat occupants. Suppliers that demonstrate both environmental stewardship and advanced occupant-protection capabilities are winning extended sourcing contracts as OEMs align procurement metrics with ESG targets.
Automotive Airbags Industry Leaders
-
ZF Friedrichshafen AG
-
Autoliv Inc.
-
Toyoda Gosei Co. Ltd
-
Joyson Safety Systems
-
Hyundai Mobis Co. Ltd
- *Disclaimer: Major Players sorted in no particular order
Automotive Airbags Market Companies Covered in this Report
- Autoliv Inc.
- ZF Friedrichshafen AG (ZF TRW)
- Joyson Safety Systems
- Toyoda Gosei Co. Ltd
- Hyundai Mobis Co. Ltd
- Continental AG
- Daicel Corporation
- Nihon Plast Co. Ltd
- Ashimori Industry Co. Ltd
- Sumitomo Corporation (Airbag Fabric)
- Robert Bosch GmbH
- Kolon Industries Inc.
- Yanfeng Automotive Trim Systems Co. Ltd
- Jinzhou Jinheng Automotive Safety System Co. Ltd
- Denso Corporation
Market Opportunities and Future Outlook
A key opportunity area is capacity and automation upgrades in Asia, where suppliers are expanding localized production to reduce logistics risk and improve responsiveness for OEM platforms adding more airbag positions and advanced inflator types. Autoliv brought Phase II of its Jiading, China facility into operation in January 2026, adding automation such as a high-bay storage system to support faster fulfillment and tighter inventory control. ZF LIFETEC launched a EUR 150 million capacity expansion project at its Xi'an, China inflator base in March 2026, centered on SHI2/SHI3 hybrid inflator production lines, which increases available inflator output for higher-content restraint packages.
Regulatory and compliance cycles also create near-term work in sensing and integration, particularly as electrification raises new validation demands. NHTSA finalized updates in June 2026 that amend and streamline references around FMVSS No. 214 and related requirements in FMVSS No. 305a and No. 307, and the August 2024 final rule updating FMVSS No. 208 child restraint system references has a mandatory phase-in concluding on September 1, 2026. Alongside UNECE supplements to UN Regulations No. 94 and No. 95 entering into force in 2025, these milestones support engineering and testing activity for airbag modules and associated deployment logic within OEM programs and certified replacement channels.
Recent Industry Developments in Automotive Airbags Market
- July 2026: Autoliv signed a Global Strategic Cooperation Framework Agreement with Great Wall Motor to deepen their long-term partnership around global operations and product strategies. The move supports coordinated development and sourcing for restraint systems as Chinese OEMs scale exports and broaden model lineups, improving program visibility for airbag module and inflator supply.
- February 2025: ZF LIFETEC introduced the Active Heel Airbag, which inflates beneath the floor carpet to reduce foot and lower-leg injuries without taking cabin space. This product direction expands addressable airbag positions and enables OEMs to add protection content while preserving interior packaging flexibility.
- December 2024: Nissan debuted the all-new Patrol with a seven-airbag configuration including knee airbags for the Middle East. Higher standard-fit airbag counts on high-volume SUV nameplates raise baseline content per vehicle and reinforce supplier demand for multi-position airbag suites in SUV-heavy markets.
Automotive Airbags Market Report Scope and Research Methodology
Market Definition and Coverage
This market covers the value of automotive airbag systems sold for on-road vehicles, including factory fitment and replacement demand, across passenger cars and commercial vehicles. Revenue is counted at the component and module level as supplied into OEM and aftermarket channels.
Scope exclusions: Seatbelts, standalone airbag fabrics sold separately, and two-wheeler airbags are excluded from this market sizing.
Segments Covered in This Report
- By Vehicle Type
- Passenger Cars
- Commercial Vehicles
- By Propulsion Type
- Internal Combustion Engine Vehicles (ICE)
- Battery Electric Vehicles (BEV)
- Hybrid & Plug-in Hybrid Vehicles (HEV/PHEV)
- Fuel-Cell Electric Vehicles (FCEV)
- By Component
- Airbag Module
- Inflator
- Crash Sensor & ECU
- Airbag Fabric
- By Material
- Nylon 66
- Nylon 6
- Polyester
- By Position/Airbag Type
- Front Airbags
- Side Airbags
- Curtain Airbags
- Knee Airbags
- Inflatable Seat-Belts
- By Sales Channel
- Original Equipment Manufacturer (OEM)
- Aftermarket/Replacement
- By Geography
- North America
- United States
- Canada
- Rest of North America
- South America
- Brazil
- Argentina
- Rest of South America
- Europe
- Germany
- United Kingdom
- France
- Spain
- Italy
- Rest of Europe
- Asia-Pacific
- China
- Japan
- India
- South Korea
- Rest of Asia-Pacific
- Middle East and Africa
- Saudi Arabia
- United Arab Emirates
- Turkey
- South Africa
- Egypt
- Rest of Middle East and Africa
- North America
Data Sources, Market Sizing, and Validation
Desk Research
Desk work starts by mapping the demand pool, which is the vehicle parc and new vehicle production that can carry airbags, and then linking it to regulatory and safety adoption signals. We refer to public road safety and transport sources such as NHTSA defect and recall databases, Euro NCAP test protocols, UNECE vehicle safety regulations, and national transport statistics agencies, because these sources show when airbags are mandated or pushed into standard fitment.
To convert that demand pool into market value, we combine published vehicle production series (such as OICA totals) with trade and shipment indicators (where relevant, using customs statistics), and we pull in company public materials like annual reports, investor decks, and product catalogs to infer system content and platform penetration. A paid subscription for company financials and a shipment-level import and export database were used selectively to cross-check revenue exposure and identify unusual spikes by country. The sources listed here are illustrative, and many other public documents and datasets were also reviewed for data collection, validation, and research clarification.
Primary Interviews and Surveys
Primary calls and surveys were used to confirm how airbag content per vehicle is changing by segment and propulsion type, and to validate price movement for modules and key subcomponents that show faster change. We spoke with people across the value chain, including component suppliers, vehicle program teams, distributors, and repair and service participants, to close gaps left by public data and then sanity-check the final totals across regions.
Distribution of primary research fieldwork respondents
| Company type | Respondent position | Region |
|---|---|---|
| Top tier: 27% | CXOs: 18% | APAC: 41% |
| Mid tier: 53% | Functional/Unit leaders: 27% | EMEA: 35% |
| Smaller Players: 20% | Managers: 55% | Americas: 24% |
Market-Sizing & Forecasting
The core sizing logic is built from a top-down demand reconstruction, where vehicle production and sales by region are converted into installed airbag units by applying airbag fitment rates and average airbags per vehicle for each vehicle class and propulsion type. Once that demand stack is created, we price it using average selling prices that differ by airbag position and by sales channel (OEM versus replacement), then roll the result into a single market value.
To keep the model realistic, we corroborate the totals with selective bottom-up checks such as supplier revenue exposure to airbags, sampled bill-of-material splits for modules, and channel checks on replacement mix. Where public series are patchy for a country, we close the gap using proxy indicators like vehicle output trends, safety regulation timing, and the local mix of passenger and commercial vehicles, followed by a second pass during interviews. Inputs that materially shape results include airbags per vehicle (front, side, curtain, knee, and newer center units), OEM take rates by vehicle class, replacement rates linked to parc size and accident intensity, the mix shift toward higher-content vehicles, and price movement tied to material and electronics content.
Forecasts are produced using scenario analysis, since near-term swings are often driven by vehicle production cycles and regulation-led adoption that do not move in a smooth line. For each region, we forecast the key drivers first and then apply them into the market model, and we cross-check the implied growth with expert consensus on content-per-vehicle expansion and the normalization of supply constraints.
Data Validation & Update Cycle
Validation is done by checking the market totals against independent signals, such as vehicle production trends, safety rule changes that affect standard fitment, and the expected share of airbags in broader passive safety spending. If a region shows a jump that cannot be explained by these drivers, the assumptions are rechecked, and respondents are re-contacted to confirm whether the change is volume-led, mix-led, or price-led.
Before sign-off, the model goes through multi-step analyst review, where unit math, currency conversion timing, and regional roll-ups are verified, and outliers are challenged with a clear reason trail. Reports are refreshed annually, and interim updates are made when material events occur, such as major regulation changes, large recall waves impacting replacement, or sharp shifts in vehicle production. Right before delivery, a fresh scan is performed so the view reflects the latest available public releases and confirmed primary inputs.
Mordor Intelligence's Automotive Airbags Market Size Measured Against Other Published Estimates
Published market values for automotive airbags can vary a lot, even when the topic name looks the same, because groups often count different product baskets and use different ways to price content-per-vehicle. In our work, the biggest differences usually come from what is treated as an airbag sale, how replacement demand is handled, and how fast average selling prices are assumed to move.
Some published estimates also fold in adjacent restraint products or count subcomponents even when they are sold outside a complete airbag module, which can expand the headline number quickly. The table points to this scope spread, where some figures appear to include seatbelt-related restraint value, and then the narrower counting rule is applied by Mordor Intelligence, which counts sensors, ECUs, and inflators only when they ship as part of a complete airbag module and keeps seatbelts and standalone airbag fabrics out of the value total.
Benchmark comparison
| Source | Market Size | Gaps in Research Methodology |
|---|---|---|
| Mordor Intelligence | USD 27.98 B (2025) | |
| Global Consultancy A | USD 33.40 B (2025) | Uses a broader passive safety scope that appears to add seatbelt restraint value and may count standalone electronics and fabrics sold outside complete airbag modules, which inflates the priced content base. |
| Industry Association B | USD 24.90 B (2025) | Leans on production-linked unit assumptions with conservative airbags-per-vehicle progression and limited pricing uplift for newer airbag positions, which can understate mix-driven value growth. |
Taken together, the spread is largely explained by what is included in the product basket and how pricing and content-per-vehicle are updated year to year. Our approach keeps the market total traceable to vehicle output, fitment and content assumptions, and channel-specific pricing, which makes the result easier to reproduce and challenge with clear checks.
Key Questions Answered in the Report
What is the current value of the automotive airbags market and its expected growth?
The automotive airbags market is valued at USD 31.14 billion in 2026 and is projected to reach USD 53.13 billion by 2031, reflecting an 11.30% CAGR over 2026-2031.
Which vehicle type contributes most to automotive airbags demand?
Passenger cars account for 71.88% of the automotive airbags market, although commercial vehicles are gaining ground with an 8.12% CAGR through 2031.
Why are curtain airbags growing faster than other types?
The popularity of SUVs and stricter side-impact standards are elevating demand for curtain airbags, which are expanding at a 13.85% CAGR.
What materials are suppliers adopting for sustainability?
While nylon 66 still dominates with 65.95% share, recycled polyester fabrics are advancing at a 13.05% CAGR, cutting greenhouse-gas emissions by about 50%.