
Market Overview
| Study Period | 2019 - 2031 |
|---|---|
| Market Size (2026) | USD 5.43 Billion |
| Market Size (2031) | USD 7.44 Billion |
| Growth Rate (2026 - 2031) | 6.50 % |
| Fastest Growing Market | Asia-Pacific |
| Largest Market | Asia-Pacific |
| Market Concentration | Medium |
Major Players *Disclaimer: Major Players sorted in no particular order Image © Mordor Intelligence. Reuse requires attribution under CC BY 4.0. | |
Automotive Air Filter Market Analysis by Mordor Intelligence
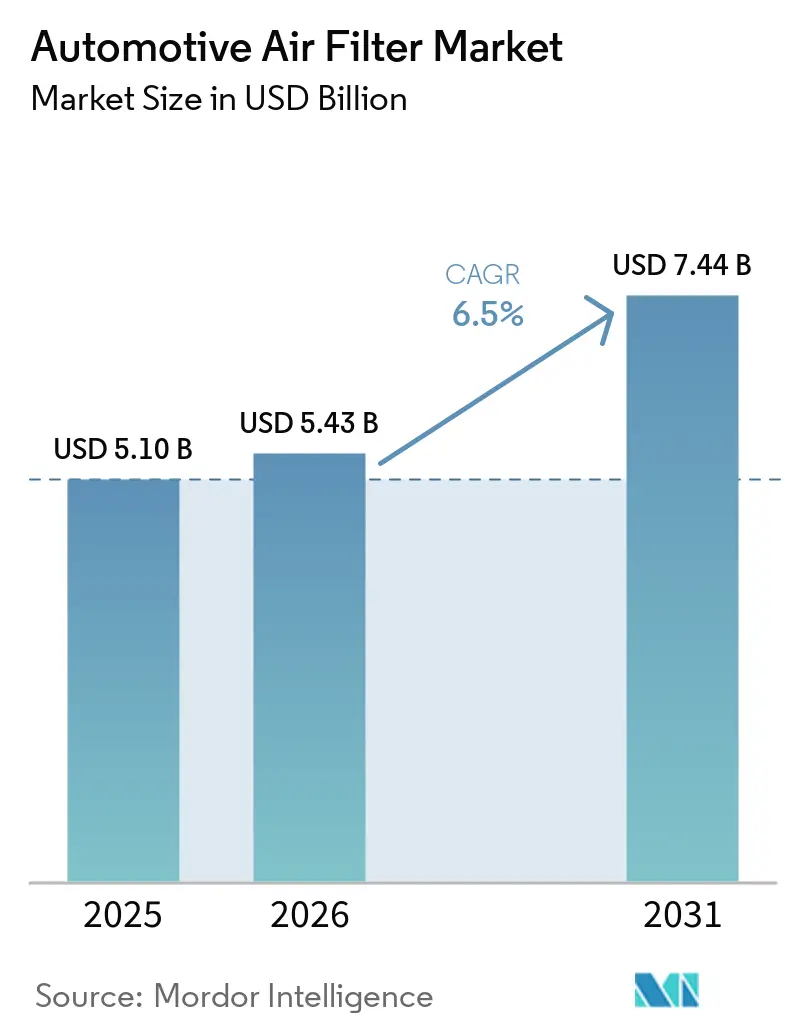
The automotive air filter market size was valued at USD 5.10 billion in 2025 and estimated to grow from USD 5.43 billion in 2026 to reach USD 7.44 billion by 2031, at a CAGR of 6.50% during the forecast period (2026-2031). Rising vehicle parc, stricter emission rules, and growing awareness of in-cabin air quality are the primary tailwinds propelling the automotive air filter market. In 2025, the Asia-Pacific region solidified its dominance in the global market, buoyed by China's impressive annual vehicle production. Concurrently, India's adoption of the Bharat Stage VI standards expanded the use of filters in two-wheelers. As the global light-vehicle parc grew and fleet ages rose in North America and Europe, aftermarket channels played a significant role in global turnover. The swift march towards electrification is altering product specifications: premium electric vehicle platforms from industry giants like Tesla, Mercedes-Benz, and BYD are now integrating HEPA-grade elements, capable of trapping fine particles. This shift is opening up fresh opportunities for suppliers of nano-fiber media. On another front, surging prices of polypropylene melt-blown materials have squeezed gross margins. In response, top filter manufacturers are channeling investments into upstream capacities to ensure a steady supply.
Key Report Takeaways
- By product type, air-intake filters led the automotive air filter market with 55.12% of the share in 2025, whereas cabin filters are projected to record the fastest 9.02% CAGR to 2031.
- By filter media, cellulose retained 44.25% revenue share in 2025, while nano-fiber and HEPA media are poised to expand at 10.86% CAGR.
- By vehicle type, passenger cars held 63.11% of the automotive air filter market size in 2025, while light commercial vehicles are set to grow at a 6.91% CAGR through 2031.
- By sales channel, the aftermarket retained 59.03% share of global revenue in 2025 and is expected to expand at a 7.12% CAGR to 2031.
- By geography, Asia-Pacific accounted for 39.12% of the automotive air filter market share in 2025 and is expected to post the quickest 7.55% regional CAGR through 2031.
Note: Market size and forecast figures in this report are generated using Mordor Intelligence’s proprietary estimation framework, updated with the latest available data and insights as of 2026.
Global Automotive Air Filter Market Trends and Insights
Drivers Impact Analysis*
| Driver | (~) % Impact on CAGR Forecast | Geographic Relevance | Impact Timeline |
|---|---|---|---|
| Global Vehicle Parc and Service-Interval | +1.4% | Global, notable in North America, Europe, ASEAN | Long term (≥ 4 years) |
| Emission and Air Quality Mandates | +1.3% | Global, strongest in the EU, China, and India | Medium term (2-4 years) |
| Health Awareness in Megacities | +0.9% | APAC core, spill-over to the Middle East & Africa | Short term (≤ 2 years) |
| HEPA-Grade Filters Adoption | +0.8% | North America, EU, tier-1 Chinese cities | Medium term (2-4 years) |
| Smart HVAC Filtration Modules | +0.5% | North America, the EU, and early gains in South Korea and Japan | Long term (≥ 4 years) |
| Predictive Fleet-Maintenance Algorithms | +0.4% | North America, the EU, and Brazil | Medium term (2-4 years) |
| Source: Mordor Intelligence | |||
Growing Global Vehicle Parc and Service-Interval Mileage
By 2025, the global light-vehicle parc reached a significant milestone. In OECD markets, average annual mileage stabilized, while in China, it showed higher levels. Turbo-diesel oil-change intervals extended further. However, air-filter replacements remained consistent due to engine-management alerts triggered by clogged elements. To address this, service providers began offering bundled "health kits" that combine air and cabin filters. This approach encourages motorists to replace both simultaneously, maintaining the replacement frequency even with the extended lubricant life.
Strict Emission and In-Cabin Air Quality Mandates
Euro 7, effective late 2026, caps particulate emissions at 4.5 mg/km for light-duty vehicles, pushing OEMs toward higher-efficiency air-intake elements to maintain catalyst temperatures[1]. China's draft CN7 standard tightens NOₓ limits and mandates onboard diagnostics for filter clogging, pushing a quicker shift to low-pressure-drop synthetic media. In India, Bharat Stage VI Phase 2 now includes three-wheelers and tractors, expanding the compliance base. Meanwhile, in Germany, cabin-filter sales surged in 2025, despite a drop in measured PM2.5 levels, underscoring a perception gap driving the demand for premium filter upgrades.
Consumer Health Awareness in High-Pollution Megacities
In 2025, Delhi recorded several days with PM2.5 levels exceeding safe limits, while Beijing's average levels were also concerning, heightening commuter concerns over respiratory health. In response, vehicle buyers increasingly demand HEPA-rated cabin filters; a survey conducted in 2025 across multiple countries revealed that many participants were willing to pay a premium for this added protection. Automakers have responded by incorporating cabin air-quality displays and sensor-driven filter alerts into their vehicles. These enhancements not only boost the average selling prices of replacement components but also expand revenue opportunities in the aftermarket sector.
HEPA-Grade Filters Adopted by EV and Premium OEM Platforms
In 2025, electric vehicles (EVs) gained significant traction in global light-vehicle sales. Luxury brands are leveraging high-efficiency filtration systems to enhance cabin comfort [2]. For instance, Tesla’s refreshed Model Y expanded its filter surface area threefold, achieving a high efficiency rate. Meanwhile, Mercedes-Benz's EQS integrated a HEPA cartridge with activated carbon, appealing to health-conscious consumers. BYD’s Seal adopted nano-fiber media, resulting in a notable reduction in VOC loads. The engine air filter market benefits from synthetic media’s ability to sustain airflow under higher contamination loads, making them attractive for turbocharged and direct-injection engines. Such strategic moves are creating a 'halo effect', pushing mainstream internal combustion engine (ICE) models to elevate their filter specifications in the coming years.
Restraints Impact Analysis*
| Restraint | (~) % Impact on CAGR Forecast | Geographic Relevance | Impact Timeline |
|---|---|---|---|
| Synthetic Media Extending Replacement | –0.6% | Global, most visible in North America and EU premium segments | Medium term (2-4 years) |
| Non-Woven and Activated-Carbon Prices | –0.3% | Global, acute in Asia-Pacific manufacturing hubs | Short term (≤ 2 years) |
| Sealed “Lifetime” Cabin-Filter Modules | –0.2% | EU and North America luxury EVs | Long term (≥ 4 years) |
| Energy-Weight Penalty in BEVs | –0.2% | Global BEV platforms, pronounced in China and EU | Medium term (2-4 years) |
| Source: Mordor Intelligence | |||
Long-Life Synthetic Media Extending Replacement Intervals
Electro-charged melt-blown and nano-fiber layers now last significantly longer. Due to this innovation, vehicles now require fewer filter purchases over a standard lifespan [3]. Although each premium filter element carries a heftier price, the surge in overall revenue has been muted. Traditionally, it's been the purchase frequency, not the price, that has fueled filter demand. Moreover, performance-centric washable products are dampening unit volumes, particularly among enthusiasts.
Volatile Non-Woven and Activated-Carbon Prices
In Q1 2025, polypropylene melt-blown prices experienced a significant increase year-on-year, driven by refinery outages that curtailed feedstock availability. This disruption not only elevated production costs but also squeezed supplier margins. Meanwhile, activated carbon prices rose, influenced by tighter outputs from Indonesia and China. While larger manufacturers managed to absorb much of the price shock, smaller private-label brands had to pass on these increases. This led to a decline in volumes in markets sensitive to price changes and reignited interest in upstream integration as a strategy to stabilize input costs.
*Our forecasts treat driver/restraint impacts as directional, not additive. The impact forecasts reflect baseline growth, mix effects, and variable interactions.
Segment Analysis
By Product Type: Cabin Filters Accelerate on Health-Driven Upgrades
Air-Intake Filters represented 55.12% of 2025 revenue, while cabin filters are projected to rise at 9.02% CAGR. The premiumization wave centers on nano-fiber media with an electrostatic charge that traps ultrafine particles without excessive pressure drop. In congested cities, ride-hailing fleets specify high-grade cabin filters as a service differentiator, making replacement sales less dependent on vehicle production cycles and more on health-oriented consumer behavior.
Turbocharged gasoline and diesel engines rely heavily on air-intake filters. Even a slight clog can reduce boost pressure and activate limp-home modes. However, as commoditization sets in, profit margins shrink. Conventional cellulose filters offer minimal profitability. While hybrid cellulose-carbon filters address odor issues in high-mileage fleets, the electrically enhanced ePM1 media remains priced above what the mainstream market will accept. Consequently, the automotive air filter market is turning to cabin components for revenue growth, a trend expected to continue through 2031.


By Filter Media: Nano-Fiber Captures Share as Cellulose Margins Thin
Cellulose retained 44.25% of overall revenue in 2025 thanks to low cost and legacy OEM approvals, yet rising humidity-related degradation and stricter efficiency targets weigh on the outlook. Synthetic melt-blown media, currently a significant share of demand, offer extended life and better durability, making them the default for commercial diesel platforms operating in tropical climates. Activated-carbon composites held a notable share, driven by rising VOC concerns in India and China.
Nano-fiber and HEPA-grade layers will post the fastest growth at 10.86% CAGR through 2031. OEMs favor these materials for premium EVs because they achieve H13 performance without the airflow penalty of thicker cellulose mats. Suppliers respond by scaling electro-spinning lines and experimenting with bio-based polymers to hedge against polypropylene volatility. Hybrid constructions that blend 30% nano-fiber into cellulose show promise for mid-tier vehicles, offering near-HEPA efficiency at moderate cost. This pivot supports steady penetration into the automotive air filter market size, especially where regulators spotlight interior air quality.
By Vehicle Type: LCV Momentum Mirrors Last-Mile Logistics
Passenger cars generated 63.11% of 2025 filter revenue, but light commercial vehicles (LCVs) are the fastest-growing slice, set for a 6.91% CAGR to 2031. E-commerce growth doubles annual mileage for delivery vans, driving filter changes every 10,000-12,000 km and boosting unit sales per vehicle versus private sedans. Medium and heavy trucks gain from stricter Euro VI-E and EPA 2027 rules that raise filtration standards to protect costly after-treatment devices.
Fleet telematics hastens replacements by monitoring pressure drop and airborne dust load, a shift that stabilizes demand irrespective of driver vigilance. In contrast, passenger-car owners may stretch intervals in search of savings, forcing aftermarket retailers to educate consumers on fuel-economy penalties of clogged filters. The resulting segmentation underscores why the automotive air filter market continues to derive volume from established car fleets while realizing margin growth from hard-working LCVs.

By Sales Channel: Aftermarket Retains Primacy Despite OEM Connectivity
Aftermarket outlets accounted for 59.03% of revenue in 2025 and are forecast to grow at 7.12% CAGR as the majority of the global fleet sits outside warranty coverage. Independent quick-service garages package oil, air, and cabin filters into value bundles that undercut dealership prices by a third, sustaining loyalty among cost-conscious motorists. Online marketplaces extend reach to do-it-yourself customers who order OEM-equivalent parts for home installation.
OEMs leverage telematics to pull maintenance back in-house, pushing filter alerts through proprietary apps that steer owners to authorized centers. Right-to-repair legislation in California now obliges OEMs to share sensor data, enabling independent shops to compete on equal information footing. The push-and-pull preserves aftermarket dominance while nudging suppliers to integrate digital diagnostics that keep them visible within the connected-car ecosystem. These adjustments ensure the automotive air filter market continues to balance captive OEM sales with a vibrant replacement economy.
Geography Analysis
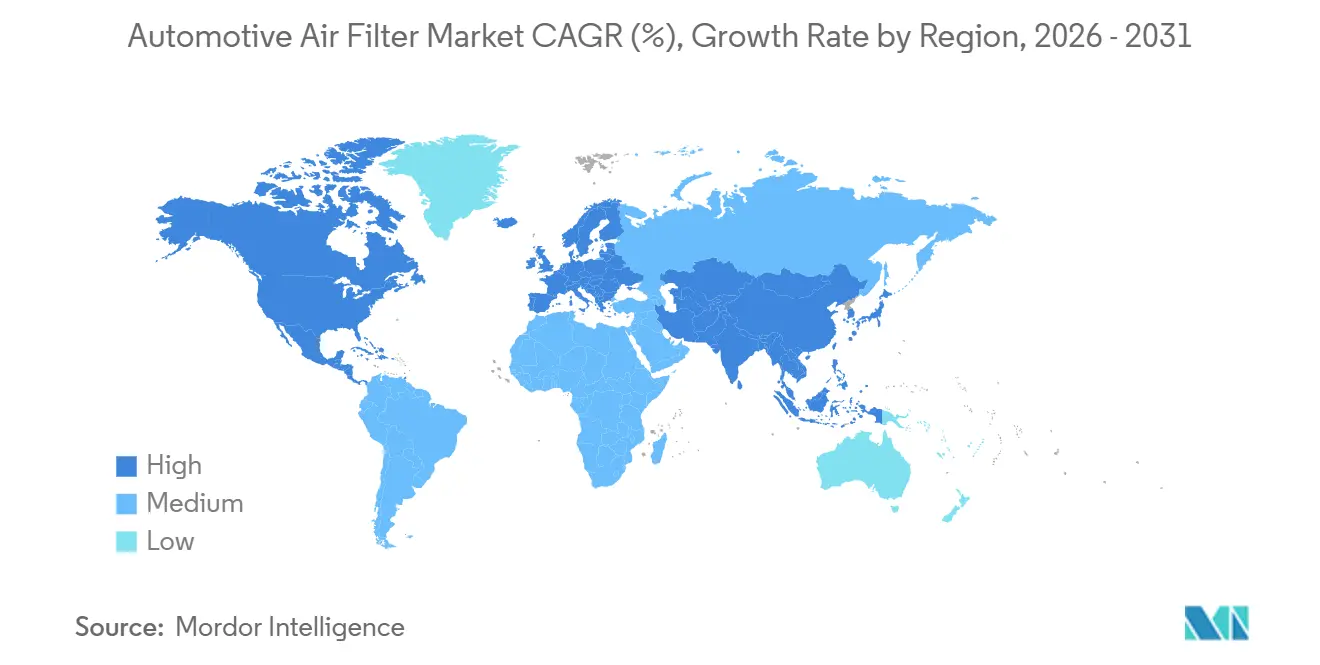
Asia-Pacific led with 39.12% of global revenue in 2025 and will expand at 7.55% CAGR to 2031. China’s 469-million-unit parc and India’s mass vehicle adoption underpin baseline demand, while Japan and South Korea elevate unit value through sensor-equipped cabin filters. Australia logged a bushfire-linked surge in HEPA retrofits during 2025, though volumes are expected to normalize.
In 2025, Europe was a significant contributor to the total revenue. While Euro 7 has set new performance benchmarks for intake filters, the adoption of HEPA filters in cabins remains predominantly with premium brands. In the United Kingdom and France, as new vehicle registrations plateau, the aging vehicle fleet continues to bolster aftermarket sales. Following sanctions, Russia has shifted its sourcing focus towards Chinese suppliers. North America also played a key role in the overall revenue. The United States, with its extensive vehicle fleet, drives significant aftermarket activity. However, this growth is moderated by extended OEM service intervals and an increasing preference for washable media. In Canada, similar trends are observed, but the country's harsher winters lead to more frequent changes of intake filters.
South America saw Brazil's Proconve L8 diesel regulation, which mandates two-stage intake filtration for heavy vehicles, play a pivotal role. While Argentina's economic challenges have dampened new vehicle sales, the country's aging fleet ensures consistent replacement cycles. The Middle East and Africa face unique challenges and opportunities. In the Gulf, dust conditions necessitate more frequent filter changes, while Turkey's adoption of the Euro 6d standard expands the market landscape. Despite a dip in vehicle sales, South Africa's established vehicle parc presents robust aftermarket prospects. Collectively, these regional dynamics highlight the diverse and resilient nature of the automotive air filter market.
Value/Supply-Chain Analysis
The value chain begins with raw materials and specialty inputs (cellulose and synthetic nonwovens, resins, gaskets and plastics, adhesives, and performance additives such as activated carbon and antimicrobial or nano-fiber layers). Tier-1 filtration suppliers such as MANN+HUMMEL, MAHLE, Bosch, DENSO, Donaldson, and UFI Filters convert these inputs into filter media and finished modules through media formation and coating, pleating, molding, and assembly, then complete validation and vehicle-platform approvals. OEM programs generally follow just-in-time delivery and rely on regional footprints close to vehicle plants, while the aftermarket uses a multi-echelon model (central and regional warehouses, wholesalers, installers, retail, and e-commerce) to maintain high SKU availability and faster replenishment.
Key pinch points are availability and price volatility for high-performance media, particularly activated carbon composites and advanced layers (nano-fiber, HEPA-grade, antimicrobial). Import reliance and cross-border logistics can disrupt lead times, so suppliers increasingly pursue local-for-local production, dual sourcing, and more vertical integration into media science and proprietary coatings. In parallel, the aftermarket leans on digital cataloging and data-driven replenishment to keep fill rates high across a diverse vehicle parc. Across both channels, technology choices that extend service intervals (long-life synthetic media and sealed modules on select platforms) shift value capture toward OEM fitment content and premium SKUs, rather than relying only on higher replacement frequency.
Competitive Landscape
In 2025, the top suppliers—MANN+HUMMEL, MAHLE, Donaldson, Bosch, and Sogefi—commanded a significant portion of the revenue, indicating a moderate market concentration. MANN+HUMMEL is set to expand its Pune facility with a significant investment, aiming for an annual capacity by 2027, a move that positions the company favorably for premium OEM contracts.
Meanwhile, Bosch made a substantial investment in a melt-blown line in Tennessee, a step aimed at countering the volatility of polypropylene. Sogefi, on the other hand, secured its activated-carbon supply through a long-term deal with an Italian producer. As specialized equipment becomes more accessible, the scale advantages in the market are diminishing. This shift has allowed regional challengers, like Guangzhou Yizheng in China, to undercut established players while adhering to the ISO 11155-1 performance standard.
Tier-1s aligned with OEMs accept thinner margins in exchange for volume certainty, whereas aftermarket specialists chase higher gross returns from enthusiast and fleet segments. Proprietary filter-housing designs, exemplified by Cummins’ radial-seal architecture, fortify replacement capture on heavy-duty engines. Emerging niches include filtration for battery thermal-management loops and biodegradable media that address circular-economy goals. Strategic agility will dictate who captures the next tranche of value in the automotive air filter market.
Automotive Air Filter Industry Leaders
-
MANN+HUMMEL GmbH
-
Freudenberg & Co. KG
-
MAHLE GmbH
-
Robert Bosch GmbH
-
DENSO Corporation
- *Disclaimer: Major Players sorted in no particular order

Market Opportunities and Future Outlook
A clear whitespace is taking shape around higher-performance cabin filtration that combines particle capture with durability across the full maintenance interval, supported by OEM demand for real-world validated performance. Freudenberg Filtration Technologies has brought micronAir neo to OEM programs with a heterogeneous fiber structure aimed at long-term stability, aligning with automakers tightening in-cabin air quality specifications on both ICE and EV platforms. At the same time, the aftermarket is creating room for sustainability-led differentiation in media and packaging, illustrated by MANN-FILTER expanding lignin-based air and oil filter media offerings to broaden coverage across the European independent aftermarket.
Capacity and localization investments in major vehicle-production hubs also create a more actionable pathway for filter suppliers to win platform nominations and reduce lead times. MANN+HUMMEL inaugurated a Global Technology and Innovation Center in Tumkur, Karnataka (May 2026), highlighting continued product and process development closer to high-growth OEM ecosystems. Standards such as ISO 5011:2025 provide a more uniform basis for inlet air cleaner performance testing and reporting, which helps global suppliers support comparable performance claims across regions and channels. An adjacent opportunity is building service and monitoring layers (predictive maintenance, telematics-linked filter-life algorithms, and sensor-activated HVAC modules), where recurring value can be sustained even when long-life media lowers physical replacement frequency.
Recent Industry Developments
- May 2026: MANN+HUMMEL expanded the MANN-FILTER aftermarket portfolio with additional lignin-based air and oil filter media, building on its earlier CO2-reduced filter introduction. The addition scales renewable-material content into high-volume replacement applications and broadens coverage for the European independent automotive aftermarket.
- March 2026: Freudenberg Filtration Technologies launched micronAir neo, a next-generation cabin air filter developed for automotive OEM fitment with a heterogeneous fiber structure designed for long-term stability. The product focus on validated, real-world filtration efficiency supports automaker requirements for consistent in-cabin performance over longer service intervals.
- February 2025: Apollo Fund X invested fresh capital in Tenneco's Clean Air division to support growth and strengthen its operational capabilities. The funding backs product development and program execution capacity in emissions and air-management content that is adjacent to advanced filtration needs across ICE and electrified platforms.
Research Methodology Framework and Report Scope
Market Definition and Coverage
This market covers the value of air filtration products used in road vehicles to protect the engine intake path and improve in-cabin air quality, counted across OEM fitment and aftermarket replacement sales in USD.
Scope exclusions: This sizing excludes industrial HVAC filtration, marine and rail filters, and standalone purification devices that are not installed as vehicle air filters.
Segmentation Overview
- By Product Type
- Air-Intake Filters
- Cabin Air Filters
- Hybrid / Electrostatic Nano-fiber Filters
- Electrically-enhanced (ePM1) Filters
- By Filter Media
- Cellulose
- Synthetic/Melt-blown
- Activated-Carbon Composite
- Nano-fiber/HEPA Grade
- By Vehicle Type
- Passenger Cars
- Light Commercial Vehicles
- Medium and Heavy Commercial Vehicles
- By Sales Channel
- OEM Fitment
- Aftermarket
- By Geography
- North America
- United States
- Canada
- Rest of North America
- South America
- Brazil
- Argentina
- Rest of South America
- Europe
- Germany
- United Kingdom
- France
- Italy
- Spain
- Russia
- Rest of Europe
- Asia-Pacific
- China
- Japan
- India
- South Korea
- Australia and New Zealand
- Rest of Asia-Pacific
- Middle East and Africa
- United Arab Emirates
- Saudi Arabia
- Turkey
- South Africa
- Rest of Middle East and Africa
- North America
Data Sources, Market Sizing, and Validation
Desk Research
Desk research starts by building a clean demand and supply picture, before any math is finalized. We rely on public statistics such as vehicle production and registrations from sources like OICA, national transport agencies, and customs trade tables from sources such as UN Comtrade, which help frame unit flows by region.
To keep assumptions realistic, we also review emissions and in-cabin air quality related rules from agencies such as the US EPA and the European Commission, plus technical papers from SAE International and other peer-reviewed journals for filter media performance and change intervals. Company filings, investor presentations, association websites, and reputable press are used to cross-check pricing direction, channel mix, and announced capacity moves. Where needed, paid subscriptions for company financials and intelligence, news and financials, patent databases, and shipment-level trade data are used to fill gaps that public sources do not cover. These examples are indicative, and many other sources were also referred to for data collection, validation, and clarification.
Primary Interviews and Surveys
Primary work is used to pressure-test assumptions that can swing the model, especially replacement frequency, price dispersion by filter media, and the split between OEM supply and aftermarket demand. We speak with a mix of component suppliers, distributors, retailers, and participants in the vehicle service ecosystem, and we make sure views are captured across APAC, EMEA, and the Americas so regional pollution levels and driving patterns are reflected in the final build.
Distribution of primary research fieldwork respondents
| Company type | Respondent position | Region |
|---|---|---|
| Top tier: 38% | CXOs: 13% | APAC: 44% |
| Mid tier: 45% | Functional/Unit leaders: 34% | EMEA: 36% |
| Smaller Players: 17% | Managers: 53% | Americas: 20% |
Market-Sizing & Forecasting
Sizing is built using a top-down and bottom-up approach, where the main backbone is a demand pool reconstructed from vehicle production, in-use parc, and typical service replacement cycles for engine intake and cabin filters. That demand pool is then translated into value using region-appropriate average selling prices that account for filter media mix and channel structure.
To keep the totals grounded, selective bottom-up checks are run using supplier revenue splits, sampled price points across common SKUs, and channel checks on aftermarket turnover, and then the totals are adjusted when the two views do not line up. Inputs that are treated as key levers include passenger and commercial vehicle parc growth, average annual mileage, dust and air quality exposure that shifts cabin filter adoption, OEM build rates, and replacement interval patterns that vary by region and vehicle age. When data is missing for a smaller country or a niche vehicle subcategory, we use proxy ratios from similar markets and then validate them through expert feedback before locking the assumption.
For forecasting, scenario analysis is used so near-term swings in vehicle production and longer-term shifts in filter media pricing can be separated. The scenario paths are anchored to expert expectations on vehicle output, aftermarket resilience during slower new vehicle sales, and the pace at which premium cabin filtration penetrates mass-market models.
Data Validation & Update Cycle
Results are triangulated across independent signals such as vehicle parc totals, production and trade direction, and the implied per-vehicle filter consumption, and then checked for outliers at the regional and channel level. If an assumption drives an unusual jump in value, the driver is traced back, reworked, and, when needed, the relevant experts are contacted again to confirm what changed.
Before sign-off, the model and narrative go through multi-step analyst reviews so units, currency conversions, and timing align with the stated base year and forecast period. Reports are refreshed annually, and interim updates are made when material events occur, such as major regulatory shifts or sharp changes in vehicle output. Right before delivery, a final pass is completed so clients receive the latest updated view.
Mordor Intelligence's Automotive Air Filter Market Size Compared With Other Published Estimates
Published market sizes for automotive air filters do not always match because firms draw the boundary differently and then apply different price and replacement assumptions. Year selection also matters, since some studies report a historic base year while others lead with a forecast-year value.
By tracking OEM build rates, in-use vehicle parc, and service interval logic, Mordor Intelligence keeps the sizing tied to filters that are actually consumed each year, rather than folding adjacent filtration categories into the total. Differences also come from how ASPs are handled, since some sources apply a single global price, while our model separates OEM versus aftermarket pricing and adjusts for filter media mix and currency timing.
Benchmark comparison
| Source | Market Size | Gaps in Research Methodology |
|---|---|---|
| Mordor Intelligence | USD 5.43 B (2026) | |
| Global Consultancy A | USD 4.86 B (2024) | Uses an earlier base year and can understate replacement-led demand if the in-use parc and change intervals are not updated to current driving and air quality conditions. |
| Industry Publisher B | USD 6.50 B (2025) | Reports a higher total that can result from broader scope choices or a more aggressive pricing build that does not clearly separate OEM pricing from aftermarket price dispersion by region. |
Seen together, the spread is mainly explained by base year choice and how demand and pricing are converted into value. Using a demand pool built from parc, production, and replacement behavior, and then validating it with supplier and channel checks, produces a number that can be traced back to clear variables and repeated each refresh cycle.
Key Questions Answered in the Report
How large is the automotive air filter market in 2026?
The automotive air filter market size stands at USD 5.43 billion in 2026 and is on course to reach USD 7.44 billion by 2031.
Which product type grows fastest toward 2031?
Cabin air filters lead growth with a 9.02% CAGR, driven by health-oriented upgrades in polluted urban areas.
Why does Asia-Pacific dominate global revenue?
Asia-Pacific holds 39.12% of revenue thanks to China’s vast vehicle parc and India’s recent emission-rule expansion that adds millions of filter-eligible two-wheelers.
How are electric vehicles changing filter specifications?
Premium EVs specify HEPA-grade or nano-fiber media to market cleaner cabins, pushing suppliers toward high-efficiency, low-pressure-drop designs.