
Automatic Weapons Market Size and Share
Market Overview
| Study Period | 2020 - 2031 |
|---|---|
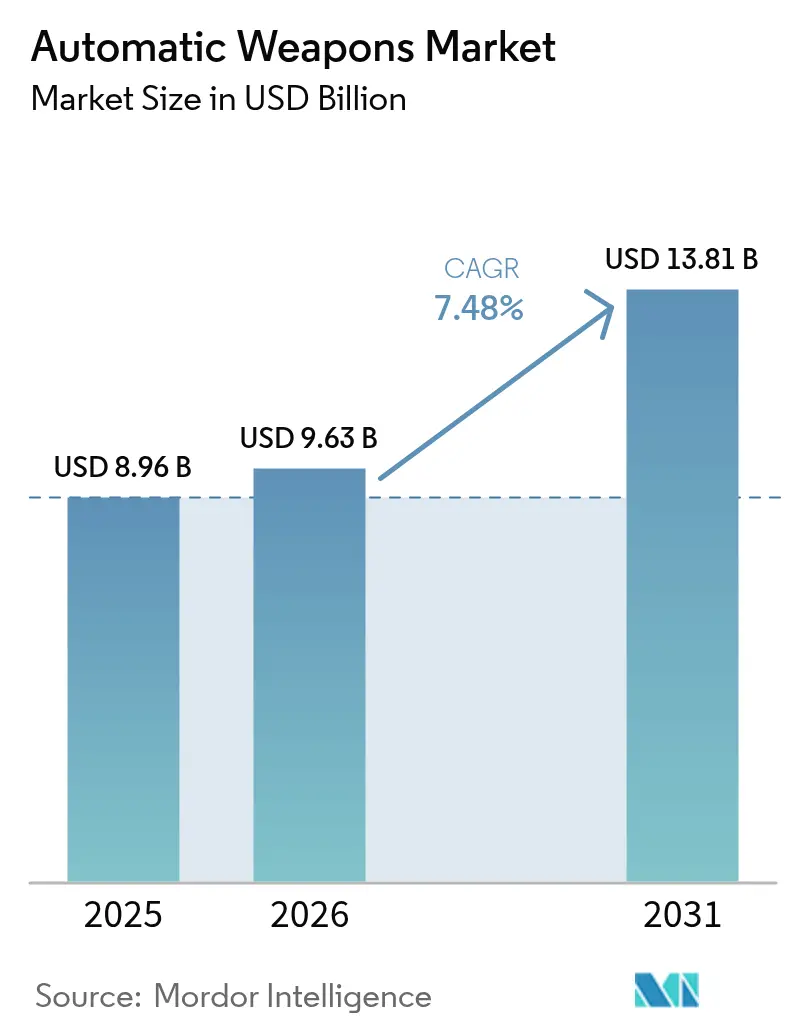
| Market Size (2026) | USD 9.63 Billion |
| Market Size (2031) | USD 13.81 Billion |
| Growth Rate (2026 - 2031) | 7.48 % |
| Fastest Growing Market | Asia Pacific |
| Largest Market | North America |
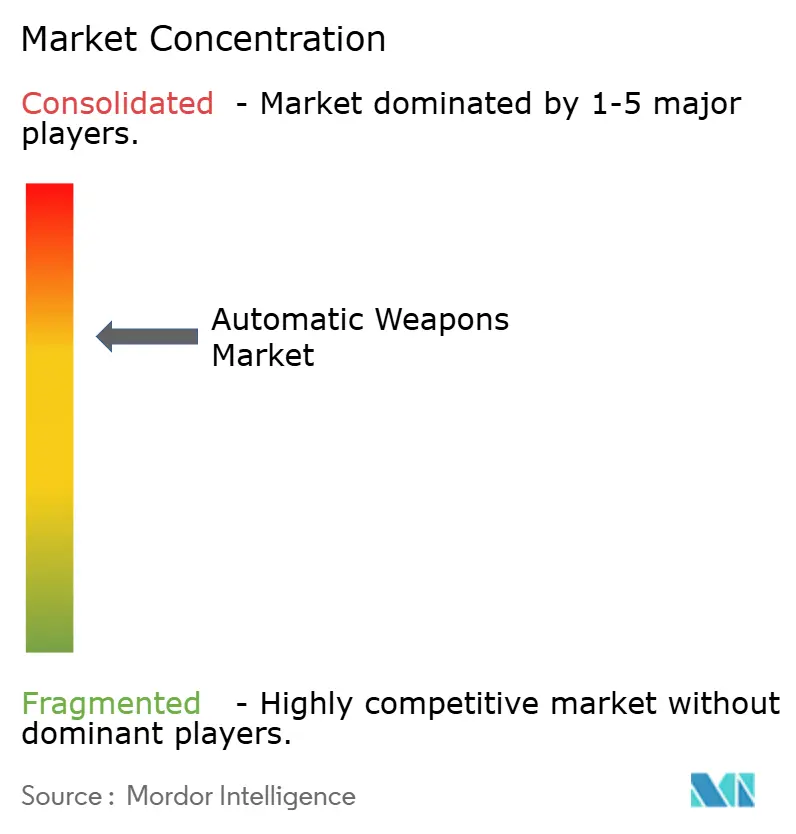
| Market Concentration | Medium |
Major Players *Disclaimer: Major Players sorted in no particular order Image © Mordor Intelligence. Reuse requires attribution under CC BY 4.0. | |
Automatic Weapons Market Analysis by Mordor Intelligence
The automatic weapons market size is expected to grow from USD 8.96 billion in 2025 to USD 9.63 billion in 2026 and is forecast to reach USD 13.81 billion by 2031 at 7.48% CAGR over 2026-2031. Heightened defense spending, persistent geopolitical flashpoints, and the urgency to retire aging Cold War inventories underpin demand for digitally networked, AI-ready small-caliber and medium-caliber systems. Military planners are opting for weapons that plug into broader sensor grids, enabling faster target recognition and data exchange. Procurement is further stimulated by modular designs that allow quick caliber swaps, by the spread of remote weapon stations on land vehicles and patrol craft, and by nationwide initiatives to harden forces against drone swarms. Supply-chain risk around rare-earth magnets, barrel steel, and specialized propellants poses near-term headwinds yet also prompts domestic sourcing initiatives in the United States, Europe, and Asia-Pacific.
Key Report Takeaways
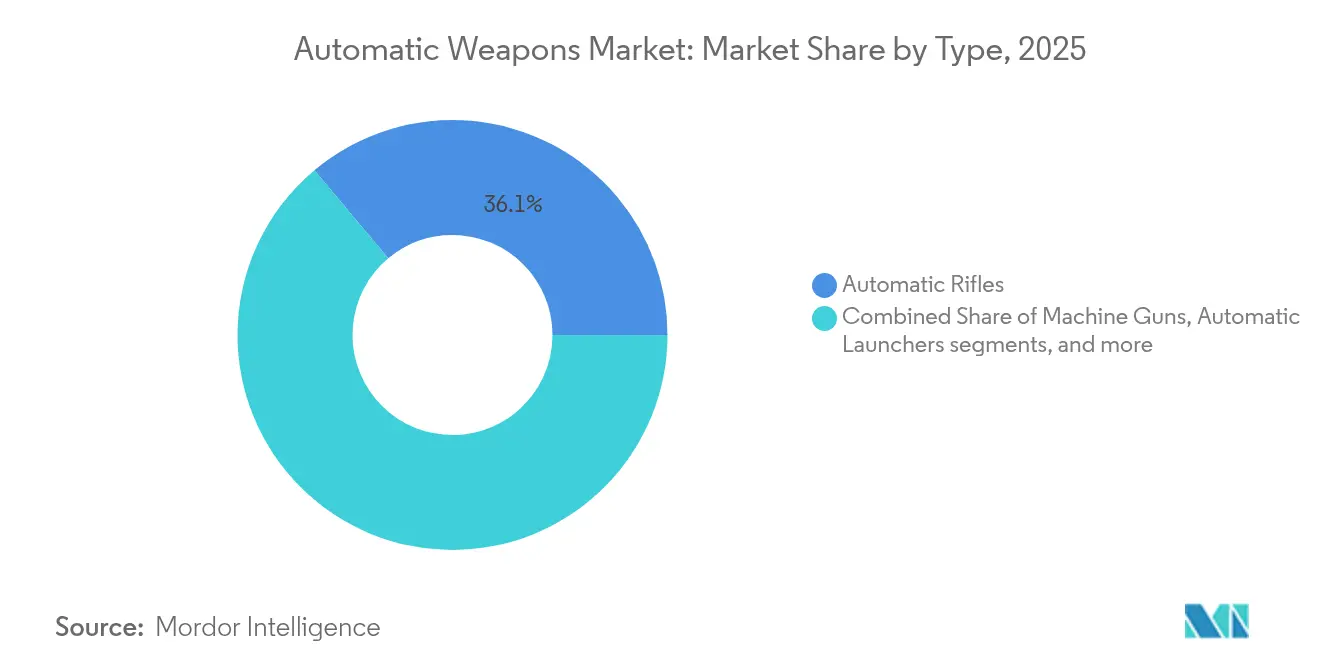
- By type, automatic rifles led the automatic weapons market share at 36.10% in 2025, while automatic cannons are expanding at an 8.32% CAGR to 2031.
- By platform, land platforms held 58.55% of the automatic weapons market in 2025; naval platforms exhibit the fastest 9.05% CAGR through 2031.
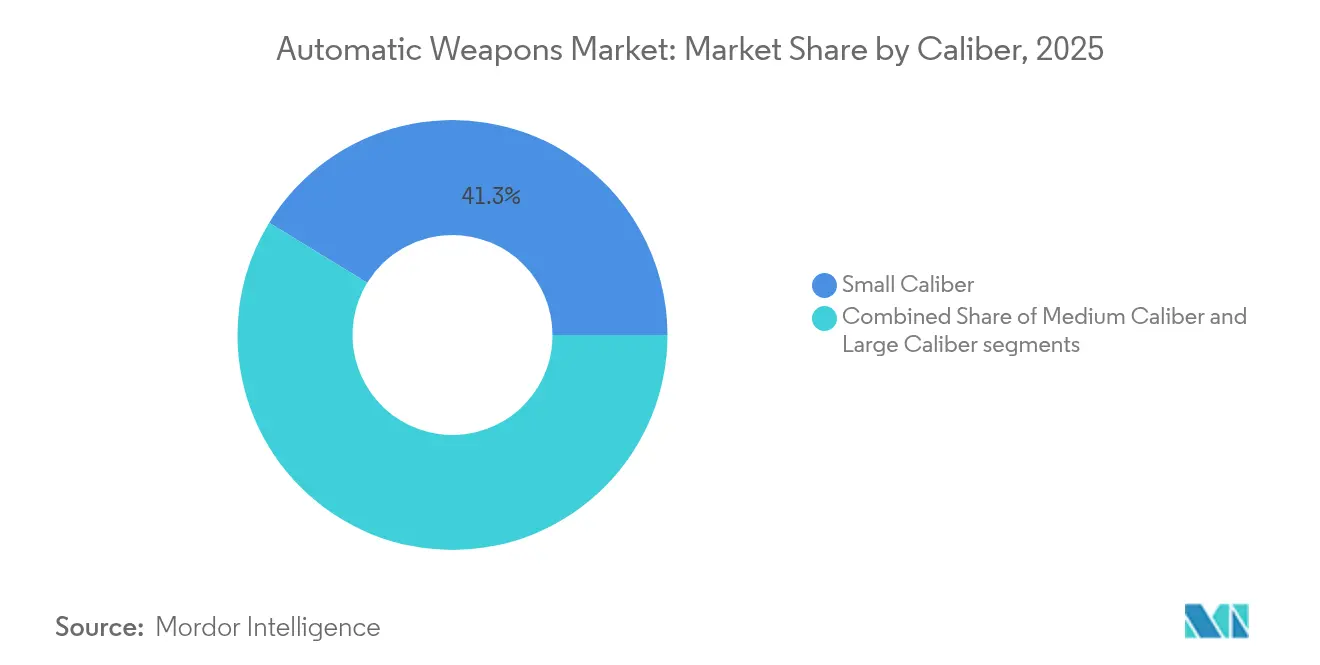
- By caliber, small caliber systems accounted for 41.25% share of the automatic weapons market size in 2025, whereas large caliber weapons are growing at an 8.11% CAGR to 2031.
- By end-user, the defense segment commanded 78.80% of 2025 revenue, while special operations forces recorded a 9.62% CAGR to 2031.
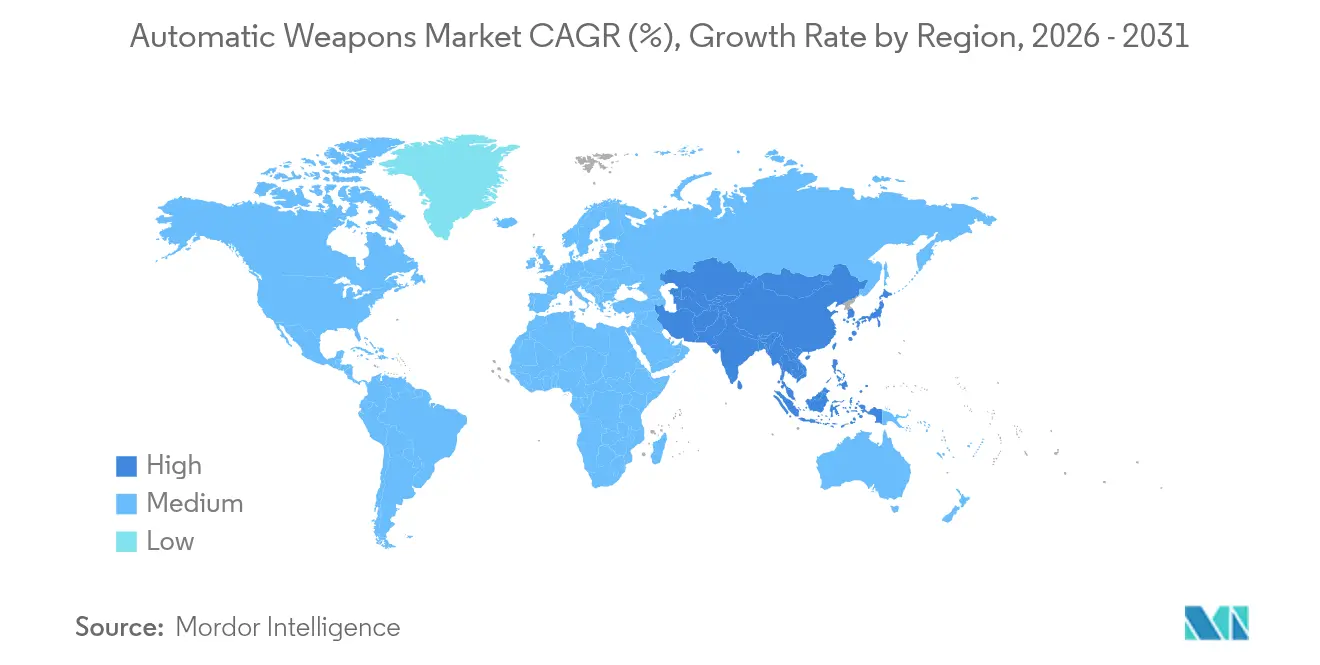
- By geography, North America retained a 38.20% share in 2025, yet Asia-Pacific registered the quickest 8.74% CAGR due to mounting regional modernization.
Note: Market size and forecast figures in this report are generated using Mordor Intelligence’s proprietary estimation framework, updated with the latest available data and insights as of 2026.
Market Trends and Insights
Drivers Impact Analysis of Automatic Weapons Market*
| Driver | (~) % Impact on CAGR Forecast | Geographic Relevance | Impact Timeline |
|---|---|---|---|
| Escalating geopolitical tensions and multi-domain doctrine | +2.1% | Global (focus on Eastern Europe, Indo-Pacific) | Medium term (2-4 years) |
| Replacement of legacy small-arms with modular platforms | +1.8% | North America and EU, expanding to APAC | Long term (≥ 4 years) |
| Asymmetric warfare demand for lightweight, high-mobility weapons | +1.4% | Global, early adoption in conflict zones | Short term (≤ 2 years) |
| Integration of AI-enabled fire-control electronics | +1.6% | North America, EU, advanced APAC markets | Medium term (2-4 years) |
| Proliferation of unmanned and remotely-operated weapon stations | +1.3% | Global, emphasis on naval and land vehicles | Medium term (2-4 years) |
| Shift to polymer-cased and caseless ammunition | +1.1% | North America, EU; gradual adoption in APAC | Long term (≥ 4 years) |
| Source: Mordor Intelligence | |||
Escalating Geopolitical Tensions and Multi-Domain Operations Doctrine
Multi-domain doctrine obliges armies to field automatic weapons able to exchange targeting data across land, sea, and air networks in near real time. Ukraine’s Sky Sentinel turrets, which employed .50-caliber M2 Browning guns to down six Shahed drones, illustrate the new fusion of legacy firepower with AI sensors. Allied forces, noting similar threats, are integrating smart optics such as the USD 13 million SMASH 2000L scopes that auto-track drones, now fielded by the US Army. Procurement officers now prioritize connectivity protocols and low-latency data links when drafting requirements. In parallel, fleet commanders retrofit remote weapon stations on patrol craft to guard chokepoints against low-cost loitering munitions. Collectively, these measures move the automatic weapons market from stand-alone small arms toward networked effectors embedded in command-and-control webs.
Ongoing Replacement Cycle of Legacy Small-Arms Inventories
NATO members are fast-tracking replacements for aging M16- and AK-family rifles. Sweden rushed a USD 64 million order for 15,000 Colt M4s to bolster reserves amid regional tension. The US Army allotted USD 367.3 million in FY 2025 for Next Generation Squad Weapons that pair 6.8 mm rounds with advanced optics, marking the biggest US small-arms shift in six decades. Singapore chose Colt’s IAR6940E-SG to replace the four-decade-old Ultimax 100, showing even tech-savvy nations sometimes import rather than develop locally. Beyond rifles, Israel Weapon Industries (IWI) rolled out the Arbel computerized system, hitting 90% of moving targets during trials, demonstrating how digital fire-control is redefining accuracy benchmarks.
Rise in Asymmetric Warfare Requirements
Urban combat and counter-insurgency prompt demand for low-weight weapons with precision aids. US Marines trialed the ZeroMark system: a motorized buttstock that corrects aim with machine vision and LiDAR, cutting engagement time against drones. Ukrainian units fielded armed ground robots bearing rifles and grenade launchers to clear trenches while limiting soldier exposure. SOCOM’s push for sub-24-pound .338 Norma machine guns that reach 2,000 m further shows that mobility now outweighs sheer rate of fire. Such requirements channel R&D toward polymer ammunition, suppressors, and lightweight alloys, stimulating diverse entrants and intensifying competition.
Advanced Fire-Control Electronics and AI Integration
Firearms are transitioning from mechanical devices to sensor-rich edge nodes. China’s prototype coil gun, powered by lithium-ion batteries and firing at 3,000 rpm, hints at future electromagnetic weapons. India unveiled the Ten AI Weapon System, a 7.62 mm medium machine gun that auto-tracks targets via onboard AI, during Aero India 2025. Kalashnikov demonstrated a station that autonomously identifies and engages threats, merging traditional gunmaking with AI analytics. These advances cut operator workload, shorten sensor-to-shooter loops, and create demand for software update pipelines similar to those in the aerospace domain.
Restraints Impact Analysis of Automatic Weapons Market*
| Restraint | (~) % Impact on CAGR Forecast | Geographic Relevance | Impact Timeline |
|---|---|---|---|
| High integration cost of advanced electro-optical sensors and digital fire-control units | -1.2% | Global, acute in cost-sensitive markets | Short term (≤ 2 years) |
| Supply-chain volatility for barrel-steel alloys, rare-earth magnets, and energetic chemicals | -0.9% | Global, severe impact on Western manufacturers | Medium term (2-4 years) |
| Stringent international arms-transfer rules and complex end-user certificate requirements | -0.8% | Global, particularly cross-border transactions | Long term (≥ 4 years) |
| Duplicate integration-cost pressure on procurement cycles | -0.7% | Emerging markets and budget-limited militaries | Medium term (2-4 years) |
| Source: Mordor Intelligence | |||
High Integration Costs of Advanced Sensor Systems
Next-generation optics elevate unit prices far above legacy equivalents. The SMASH 2000L, now standard on some US rifles, demands significant training and lifecycle support, straining the budgets of smaller militaries. Early lots of NGSW weapons cost nearly USD 9,000 each, four times the cost of legacy carbines. Manufacturers seek weight savings to offset price hikes; Sig Sauer’s Pitbull remote station dropped from 500 lb to 205 lb, making it feasible for light vehicles. Still, defense ministries with tight budgets defer upgrades, moderating near-term adoption rates.
Supply-Chain Volatility for Critical Materials
China processes over 90% of global rare-earths, and its 2024 export curbs on gallium and germanium disrupted Western missile and optics lines. The US strategic stockpiles have fallen from USD 42 billion in the 1950s to USD 888 million, limiting surge capacity. Bottlenecks in machine tools slow artillery and small-caliber barrel output, a reality highlighted during replenishment for Ukraine aid shipments. Governments fund domestic processing and alloy plants, but timelines stretch several years, inserting cost and schedule risk into major procurement programs.
*Our forecasts treat driver/restraint impacts as directional, not additive. The impact forecasts reflect baseline growth, mix effects, and variable interactions.
Automatic Weapons Market Segment Analysis
By Type:
Automatic Cannons Drive InnovationAutomatic rifles held the largest share at 36.10% in 2025, underscoring their role as the infantry’s backbone. The automatic weapons market size for rifles is projected to grow steadily as armies standardize on modular, suppressor-ready designs. Automatic cannons post the fastest 8.32% CAGR thanks to naval and air-defense applications that demand higher-energy projectiles to defeat drones and light armor.
Growth in cannons is propelled by 30 mm turrets ordered for US Marine ACVs and by European programs adding 35 mm systems with air-burst ammunition. Machine guns enjoy replacement demand but less dramatic growth, while Automatic Launchers gain relevance for counter-UAS tasks in urban environments. Gatling designs, niche yet indispensable for close-in weapon systems, receive electronics upgrades to link with ship radar feeds, ensuring continued production runs through 2030.

By Platform:
Naval Acceleration Outpaces Land DominanceLand systems commanded 58.55% of 2025 revenue, reflecting armored vehicle retrofits and dismounted modernization. Yet naval installations will clock a 9.05% CAGR, outpacing the broader automatic weapons market as fleets install remote stations that can lock onto fast, low-flying threats. The automatic weapons market share for land systems is secure, but growth moderates as inventories mature.
Crucially, maritime uptake is widening beyond blue-water navies; Taiwan’s patrol frigates will mount 20 mm XTR-102A2 systems to deter incursions in the Taiwan Strait. Airborne mounts concentrate on rotary platforms where door guns remain essential for convoy escort and medical evacuation. Uncrewed surface and ground vehicles open additional hulls and chassis for small, stabilized turrets, expanding the addressable platform base.
By Caliber:
Large Caliber Systems Gain MomentumSmall caliber systems dominated at 41.25% in 2025, reflecting broad infantry deployment. Polymer-cased rounds that are 37% lighter than brass versions unlock further efficiency. However, large-caliber weapons show an 8.11% CAGR as forces seek longer reach and improved armor penetration. The automatic weapons market size for large-caliber cannon is expected to widen when 50–60 mm programmable ammunition enters serial production.
Medium caliber remains relevant on armored vehicles and naval mounts, especially where 30 mm and 35 mm compromise weight and effect. Technology spill-overs, such as air-burst fuzing, make each round more effective, encouraging adoption without linearly scaling ammunition demand. Logistics planners now evaluate unit lethality per kilogram rather than raw rate of fire, a metric favoring advanced calibers with smart munitions.
By End-User:
Special Operations Drive InnovationDefense ministries held 78.80% of 2025 spending, yet Special Operations Forces will record a 9.62% CAGR through 2031. The automatic weapons market continues to treat SOF as early adopters, fielding lightweight .338 Norma machine guns that bridge the gap between 7.62 mm and .50 cal heavy guns.
Though smaller in volume, law-enforcement agencies acquire suppressor-ready carbines and compact remote stations for critical‐infrastructure protection. Dual-use designs that comply with military and police standards shorten development cycles and stabilize production lines. Over time, SOF feedback on ergonomics, recoil mitigation, and sensor integration migrates into general-purpose infantry weapons, lifting the baseline capability across regular forces.
Geography Analysis
North America Automatic Weapons Market
North America commanded 38.20% of global revenue in 2025, anchored by the United States, which accounts for nearly 40% of worldwide arms exports. Ongoing multi-year contracts for NGSW rifles and remote turrets sustain domestic output, while Canada’s NATO commitments and Mexico’s internal security procurements add incremental volume. Regional suppliers benefit from short feedback loops with end-users, allowing rapid spiral upgrades and fostering iterative product development that keeps the automatic weapons market competitive.
APAC Automatic Weapons Market
Asia-Pacific posts the fastest 8.74% CAGR, driven by China’s USD 314 billion defense budget and rising outlays by India, Japan, and South Korea. Japan lifted defense spending 21% to USD 55.3 billion, emphasizing long-range fires and hardened base defense. India, the world’s top arms importer, promotes local build partnerships that include small arms lines with technology transfer clauses. Taiwan’s incremental 1.8% budget hike channels funds into naval remote stations and counter-drone rifles, underscoring the region’s seaborne threat focus. Collectively, modernization across diverse operational doctrines creates varied specifications, broadening sales opportunities for global suppliers.
Europe and Israel Automatic Weapons Market
Europe is accelerating procurement after Russia’s 2022 invasion of Ukraine, with regional imports rising 47% between 2019 and 2024. EU initiatives to boost joint ammunition production complement bilateral deals such as Lithuania’s USD 36 million Minimi machine-gun purchase. Israel’s record USD 14.7 billion defense exports in 2024, a large portion to Europe, highlight the region’s tilt toward proven off-the-shelf solutions. Simultaneously, European states channel funds into domestic plants to reduce external dependency, stimulating R&D in smart munitions and AI-assisted fire-control tailored for NATO interoperability.
Regulatory Landscape
Regulation of automatic weapons is shaped by export-control regimes, end-use verification, and, in several jurisdictions, more specific transfer-authorization requirements. In the European Union, Regulation (EU) 2025/41 tightened the framework for import, export, and transit measures for firearms, essential components, and ammunition, reinforcing authorization and traceability expectations that affect intra-EU and extra-EU movements of small arms and related components.
In the United States, the Directorate of Defense Trade Controls (DDTC) signaled an administrative compliance shift through a proposed rule published in June 2026 to amend ITAR Part 130. The proposal includes raising the reporting threshold for certain defense sales to USD 1,000,000 and adjusting reporting burden mechanics, with public comments due by August 14, 2026. Alongside national rules, global transparency mechanisms such as the United Nations Register of Conventional Arms (UNROCA) continue to request annual reporting on small arms and light weapons transfers, reinforcing documentation discipline across cross-border transactions.
Value Chain Analysis
The value chain for automatic weapons runs from raw-material and energetics inputs (specialty steels for barrels and receivers, alloys, propellants, primers, and rare-earth-dependent electronics for sights and fire-control) to precision machining and forging, heat treatment, surface finishing, assembly, and qualification testing. Upstream constraints increasingly show up at sub-tier suppliers (Tier-2/Tier-3), including machining capacity, castings and forgings, and specialized components. Integrators then combine weapons with optics, suppressors, remote weapon station subsystems, and digital fire-control units to meet networked and counter-UAS requirements.
Most demand flows through government procurement channels (defense ministries, and to a smaller extent, law-enforcement agencies). Delivery is shaped by contracting vehicles, export licensing, and end-user certification. The report context highlights supply-chain volatility around barrel-steel alloys and rare-earth magnets, and industrial-base analysis in the context also points to sub-tier capacity, skilled labor availability, and capital access as key drivers of production timelines, rather than prime-level assembly alone. This is pushing greater emphasis on modular designs, standardized parts, and domestic sourcing programs to stabilize throughput.
Competitive Landscape
The automatic weapons market is moderately consolidated. Legacy primes—General Dynamics Corporation, Northrop Grumman, Rheinmetall AG—retain scale advantages in medium-caliber guns and ammunition backlogs, yet face agile competition from firms specializing in software-defined sights and unmanned turrets. Northrop Grumman, for example, leads global medium-caliber sales with its Bushmaster line and maintains in-house ammunition lines, ensuring bundled offers that suit fixed-price contracts.[2]
Mergers and Acquisitions remain brisk as companies seek vertical integration. Colt CZ Group acquired Mk 47 grenade-launcher technology and later purchased Valley Steel Stamp to secure a US parts foothold.[3] The same group closed a USD 2.225 billion buyout of The Kinetic Group, consolidating ammunition production under one roof. Rheinmetall’s USD 950 million purchase of Loc Performance boosts its US vehicle integration capacity, enabling bundled turret-vehicle offerings attractive to the Army’s Optionally Manned Fighting Vehicle program.
Tech startups exploit white-space niches in AI models for automatic target detection and in ultra-light composite receivers. Patent filings in automated threat detection and non-lethal vehicle-launched weapons rose sharply in 2024. To outpace rivals, incumbents sign data-sharing pacts with optics companies, ensuring software roadmaps align with platform refresh cycles. Supply-chain stress, especially for rare-earth magnets, has triggered joint ventures aimed at domestic processing, further reshaping partner networks. Market winners will be those blending mechanical pedigree with updatable software stacks that keep pace with evolving engagement rules.
Automatic Weapons Industry Leaders
-
Rheinmetall AG
-
BAE Systems plc
-
General Dynamics Corporation
-
SIG SAUER, Inc.
-
Northrop Grumman Corporation
- *Disclaimer: Major Players sorted in no particular order
Automatic Weapons Market Companies Covered in this Report
- General Dynamics Corporation
- Northrop Grumman Corporation
- Rheinmetall AG
- Denel Land Systems (Denel SOC Ltd.)
- BAE Systems plc
- Sig Sauer, Inc.
- Israel Weapon Industries (IWI) Ltd.
- Singapore Technologies Engineering Ltd.
- Heckler & Koch GmbH
- FN HERSTAL (FN Browning Group)
- Kalashnikov Concern JSC
- Colt CZ Group SE (Ceska Zbrojovka)
- China North Industries Group Corporation Limited (NORINCO Group)
- Advanced Weapons & Equipment India Ltd. (AWEIL)
- PT Pindad
- STV GROUP a.s.
Market Opportunities and Future Outlook
Opportunities concentrate in upgrades that position automatic weapons as connected, counter-UAS-capable effectors, and in replacement programs for aging infantry inventories. The US Army shift to the Next Generation Squad Weapon family (M7 rifle and M250 automatic rifle), along with fielding of AI-enabled optics such as SMASH 2000L referenced in the report context, creates demand for digital fire-control, ruggedized sensors, software update pipelines, and integration services. These offerings aim to reduce operator workload while improving drone defeat and moving-target performance.
Similar pull-through shows up in vehicle and naval applications as remote weapon stations expand across land vehicles and patrol craft. That widens requirements for stabilized mounts, electro-optics, and medium-caliber cannon integration. Beyond platform needs, policy and procurement initiatives in allied supply chains and exports create additional commercial openings. The US Department of Defense released its 2026 National Defense Strategy in January 2026 with an emphasis on rebuilding the domestic defense industrial base, and the White House issued an America First Arms Transfer Strategy in February 2026 that prioritizes American interests in foreign arms sales. In Canada, procurement activity to replace rifles in service for over 30 years, reported as beginning in 2026 for more than 65,000 new assault rifles, signals ongoing demand for modern, modular small arms and lifecycle support, while raising the bar for suppliers that can localize production, ensure compliance, and secure sub-tier components to reduce schedule risk.
Recent Industry Developments in Automatic Weapons Market
- July 2026: American Rheinmetall unveiled the Highly-Advanced Multi-Mission Rifle (HAMMR) as a 40 mm contender for the US Army Precision Grenadier System requirement, pairing programmable airburst munitions with digital fire control. The announcement reflects the move to bring squad-level airburst and counter-UAS effects into a lighter, more integrated automatic-launcher format, and it strengthens Rheinmetall's positioning in US small-unit modernization.
- May 2025: The US Army granted Type Classification-Standard approval for the Next Generation Squad Weapon family, covering the SIG SAUER M7 rifle and M250 automatic rifle. This milestone formalized the configuration for broad fielding and shifts supplier demand toward sustained production, spares, training, and integration of advanced optics across the automatic small-arms inventory.
- September 2024: The US Army awarded US Ordnance a USD 15 million contract for 7.62x51 mm M60E6 and M60E4 machine guns, conversion kits, support equipment, and training. The award highlights continued sustainment and modernization spending for legacy automatic weapons alongside next-generation programs, supporting mixed-fleet readiness and near-term replenishment needs.
Automatic Weapons Market Report Scope and Research Methodology
Market Definition and Coverage
This market covers the value of automatic weapons sold for defense and law enforcement use, including automatic rifles, machine guns, automatic launchers, automatic cannons, and Gatling-type systems, across land, naval, and airborne platforms.
Scope exclusions: civilian sporting and hunting firearms that are not procured for defense or law enforcement use are excluded from this sizing.
Segments Covered in This Report
- By Type
- Automatic Rifles
- Machine Guns
- Automatic Launchers
- Automatic Cannons
- Gatling Gun
- By Platform
- Land
- Airborne
- Naval
- By Caliber
- Small Caliber
- Medium Caliber
- Large Caliber
- By End-User
- Defense
- Army
- Navy
- Air Force
- Special Operations Forces
- Law Enforcement
- Defense
- By Geography
- North America
- United States
- Canada
- Mexico
- Europe
- United Kingdom
- Germany
- France
- Russia
- Rest of Europe
- Asia-Pacific
- China
- India
- Japan
- South Korea
- Rest of Asia-Pacific
- South America
- Brazil
- Rest of South America
- Middle East and Africa
- Middle East
- Saudi Arabia
- United Arab Emirates
- Israel
- Rest of Middle East
- Africa
- South Africa
- Rest of Africa
- Middle East
- North America
Data Sources, Market Sizing, and Validation
Desk Research
Desk work started with building a clean demand map from public defense procurement signals and force-structure context. We typically rely on sources such as the Stockholm International Peace Research Institute (SIPRI), UN Comtrade trade statistics, NATO and national defense ministry budget documents, congressional and parliamentary budget offices, and customs or export-control related releases where available.
To keep the model grounded, we also review company annual reports, investor presentations, and contract award notices, along with reputable defense press coverage for program timing and platform refresh cycles. In a few places, paid subscriptions for company financials and news intelligence, plus a global contracts and tenders database, were used to speed up cross-checks of announcements and award values. These desk sources are not exhaustive, and many other public references were used for data collection, validation, and clarification.
Primary Interviews and Surveys
Primary work focused on interviews and structured surveys with procurement-facing stakeholders, including defense program managers, law enforcement procurement teams, distributors, and component suppliers, so assumptions about demand cycles and pricing could be tested against real buying behavior. For a global market like this, coverage was balanced across APAC, EMEA, and the Americas to reflect different modernization priorities and procurement pacing.
Distribution of primary research fieldwork respondents
| Company type | Respondent position | Region |
|---|---|---|
| Top tier: 39% | CXOs: 13% | APAC: 39% |
| Mid tier: 47% | Functional/Unit leaders: 32% | EMEA: 35% |
| Smaller Players: 14% | Managers: 55% | Americas: 26% |
Market-Sizing & Forecasting
The sizing starts with a top-down build where defense and law enforcement demand pools are reconstructed using procurement budgets, platform upgrade cycles, and import or export flows, then aligned to what qualifies as automatic weapons in this scope. Where the data got patchy, gaps were handled through clearly stated adoption and replacement assumptions that were validated in calls, including how often specific weapon types are refreshed in active service.
After that, results were checked with selective bottom-up approximations so totals do not drift away from reality. These checks include sampled program volumes multiplied by typical unit pricing, supplier and channel feedback on average selling price movement, and roll-ups of visible contract awards where values are disclosed. Key inputs included defense spending trends, active personnel and force expansion plans, modernization program timing, platform mix shifts between land and naval systems, caliber preference changes, and the split between defense and law enforcement demand.
Forecasting was done using scenario analysis supported by expert views on procurement pacing, since tender timing and budget releases can move faster than underlying security needs. A base case was then stress-tested against quicker modernization and slower award-cycle scenarios, and only then the final growth path was locked.
Data Validation & Update Cycle
Before sign-off, estimates were triangulated across independent signals, then variance checks were run at region and segment levels to catch outliers early. When a number looked off, the assumptions were reviewed, and respondents were re-contacted to confirm whether the change was a real procurement shift or a data artifact.
Each report goes through multi-step internal review so calculations, unit logic, and currency conversions are consistent across the workbook. We refresh the model annually, and interim updates are triggered when material events occur such as major contract awards, policy changes affecting procurement, or clear shifts in defense budgets. Right before delivery, a final analyst pass is completed so the latest public releases are reflected in the outputs clients receive.
Mordor Intelligence's Automatic Weapons Market Estimate Compared With Other Published Estimates
It is common to see different market sizes for automatic weapons because the boundary of what is counted can move, even when the title looks the same. The year selected, the treatment of platforms, and how pricing is handled across contracts and regions can each shift the final number.
By tracking platform-level procurement signals and refreshing currency timing and contract-to-delivery assumptions, Mordor Intelligence keeps the estimate focused on defense and law enforcement automatic weapons and avoids mixing in adjacent civilian firearm revenues that inflate totals in some write-ups.
Benchmark comparison
| Source | Market Size | Gaps in Research Methodology |
|---|---|---|
| Mordor Intelligence | USD 8.96 B (2025) | |
| Global Consultancy A | USD 9.99 B (2025) | Uses a broader category description without clearly separating defense and law enforcement automatic weapons from adjacent firearm revenue pools, which can lift the 2025 total. The longer forecast window also tends to smooth near-term procurement timing swings that our model treats explicitly. |
| Industry Publisher B | USD 9.87 B (2025) | Counts semi-automatic and fully automatic within the same market definition, which widens the scope beyond this study and raises the base-year value. It also applies a different end-use framing (including handheld and stationary) without clarifying procurement filters tied to defense and law enforcement budgets. |
The spread in the table mostly comes from scope edges and how demand is tied back to procurement reality. When inclusion rules stay tight and assumptions are checked against budget and award signals, the resulting market size is easier to explain and repeat year after year.
Key Questions Answered in the Report
What is the current size of the automatic weapons market?
The automatic weapons market stands at USD 9.63 billion in 2026 and is projected to reach USD 13.81 billion by 2031.
Which region is growing fastest in automatic weapons procurement?
Asia-Pacific shows the highest growth with a 8.74% CAGR, driven by modernization across China, India, Japan, and South Korea.
Why are Automatic Cannons the fastest-growing weapon type?
Naval and air-defense programs favor 30–40 mm cannons with air-burst munitions that counter drones and light armor, producing an 8.32% CAGR.
How are supply-chain risks affecting manufacturers?
Reliance on Chinese rare-earth processing and limited barrel-steel capacity adds cost and schedule risk, prompting governments to re-shore production.
What role do Special Operations Forces play in innovation?
SOF units adopt lightweight, high-caliber systems early, validating new materials and AI sights that later trickle down to conventional infantry.
Are AI-enabled optics becoming standard?
Yes. Contracts like the SMASH 2000L scope for the US Army show that smart sights able to auto-track drones are moving from prototypes to field issue.