
Autologous Cell Therapy Market Size and Share
Market Overview
| Study Period | 2020 - 2031 |
|---|---|
| Market Size (2026) | USD 7.99 Billion |
| Market Size (2031) | USD 16.53 Billion |
| Growth Rate (2026 - 2031) | 15.66 % |
| Fastest Growing Market | Asia Pacific |
| Largest Market | North America |
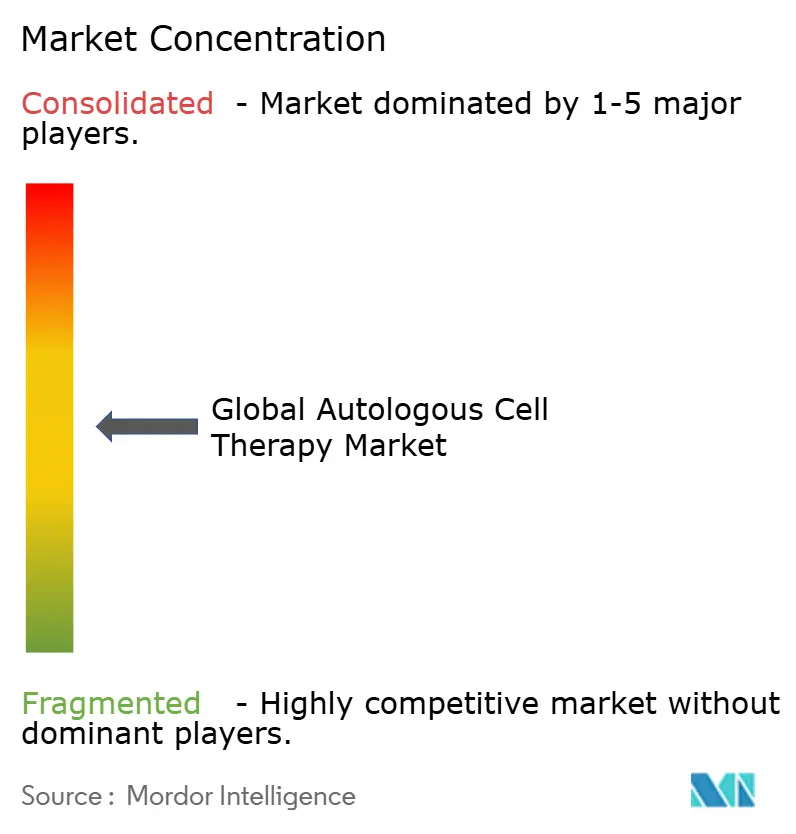
| Market Concentration | Medium |
Major Players *Disclaimer: Major Players sorted in no particular order Image © Mordor Intelligence. Reuse requires attribution under CC BY 4.0. | |
Autologous Cell Therapy Market Analysis by Mordor Intelligence
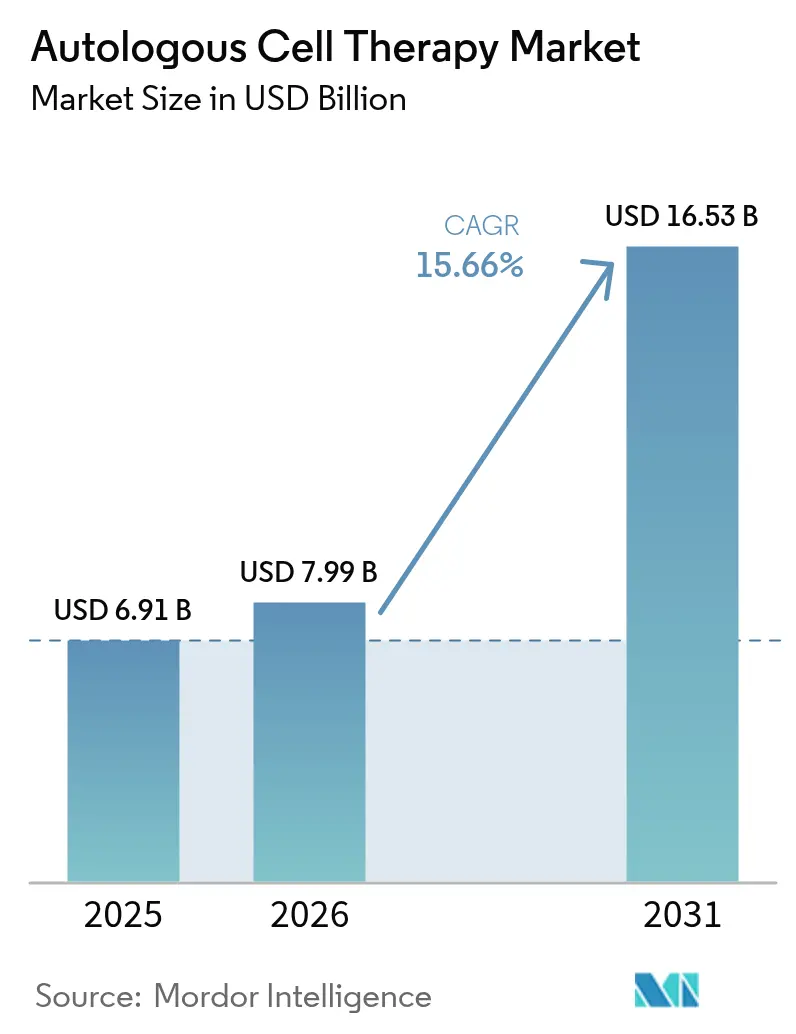
The autologous cell therapy market size was valued at USD 6.91 billion in 2025 and estimated to grow from USD 7.99 billion in 2026 to reach USD 16.53 billion by 2031, at a CAGR of 15.66% during the forecast period (2026-2031). Heightened clinical adoption of patient-specific CAR-T products, rapid scale-up of point-of-care micro-factories, and United States FDA RMAT designations that cleared eight cell and gene therapies in 2024 underpin this acceleration[1]Source: U.S. Food and Drug Administration, “CAR-T Cell Products Guidance,” fda.gov. Competitive intensity has increased as pharmaceutical majors acquire automation assets to shorten vein-to-vein time from weeks to days, while outcomes-based contracts in Europe and Japan address payer concerns over single-administration costs exceeding USD 400,000 per patient. North America continues to command the largest regional position in the autologous cell therapy market at 53.34%, but Asia-Pacific is expanding the fastest at an 18.01% CAGR on the back of regulatory modernization and lower manufacturing overheads.
Key Report Takeaways
- By therapy modality, immune-cell products captured 43.12% of autologous cell therapy market share in 2025 while registering the highest CAGR of 16.98% through 2031.
- By application, oncology led with 35.26% revenue share in 2025; autoimmune disorders are forecast to expand at a 15.92% CAGR to 2031.
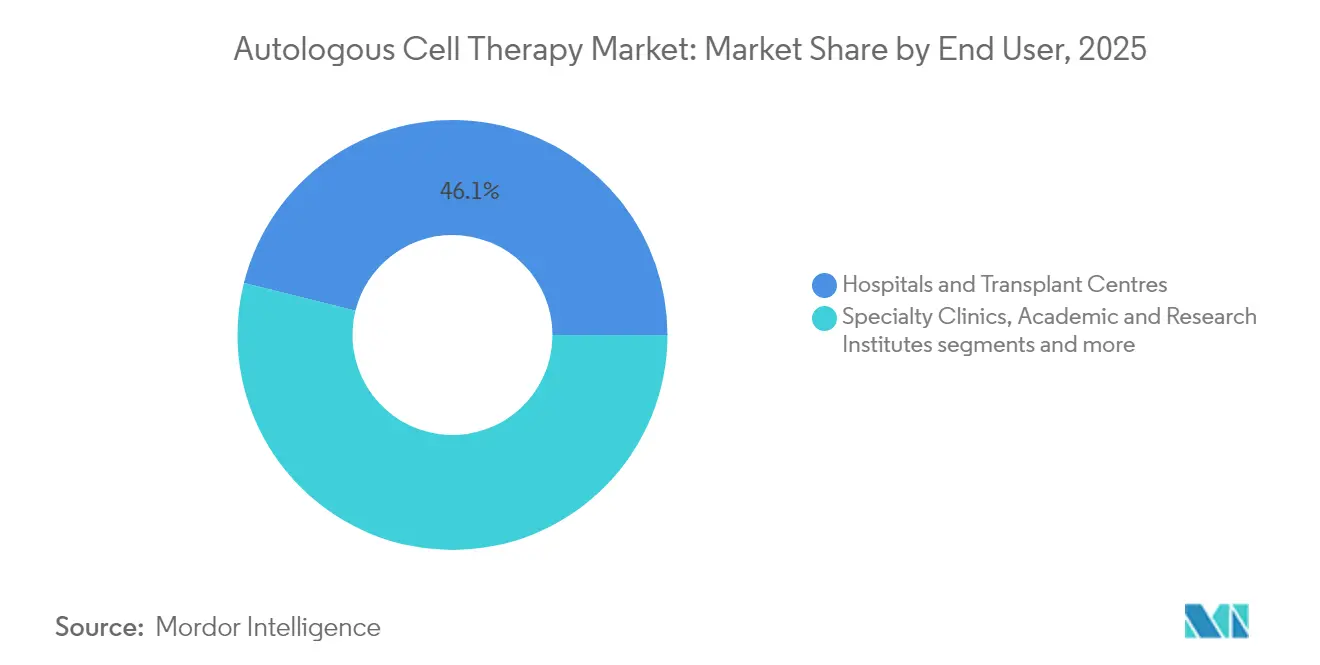
- By end user, hospitals and transplant centers accounted for 46.12% of the autologous cell therapy market size in 2025, whereas specialty clinics are poised for the fastest 16.1% CAGR.
- By geography, North America held 52.74% revenue share in 2025; Asia-Pacific is projected to grow at an 17.58% CAGR through 2031.
Note: Market size and forecast figures in this report are generated using Mordor Intelligence’s proprietary estimation framework, updated with the latest available data and insights as of 2026.
Market Trends and Insights
Drivers Impact Analysis of Autologous Cell Therapy Market*
| Driver | (~) % Impact on CAGR Forecast | Geographic Relevance | Impact Timeline |
|---|---|---|---|
| Post-approval CAR-T therapy roll-outs worldwide | +2.80% | Global (North America & EU core) | Medium term (2-4 years) |
| Rapid adoption of closed-system point-of-care bioreactors | +2.10% | North America & EU, expanding to APAC | Short term (≤ 2 years) |
| Expansion of cell-processing micro-factories inside transplant centres | +1.90% | Global, early uptake in major hospitals | Medium term (2-4 years) |
| Emergence of cryopreserved autologous starting-material banks | +1.40% | North America & EU core | Long term (≥ 4 years) |
| Outcomes-based reimbursement pilots in EU & Japan | +1.20% | EU & Japan | Long term (≥ 4 years) |
| Source: Mordor Intelligence | |||
Post-approval CAR-T Therapy Roll-outs Worldwide
Global deployment of licensed CAR-T products is broadening beyond hematology to autoimmune and solid-tumor indications. Gilead’s anito-cel, positioned for a 2026 launch, targets multiple myeloma with the ambition to convert 20% of inpatient infusions to outpatient settings during pivotal trials. Bristol Myers Squibb’s CD19 NEX-T program applies optimized manufacturing to severe systemic lupus erythematosus, signalling a strategic pivot from oncology into immune reset therapies. A USD 200 million BioNTech–Autolus alliance underscores consolidation around shared production platforms able to support multi-asset pipelines Autolus Therapeutics. Real-world evidence from Kite Pharma confirms that Yescarta can be administered safely in outpatient oncology clinics, reducing bed occupancy and total care costs Kite Pharma. Together, these milestones widen patient access while improving the economic narrative that surrounds the autologous cell therapy market.
Rapid Adoption of Closed-system Point-of-care Bioreactors
Closed, automated bioreactors integrate cell isolation, transduction, and expansion inside a sealed cassette, trimming manual touch-points that previously drove batch failures. Ori Biotech’s IRO platform achieved 69% viral transduction versus 45% in legacy workflows while halving per-dose costs through 25% shorter production cycles[2]Source: Ori Biotech Ltd., “IRO Platform Unveiled at ISCT 2024,” oribiotech.com . Xcell Biosciences reports consistent T-cell outgrowth in its AVATAR Foundry across 50 mL to 1.5 L scale, enabling decentralized runs within hospital cleanrooms. These improvements strengthen supply resilience and create a virtuous feedback loop in the autologous cell therapy market, whereby faster turn-around amplifies clinical adoption.
Expansion of Cell-processing Micro-factories Inside Transplant Centres
Hospitals are commissioning compact, fully-enclosed suites that allow bedside collection, automated culture, and same-site reinfusion. Orgenesis’s OMPUL mobile unit demonstrates the ability to produce GMP-grade doses at a patient’s location, reducing inter-continental shipping costs that historically added USD 35,000 per lot Orgenesis. Spain’s public CAR-T program attained a 94% manufacturing success rate using on-site platforms, equal to commercial facilities but with shorter waitlists Frontiers in Immunology. Such micro-factory proliferation enhances geographic equity and accelerates growth of the autologous cell therapy market.
Emergence of Cryopreserved Autologous Starting-material Banks
Long-term storage below −120 °C safeguards cell potency, enabling multiple collections before scheduling manufacturing windows. Cytotherapy reports that dry-ice transport maintained 85% viability of mesenchymal stromal cells during COVID-19 air-cargo disruptions Cytotherapy. Stem Cells Translational Medicine identifies banking as especially valuable for heavily pre-treated oncology patients whose first apheresis often yields sub-therapeutic cell counts Stem Cells Translational Medicine. Building inventory bridges collection variability and de-risks batch scheduling across the autologous cell therapy market.
Restraints Impact Analysis of Autologous Cell Therapy Market*
| Restraint | (~) % Impact on CAGR Forecast | Geographic Relevance | Impact Timeline |
|---|---|---|---|
| High cost & limited economies of scale | −3.2% | Global, acute in emerging markets | Long term (≥ 4 years) |
| Complex vein-to-vein logistics & QC bottlenecks | −2.4% | Global, infrastructure dependent | Medium term (2-4 years) |
| Scarcity of viable cells in heavily pre-treated oncology patients | −1.8% | Global, advanced care settings | Short term (≤ 2 years) |
| Inter-patient cellular phenotype variability | −1.6% | Global | Long term (≥ 4 years) |
| Source: Mordor Intelligence | |||
High Cost & Limited Economies of Scale
Per-patient manufacturing totals GBP 2,260–3,040 versus GBP 930–1,140 for allogeneic options due to donor-specific screening, unique batch records, and low equipment utilization BioPharm International. Mobilization procedures average USD 10,605, with merely 20% of candidates achieving optimal CD34+ cell yields without adverse events Nature Blood & Marrow Transplantation. Until automation neutralizes labor intensity, high cost tempers diffusion of the autologous cell therapy market.
Complex Vein-to-Vein Logistics & QC Bottlenecks
Therapies must remain below −120 °C; short-term excursions to −80 °C can drop viability by 30% according to Cytotherapy shipping audits Cytotherapy. Each patient batch undergoes full sterility and identity testing, extending release time by up to seven days PubMed. Delays adversely impact patients with rapidly progressing disease and constrain the autologous cell therapy market.
*Our forecasts treat driver/restraint impacts as directional, not additive. The impact forecasts reflect baseline growth, mix effects, and variable interactions.
Autologous Cell Therapy Market Segment Analysis
By Therapy Modality:
Immune Cells Drive Market EvolutionImmune-cell products held 43.12% of autologous cell therapy market share in 2025, growing at a 16.98% CAGR as CAR-T, TCR-T, and tumor-infiltrating lymphocyte therapies validate curative potential beyond hematology. Breakthroughs such as next-generation CD19 constructs with shortened culture times underpin rising clinical confidence. Meanwhile, natural-killer cell programs trialed in refractory solid tumors promise broader immune coverage yet retain autologous compatibility advantages.
Stem-cell modalities remain integral through hematopoietic transplantation and mesenchymal stem cell (MSC) applications in inflammatory disorders. FDA clearance of remestemcel-L in 2025 gave MSC therapies their first pediatric GVHD label, revitalizing investor appetite. Induced pluripotent stem cell pipelines target ischemic cardiomyopathy but will require cost-of-goods below USD 80,000 per dose to compete with existing options. Gene-modified non-immune cells occupy niche regenerative segments, benefiting from CRISPR-Cas precision yet facing extensive release testing demands.


By Application:
Oncology Leadership Faces Autoimmune ChallengeOncology accounted for 35.26% of the autologous cell therapy market size in 2025, anchored by CAR-T success in large B-cell lymphomas. Durable remissions exceeding 50% at five years keep oncology at the revenue apex, though manufacturing failures in heavily pre-treated cohorts remain a headwind. Pipeline diversification into solid tumors—supported by micro-environment-targeted conditioning agents—is expected to fortify near-term growth.
Autoimmune disorders, however, project the fastest 15.92% CAGR as early phase data in systemic lupus erythematosus and multiple sclerosis demonstrate immune-reset potential with reduced relapse rates. If pivotal trials confirm durable efficacy, the autologous cell therapy market could see autoimmune indications eclipse oncology contributions beyond 2030. Cardiovascular, orthopedic, and neurological segments add steady incremental demand as cell-based tissue repair protocols mature.
By End User:
Hospitals Anchor While Clinics AccelerateHospitals and transplant centers controlled 46.12% of autologous cell therapy market share in 2025, owing to embedded apheresis units, cryogenic storage, and intensive-care support for cytokine release syndrome management. Their dominance will persist as academic centers pioneer decentralized manufacturing models that integrate class C clean-rooms with automated bioreactors, compressing turnaround to five days for certain hematology protocols.
Specialty clinics are the fastest-growing channel amid improving outpatient safety profiles. Real-world Kite Pharma data verified that grade ≥3 adverse events in ambulatory settings mirror inpatient incidence, enabling payers to reimburse lower facility fees. Contract development and manufacturing organizations quietly underpin both channels by offering plug-and-play GMP suites that offload capital burdens from providers, further broadening the autologous cell therapy market footprint.
Geography Analysis
North America Autologous Cell Therapy Market
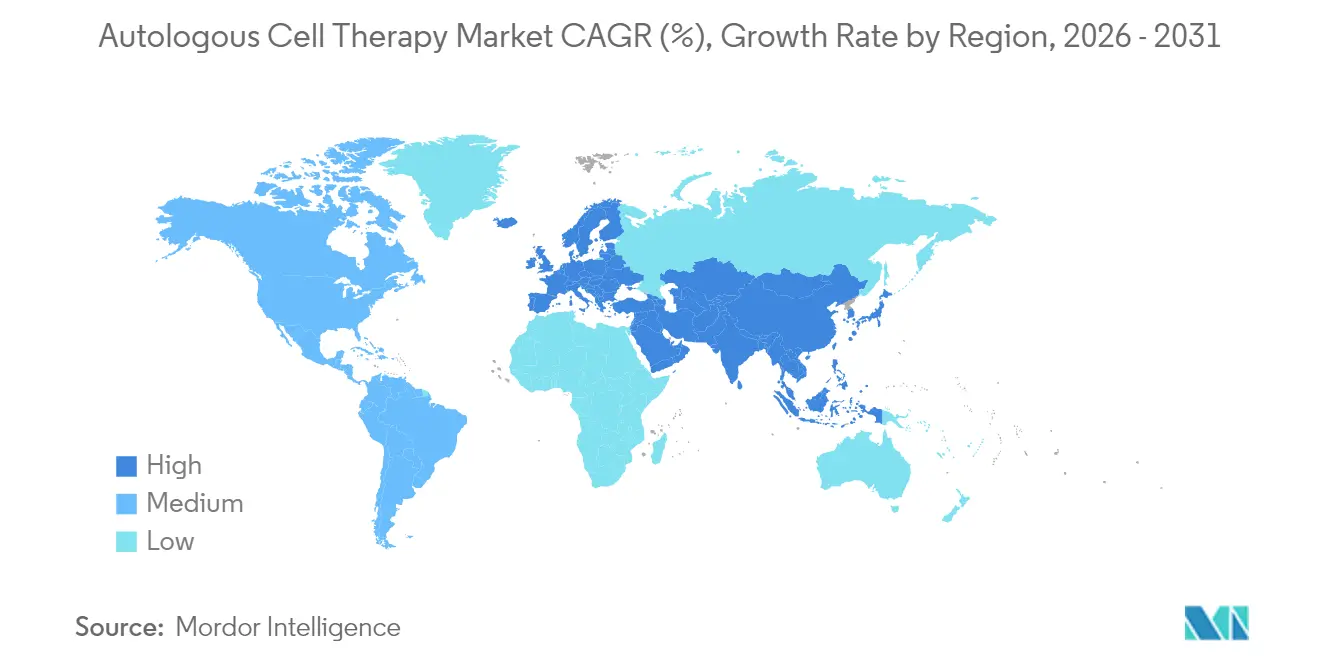
North America maintained 52.74% of autologous cell therapy market share in 2025, propelled by Medicare’s CGT Access Model that reimburses approved products contingent on registry data collection CMS. The region’s robust CDMO network shortens supply lines, and FDA’s Office of Therapeutic Products expects 10–20 annual approvals by 2025, sustaining leadership.
APAC Autologous Cell Therapy Market
Asia-Pacific recorded the highest 17.58% CAGR owing to supportive regulation under Japan’s fast-track Sakigake program and China’s provincial insurance pilots that now cover select CAR-T therapies. Localized micro-factories dampen logistics costs by up to 40%, an essential factor in emerging economies. India leverages medical tourism, while Australia and South Korea invest in regional GMP hubs, further enlarging the autologous cell therapy market.
Europe Autologous Cell Therapy Market
Europe grows steadily as managed entry agreements align multi-year payments with clinical benefit. Germany’s NUB reimbursement path grants temporary funding ahead of formal price negotiation, easing market access hurdles. Eastern Europe and Russia remain nascent but represent long-run whitespace as regulatory clarity improves.

Regulatory Landscape
Regulation for autologous cell therapies continues to emphasize accelerated pathways alongside tighter CMC and traceability controls. In the United States, FDA actions under CBER and PDUFA VII commitments (highlighted in early 2026 communications on flexible oversight) reinforce a risk-based approach for CGT development, while keeping requirements for chain-of-identity and chain-of-custody, including autologous-use labeling and unique donor identifiers.
Across major regions, harmonization of core quality expectations is progressing through ICH standards and advanced-therapy oversight bodies. The ICH Q5A(R2) viral safety guideline advanced into US implementation via the Federal Register in January 2024, anchoring expectations for viral safety evaluation relevant to cell-derived inputs and ancillary materials. In Europe, EMA Committee for Advanced Therapies (CAT) meeting outputs and quarterly highlights through 2025-2026 continue to guide ATMP classification and lifecycle expectations, supporting clearer routes for label expansions and marketing authorizations that intersect with autologous platforms.
Value Chain Analysis
The autologous cell therapy value chain starts with patient identification, scheduling, and leukapheresis, followed by time-critical cold-chain handling and chain-of-identity documentation through manufacturing and reinfusion. Core upstream inputs include patient cells, viral vectors or gene-editing reagents (where applicable), single-use consumables, and qualified testing materials, which then feed into GMP processing steps such as selection, activation, genetic modification or expansion, harvest, fill-finish, and batch release testing. Distribution is tightly linked to treatment sites (hospitals, transplant centers, and specialized clinics), with vein-to-vein coordination spanning couriers, cryogenic shippers, and digital orchestration tools.
Bottlenecks center on scheduling alignment (patient readiness versus manufacturing slots), QC release timelines, and constraints in viral vector availability and yields. The market increasingly blends in-house hospital processing with CDMOs and automation platform partners: Cellares completed a manufacturing technology adoption program for Cabaletta Bio's rese-cel on its Cell Shuttle platform (March 2025), Cellino partnered with Karis Bio around the Nebula platform for autologous iPSC therapy industrialization (April 2025), and CellProthera selected CELLforCURE by SEQENS for Phase 3 GMP manufacturing (May 2025). These collaborations point to closed, automated, and scalable-out workflows that reduce manual touchpoints while preserving traceability and comparability expectations for process changes.
Competitive Landscape
Competition is moderate; the five largest license holders command an estimated 55% combined revenue. Novartis expands Kymriah into follicular lymphoma, while Gilead/Kite advances anito-cel toward commercialization in multiple myeloma. Bristol Myers Squibb differentiates via autoimmune programs, securing pipeline depth outside crowded hematology spaces. BioNTech’s USD 200 million investment in Autolus exemplifies vertical integration to secure manufacturing capacity.
Strategic moves center on automation. Cellular Origins partnered with Cytiva to pair the Constellation robotic cluster with Sefia cell-processing hardware, targeting GMP deployment by late 2025 BioPharm International. Terumo BCT’s Quantum Flex system cuts harvest labor by 60%, appealing to hospital-owned facilities that lack extensive staff Pharmaceutical Manufacturer.
Emerging disruptors such as Ori Biotech and Orgenesis address cost and access constraints through modular platforms that can be deployed in underutilized hospital spaces. Lonza Group and Minaris scale out reserved suites for late-phase trials, de-risking capacity for mid-tier sponsors. Collectively, these dynamics accelerate clinical penetration and reinforce the growth trajectory of the autologous cell therapy market.
Autologous Cell Therapy Industry Leaders
Vericel Corporation
Pharmicell Co., Inc.
Holostem Terapie Avanzate S.r.l.
Opexa Therapeutics
Lineage Cell Therapeutics, Inc.
- *Disclaimer: Major Players sorted in no particular order
Autologous Cell Therapy Market Companies Covered in this Report
- Novartis
- Gilead Sciences / Kite Pharma
- Bristol-Myers Squibb
- Vericel
- Anterogen Co. Ltd.
- Pharmicell Co. Ltd.
- Osiris Therapeutics / Smith+Nephew
- SanBio Co. Ltd.
- Kolon TissueGene
- Boehringer Ingelheim (Stemlab)
- Medipost Co. Ltd.
- ReNeuron Group
- Takeda Pharmaceutical (TiGenix)
- Cell Therapies Pty Ltd.
- Lonza Group (Autologous CDMO)
- Minaris Regenerative Medicine
- Fate Therapeutics
- Tessa Therapeutics
- CliniMACS / Miltenyi Biotec
- MaxCyte
- BioNTech Cell & Gene
- Iovance Biotherapeutics
- NorthX Biologics
- Vineti Inc.
- Ori Biotech

Market Opportunities and Future Outlook
Operational simplification and capacity access are prominent whitespace areas, particularly where patient-specific logistics and QC timelines limit treatment throughput. FDA communications in January 2026 on flexible CMC oversight for cell and gene therapies give sponsors more workable options for development-to-commercial transitions, aligning with broader adoption of closed-system automation and comparability planning. At the same time, public-sector and mission-driven efforts such as the ARPA-Hs GIVE program (launched September 2025) target distributed and automated manufacturing approaches, reinforcing investment into decentralized or hybrid manufacturing networks that better match autologous constraints.
Manufacturing infrastructure and service capacity additions are also creating near-term openings for technology providers, CDMOs, and hospital-based micro-factories to shorten vein-to-vein time and improve reliability. Johnson and Johnson announced a more than USD 1 billion investment (February 2026) in a next-generation cell therapy manufacturing facility in Montgomery County, Pennsylvania. Separately, Kincell Bio announced an expansion of its Research Triangle Park facility with two additional ISO 7 cleanroom suites targeted for operation by Q3 2026 (April 2026). FUJIFILM Cellular Dynamics opened a new iPSC manufacturing facility in Madison, Wisconsin as part of a USD 200 million strategic investment (May 2026), supporting broader supply of high-quality cellular starting materials and process development capabilities relevant to autologous and patient-specific workflows.
Recent Industry Developments in Autologous Cell Therapy Market
- May 2026: Vericel reported first-quarter 2026 results and raised its full-year guidance, reflecting continued commercial momentum in its autologous portfolio led by MACI. The update indicated ongoing investment capacity to support demand while maintaining manufacturing and quality systems required for patient-specific products.
- November 2025: Pharmicell signed a contract with Asan Medical Center to provide CMO services supporting advanced regenerative medicine clinical research. The agreement strengthens hospital-linked manufacturing access and reinforces the shift toward partner-enabled capacity for patient-specific cell therapy programs.
- May 2024: The European Commission approved Holostems cell and gene therapy initiative under an Important Project of Common European Interest (IPCEI) framework. This program backing supports longer-horizon capability building in advanced therapy manufacturing and cross-border ecosystem development in Europe.


Autologous Cell Therapy Market Report Scope and Research Methodology
Market Definition and Coverage
This market is defined as revenues generated from therapies that use a patient's own cells, which are collected, processed (including expansion or engineering), and then administered back to the same patient in a clinical setting.
Scope exclusions: We exclude allogeneic and xenogeneic cell therapies, and we also exclude acellular gene-editing therapies that do not involve viable cells being administered.
Segments Covered in This Report
- By Therapy Modality (Value)
- Stem Cell Therapies
- Hematopoietic Stem Cells (HSC)
- Mesenchymal Stem Cells (MSC)
- Induced Pluripotent Stem Cells (iPSC)
- Immune Cell Therapies
- CAR-T Cells
- TCR-T Cells
- Tumour-Infiltrating Lymphocytes (TIL)
- Natural Killer (NK) Cells
- Gene-Modified Non-immune Cell Therapies
- Stem Cell Therapies
- By Application (Value)
- Oncology
- Cardiovascular Diseases
- Orthopaedic & Musculoskeletal Disorders
- Neurology
- Dermatology & Wound Healing
- Auto-immune Disorders
- Others
- By End User (Value)
- Hospitals & Transplant Centres
- Specialty Clinics
- Academic & Research Institutes
- Others
- By Geography (Value)
- North America
- United States
- Canada
- Europe
- Germany
- United Kingdom
- France
- Italy
- Spain
- Russia
- Asia-Pacific
- China
- Japan
- India
- South Korea
- Australia
- Rest of Asia-Pacific
- Middle East & Africa
- GCC
- South Africa
- Rest of Middle East and Africa
- South America
- Brazil
- Argentina
- Rest of South America
- North America
Data Sources, Market Sizing, and Validation
Desk Research
Desk research is used to build the base structure for the model, and then to sanity-check it against real world signals that can be observed consistently over time. We leaned on public and official sources such as the FDA and EMA approvals and product labels, ClinicalTrials.gov for trial flow, and the National Institutes of Health for therapy area context and funding signals.
To keep revenue assumptions practical, we also reviewed sources such as the World Health Organization for disease burden direction, the OECD and World Bank for health spending and macro indicators, and customs and trade statistics where relevant for inputs used in cell processing. Company filings, investor presentations, and reputable press were reviewed to understand commercial ramp timing, manufacturing readiness, and geographic rollouts. Select paid databases were used for company financials, news, and patent activity, to confirm timelines and technology focus. These examples are not exhaustive, and many other sources were also used for data collection, validation, and clarification during the research process.
Primary Interviews and Surveys
Primary work was used to pressure-test the demand pool and pricing logic, especially where public disclosures are incomplete. We spoke with a mix of therapy developers, contract manufacturers and service providers, hospital and transplant center stakeholders, and domain experts across key regions, so assumptions on uptake, treatment timelines, and reimbursement sensitivity could be corrected where needed.
Distribution of primary research fieldwork respondents
| Company type | Respondent position | Region |
|---|---|---|
| Top tier: 29% | CXOs: 12% | APAC: 46% |
| Mid tier: 50% | Functional/Unit leaders: 36% | EMEA: 31% |
| Smaller Players: 21% | Managers: 52% | Americas: 23% |
Market-Sizing & Forecasting
Sizing is first built using a top-down approach where the treated patient pool is reconstructed by therapy area, eligible population, and expected penetration, and then translated into revenues through pricing and treatment course assumptions. In practice, the model is anchored on a short list of inputs that tend to move the market each year, and each input is reviewed before totals are finalized.
Key variables used include the count and timing of product approvals, the active clinical pipeline by phase, manufacturing capacity readiness (including shift from manual to more automated processing), average selling price trends by therapy class, and regional reimbursement and access indicators. Where public data is thin, gaps are handled with bounded assumptions clearly linked to observed signals, such as launch sequence by geography and a realistic site activation pace.
Forecasts are produced using scenario analysis, because adoption and pricing can change based on regulatory outcomes, capacity constraints, and payer decisions. The base case is refined with selective bottom-up checks, such as sampled volume by indication combined with plausible ASP ranges and channel feedback from treatment centers, and then adjusted until the outputs align with the most defensible demand and supply constraints.
Data Validation & Update Cycle
Validation is handled through multiple cross-checks so the final number stays consistent with independent market signals. We compare outputs against approval counts, therapy launch timing, trial progression, and region level access patterns, and then investigate variances when growth appears too steep or too flat for what is observable in the field.
Before sign-off, the model and assumptions go through step-by-step analyst reviews, and follow-up calls are triggered when a critical input shifts, such as a major approval, a safety-related label change, or a clear pricing update. Reports are refreshed annually, and interim updates are made when material events would change the market direction. Right before delivery, a final review pass is completed so the latest updated view is reflected in the output.
Mordor Intelligence's Autologous Cell Therapy Market Size Versus Other Published Estimates
Published market sizes for autologous cell therapy often differ even when they appear to cover the same space, because the therapy boundary and revenue capture rules are not always aligned. Differences also come from the base year selected, how pricing is trended, and how quickly commercial adoption is assumed to expand across regions.
By tracking approval timing, treated patient ramp assumptions, and price progression inputs, Mordor Intelligence keeps the model focused on revenues tied to viable patient-derived cell products and related services, instead of mixing in adjacent modalities or broader regenerative medicine revenues that may not be comparable.
Benchmark comparison
| Source | Market Size | Gaps in Research Methodology |
|---|---|---|
| Mordor Intelligence | USD 7.99 B (2026) | |
| Industry Research Publisher A | USD 5.41 B (2024) | Uses an earlier base year and a different forecast window, and it appears to apply faster commercialization and pricing expansion assumptions that can shift totals when compounded over time. |
| Industry Research Publisher B | USD 9.33 B (2024) | Represents the market from a 2024 base and may include a broader set of autologous therapy definitions by product type and application, which can pull in revenues that are treated as out of scope in narrower cell reinfusion boundaries. |
The table shows that the spread mainly comes from what is counted, which year is used as the anchor, and how adoption and ASP are allowed to move through the forecast. When the scope is kept tight to autologous viable cell administration, and assumptions are checked against approvals, pipeline flow, and practical capacity limits, the resulting market size stays easier to trace and repeat across updates.


Key Questions Answered in the Report
What is the global value of the autologous cell therapy market in 2026?
The market was valued at USD 7.99 billion in 2026 and is forecast to reach USD 16.53 billion by 2031.
Which therapy modality currently leads the autologous cell therapy market?
Immune-cell products, particularly CAR-T therapies, hold the lead with 43.12% revenue share.
Why is Asia-Pacific the fastest-growing region?
Regulatory reforms, expanding clinical infrastructure, and lower production costs drive an 17.58% CAGR in Asia-Pacific.
How are payers addressing high upfront costs of autologous therapies?
European and Japanese health systems use outcomes-based reimbursement, linking payments to long-term clinical success.
What manufacturing innovations are reducing costs?
Closed-system bioreactors and hospital-based micro-factories cut labor and logistics costs, lowering per-dose expenses by up to 50%.
Page last updated on:


 Your data is secure and never sold or shared.


