
Market Overview
| Study Period | 2020 - 2031 |
|---|---|
| Forecast Data Period | 2026 - 2031 |
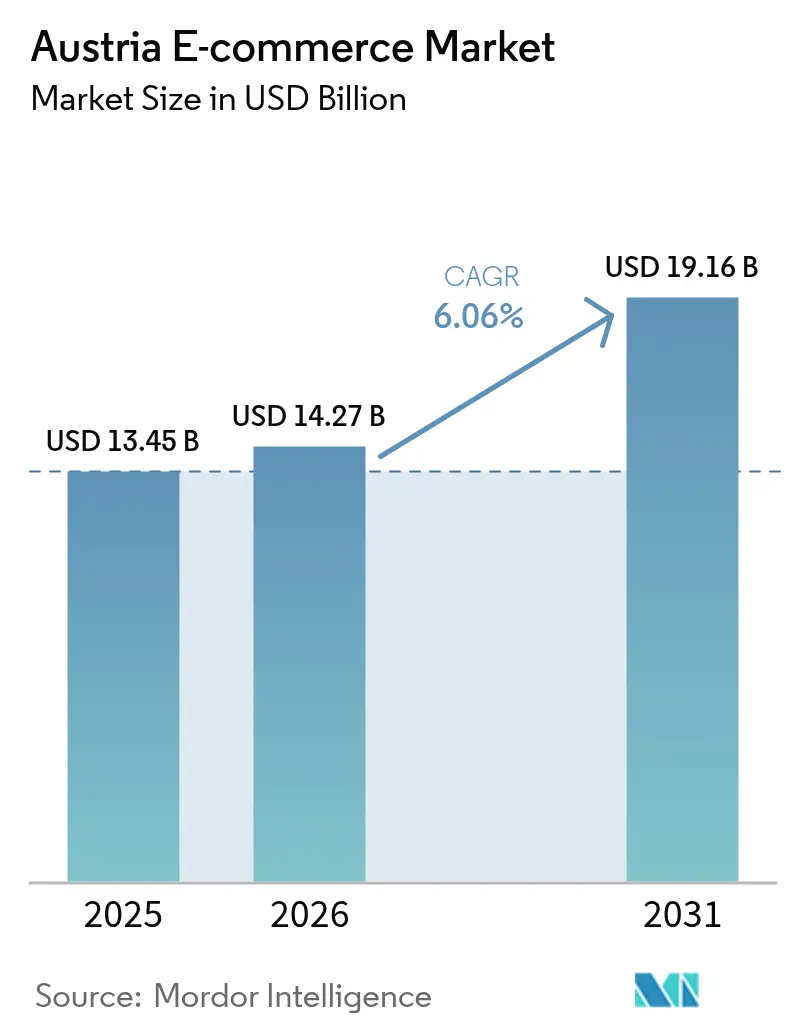
| Base Year Market Size (2025) | USD 13.45 Billion |
| Market Size (2026) | USD 14.27 Billion |
| Market Size (2031) | USD 19.16 Billion |
| Growth Rate (2026 - 2031) | 6.06% CAGR |
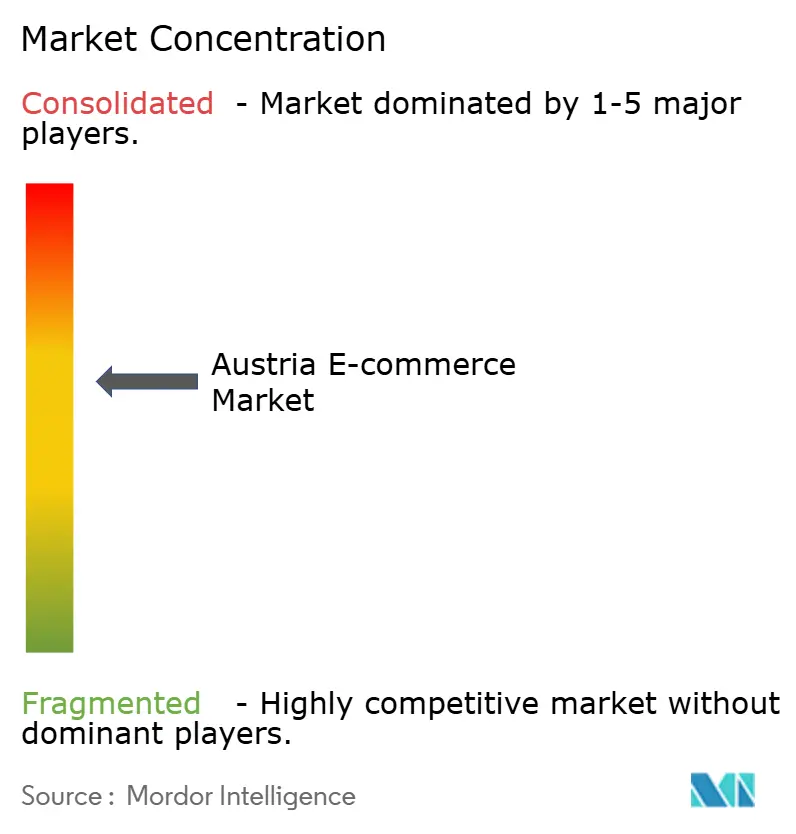
| Market Concentration | Medium |
Major Players *Disclaimer: Major Players sorted in no particular order Image © Mordor Intelligence. Reuse requires attribution under CC BY 4.0. | |
Austria E-commerce Market Analysis by Mordor Intelligence
The Austria E-commerce market size was valued at USD 13.45 billion in 2025 and estimated to grow from USD 14.27 billion in 2026 to reach USD 19.16 billion by 2031, at a CAGR of 6.06% during the forecast period (2026-2031). This steady trajectory reflects balanced momentum rather than explosive expansion, underpinned by nationwide gigabit connectivity targets, post-pandemic shifts toward mobile shopping, and widening acceptance of digital wallets and Buy-Now-Pay-Later (BNPL) services. German cross-border marketplaces deepen product variety and sharpen price competition, while Vienna-centred warehouse constraints raise fulfillment costs and widen the urban–rural service gap. Policy reforms such as Austria’s Verpackungsverordnung packaging ordinance intensify compliance spending, yet the same regulatory focus on sustainability positions re-commerce as a future growth lever. Collectively, these forces anchor the Austria E-commerce market as a stable albeit competitive digital commerce arena within Central Europe.
Key Report Takeaways
- By business model, B2C led with 84.30% revenue share in 2025; B2B is projected to expand at a 9.02% CAGR through 2031.
- By device type, smartphones commanded 58.45% of the Austria E-commerce market share in 2025 and are advancing at an 8.34% CAGR through 2031.
- By payment method, digital wallets retained 35.35% share of the Austria E-commerce market size in 2025, while BNPL records the fastest growth at 9.63% CAGR to 2031.
- By B2C product category, fashion & apparel held 27.60% share of the Austria E-commerce market size in 2025; food & beverage is expanding at a 10.22% CAGR through 2031.
Note: Market size and forecast figures in this report are generated using Mordor Intelligence’s proprietary estimation framework, updated with the latest available data and insights as of 2026.
Austria E-commerce Market Trends and Insights
Drivers Impact Analysis*
| Driver | (~) % Impact on CAGR Forecast | Geographic Relevance | Impact Timeline |
|---|---|---|---|
| Cross-border SKU Expansion by German Marketplaces | +1.2% | National, with concentration in Vienna and border regions | Medium term (2-4 years) |
| BNPL Adoption Among Gen-Z Shoppers | +0.8% | National, with urban concentration | Short term (≤ 2 years) |
| Broadband Austria 2030 Rural Fibre Roll-out | +1.5% | Rural areas, expanding to national coverage | Long term (≥ 4 years) |
| Dual-Income Households Fuel Premium Fashion Demand | +0.7% | Urban centers, particularly Vienna and Salzburg | Medium term (2-4 years) |
| EU Digital Product Passport Boosts Re-commerce | +0.6% | National, with early adoption in fashion and electronics | Long term (≥ 4 years) |
| Source: Mordor Intelligence | |||
Cross-border SKU expansion by German marketplaces
German marketplaces inject a broader assortment and sharper pricing into the Austria E-commerce market, with Amazon.de alone registering USD 922.4 million Austrian sales in 2022.[1]International Trade Administration, “Austria – eCommerce,” trade.gov Consumers benefit from wider choice while domestic retailers feel margin pressure, prompting pivots toward niche product curation, localised customer service and omnichannel pick-up points. Harmonised VAT rules since 2021 streamline check-out flows, keeping cross-border friction low and reinforcing the medium-term uplift.
BNPL adoption among Gen-Z shoppers
BNPL’s 9.8% CAGR mirrors Gen-Z preference for flexibility, elevating conversion rates in high-ticket fashion and electronics baskets. EU draft directives to fold BNPL into consumer-credit law should temper irresponsible lending, yet Austrian merchants embedding credit-risk analytics expect sustained cart-value gains once guardrails crystallise.
Broadband Austria 2030 rural fibre roll-out drives the market
The EUR 10-12 billion (USD 10.8-13 billion) public-private programme aims for nationwide gigabit speeds by 2030. New fibre backbones unlock rural demand where slow lines once deterred check-out, adding roughly 200,000 households to the reachable customer pool.[2]European Commission, “Digital connectivity in Austria,” digital-strategy.ec.europa.eu Retailers anticipate AR-enabled product views and high-definition livestream selling to flourish as bandwidth widens.
Dual-income households fuel premium fashion demand
A 74.1% employment rate and GDP per capita of EUR 49,400 (USD 53,300) in 2024 empower dual-income Austrian households to trade up to premium fashion online.[3]EURES European Union, “Labour Market Information: Austria,” eures.europa.eu Retailers that emphasise quality fabrics, limited editions and next-day delivery capture wallet share without deep discounting.
Restraints Impact Analysis*
| Restraint | (~) % Impact on CAGR Forecast | Geographic Relevance | Impact Timeline |
|---|---|---|---|
| Verpackungsverordnung Compliance Costs | -0.9% | National, with higher impact on smaller retailers | Short term (≤ 2 years) |
| Vienna-Area Warehouse Capacity Shortage | -0.6% | Vienna metropolitan area, affecting national distribution | Medium term (2-4 years) |
| Source: Mordor Intelligence | |||
Verpackungsverordnung compliance costs hinders the market
Expanded packaging obligations oblige each e-commerce seller to finance collection schemes and appoint local agents. Several Asia-based merchants suspended Austrian deliveries when fees erased profit on low-value SKUs. Bigger platforms leverage scale to dilute per-unit cost, widening the moat against smaller rivals.
Vienna-area warehouse capacity shortage hinders the market
Vacancy below 2% and escalating rents near the capital push fulfillment centres to peripheral zones, adding last-mile kilometres and fuel outlay [colliers.com](). Same-day promises become harder for SMEs, nudging consumers toward cross-border sites whose regional mega-hubs feed Austria overnight.
*Our forecasts treat driver/restraint impacts as directional, not additive. The impact forecasts reflect baseline growth, mix effects, and variable interactions.
Segment Analysis
By Business Model: B2B emerges as growth engine
The B2C stream maintained 84.30% of Austria E-commerce market size in 2025, yet the B2B channel is forecast to compound at 9.02% through 2031. Bulk order values, contract-based replenishment and workflow integrations translate into steadier cash flows for platforms courting enterprise buyers. Manufacturers located in Upper Austria and Styria embed punch-out catalogues and e-invoicing to cut procurement lead times, positioning the Austria E-commerce market for deeper penetration of industrial MRO and office supplies. Foreign buyers sourcing Austrian precision components further stretch addressable volumes. Meanwhile, consumer-oriented players defend share by layering experiential content, loyalty tiers and seamless returns, maintaining the broad appeal that sustains the Austria E-commerce market.


By Device Type: Mobile commerce dominance accelerates
Smartphones generated 58.45% Austria E-commerce market share in 2025 and headline the growth table with an 8.34% CAGR. App-first interfaces, biometric log-in and one-tap wallet checkout transform scrolling sessions into paid carts. Desktop traffic slips but retains relevance for complex B2B tender uploads. Tablets and connected TVs remain niche entertainment-driven gateways. Retailers embed video try-ons and AI chat to personalise mobile journeys, fuelling incremental spend and reinforcing the Austria E-commerce market’s mobile-first orientation.
By Payment Method: Digital transformation reshapes preferences
Digital wallets commanded 35.35% of Austria E-commerce market size in 2025, providing frictionless tokenised payments. BNPL options, despite a smaller base, advance at 9.63% CAGR by offering budget predictability to younger cohorts. Card rails still underpin many wallet or BNPL back-ends, but direct card share erodes as consumers migrate to embedded finance. Merchants that cascade three or more payment modes report double-digit declines in cart abandonment, evidencing how payment diversity now dictates competitive edge within the Austria E-commerce market.

By B2C Product Category: Food & Beverage disrupts traditional leaders
Fashion & apparel kept pole position at 27.60% Austria E-commerce market size in 2025, yet online groceries and meal kits post a 10.22% CAGR that will close the gap. Parcel carriers that rolled out insulated last-mile assets now service rural households alongside Vienna apartment blocks, broadening delivery density. Subscription snack boxes and regional farm produce tap Austria’s provenance-driven food culture. Electronics and furniture log mid-single-digit uplifts as replacement cycles lengthen, but upselling accessories helps sustain basket value across the Austria E-commerce market.
Geography Analysis
Vienna accounted for nearly 38.90% of 2025 online spend, buoyed by superior fibre coverage, dense courier fleets and high disposable incomes. Salzburg and Tyrol show elevated conversion rates thanks to tourism-funded logistics corridors that interface seamlessly with German supply hubs. Eastern provinces such as Burgenland trail on absolute volume yet are posting double-digit growth as Broadband Austria 2030 narrows the speed gap. Border districts record above-average cross-border shopping; 51% of Austrian e-purchases originate abroad, with German storefronts capitalising on language affinity. Alpine terrain complicates last-mile routing, though drone testbeds and parcel lockers along rail stations present mitigations that extend the Austria E-commerce market reach. As rural penetration rises, merchants anticipate more uniform demand curves across the nine federal states, diluting Vienna’s historic dominance but enlarging the overall Austria E-commerce market.
Regulatory Landscape
Austria e-commerce is governed primarily by the E-Commerce Act (E-Commerce-Gesetz, ECG), aligned with the EU e-Commerce Directive, alongside EU-wide consumer, VAT, and platform rules that shape cross-border selling into Austria. Platform and digital-services oversight is anchored by KommAustria, with RTR acting operationally, including its role as Austria's Digital Services Coordinator under the EU Digital Services Act (DSA).
Austria implemented the DSA through the DSA Accompanying Act (DSA-Begleitgesetz), which entered into force on 17 February 2024 and amended the ECG and related statutes. The updates tightened obligations around notice-and-action, transparency, and supervisory interaction for covered services. In 2026, Austria also advanced consumer-protection requirements for distance sales through the Consumer Rights Amendment Act 2026 (Verbraucherrechts-Änderungsgesetz 2026), including a mandatory online withdrawal button (Widerrufsbutton) scheduled to apply from 1 October 2026, which will add new UX and compliance-workflow requirements for merchants selling to Austrian customers.
Value Chain Analysis
Austria's e-commerce value chain starts with cross-border product sourcing, with German marketplaces and EU-wide sellers supplying a large share of SKUs delivered to Austrian addresses. Merchants and marketplaces then work through storefront and enablement layers (web and app front ends, product information management, fraud and credit scoring for BNPL, and customer service), before moving into payment execution (cards, digital wallets, and BNPL) and tax operations. For cross-border B2C distance sales, the EU One-Stop-Shop (OSS) framework supports simplified VAT handling.
Fulfillment and delivery depend on national and regional logistics networks. Austrian Post and its subsidiaries provide parcel, fulfillment, and returns services, supported by locker and pickup-point infrastructure. Capacity additions signal continued emphasis on sorting and local fulfillment: Austrian Post broke ground for a EUR 55 million expansion at Wals-Siezenheim to lift sorting throughput to 24,000 parcels per hour (matrix sorter), and Amazon began building a 6,900 sq. m distribution center in Enns with around EUR 70 million investment, focused on strengthening linehaul and last-mile coverage from Upper Austria. A separate layer of cross-border fulfillment services is also forming for SMEs, including euShipments.com opening a fulfillment hub in Enzersdorf an der Fischa to consolidate Austrian parcels for delivery across more than 27 European countries under a single contract structure.
Competitive Landscape
International multi-category platforms capture 65% of Austrian online spend, reflecting a moderate concentration where scale in logistics, cloud infrastructure and seller ecosystems sets the competitive tone. Amazon leverages its EUR 320 billion European investment blueprint to embed same-day capabilities and loyalty bundles that lift retention. Zalando’s acquisition of ABOUT YOU consolidates fashion traffic and enriches B2B fulfilment APIs, reinforcing category leadership. MediaMarktSaturn’s marketplace pivot aligns its bricks-and-mortar fleet with a 29% online revenue mix, demonstrating how omnichannel synergies counter pure-play rivals.
Domestic champions exploit regulatory know-how and last-mile density. Austrian Post’s Shöpping.at scales cross-border seller onboarding while its parcel unit handled over 500 million packages in 2024. Grocery leaders Spar and Billa Plus use micro-fulfillment nodes inside supermarkets to tighten delivery windows. Furniture specialist XXXLutz deploys augmented-reality room planners, cushioning the bulky-goods delivery challenge. Across the Austria E-commerce market, emerging differentiators include retail-media monetisation, AI-driven dynamic pricing and carbon-neutral delivery commitments, areas where scale players currently outrun niche operators.
Austria E-commerce Industry Leaders
Amazon.com Inc.
Zalando SE
MediaMarkt Saturn Retail Group
Otto GmbH (Universal.at)
H&M Group
- *Disclaimer: Major Players sorted in no particular order

Market Opportunities and Future Outlook
Mobile-led commerce optimization is a visible whitespace in Austria. Online retail spend via smartphones and tablets expanded to EUR 5.4 billion in 2026, up from EUR 4.1 billion in 2025, which takes mobile to 44% of total online expenditure, according to Handelsverband's E-Commerce Study Austria 2026. This shift supports opportunities for retailers and enablers focused on app performance, wallet-first checkout, and mobile-native merchandising, particularly in categories where conversion is sensitive to friction, such as fashion, beauty, and electronics.
Compliance-tech and data-driven commerce are also shaping near-term opportunity areas tied to policy and consumer behavior. Since February 2024, the DSA framework has been implemented nationally under RTR and KommAustria supervision, which has increased demand for platform governance tooling, including content moderation workflows, transparency reporting, and trader traceability features. In parallel, Austria's Data Access Act (Datenzugangsgesetz) entered into force in July 2025, implementing the EU Data Governance Act and reinforcing demand for interoperable data-sharing and analytics services that help merchants and marketplaces improve personalization and risk controls. This aligns with reported consumer uptake of AI-based shopping functions, with 37% using AI-assisted search or recommendations by April 2026. Cross-border competition further creates room for Austrian-focused propositions around service quality, sustainability, and recommerce, supported by association data in 2026 that points to a sizable share of e-commerce expenditure flowing to foreign providers, including non-European platforms such as Temu, Shein, and AliExpress.
Recent Industry Developments
- May 2026: Amazon broke ground on a new 6,900 sq. m distribution center in Enns, Upper Austria, backed by an investment of around EUR 70 million and targeted for completion in spring 2027. The project strengthens domestic fulfillment capacity around the Linz area and supports faster replenishment and last-mile density compared with reliance on cross-border hubs.
- May 2026: Zalando partnered with Vestiaire Collective to expand an authenticated pre-owned luxury assortment inside Zalando's Pre-owned offering across 14 European markets, including Austria. The partnership deepens category differentiation in fashion e-commerce by using verified resale, aligned with sustainability-driven shopping behavior.
- May 2024: Austrian Post announced the expansion of its Shöpping.at platform into Germany, enabling participating merchants to reach customers in both markets and adding cloud-based data integration tools for retailers. This step broadened cross-border sales routes for Austrian SMEs and reinforced Austrian Post's role beyond delivery into marketplace enablement.


Research Methodology Framework and Report Scope
Market Definition and Coverage
For this study, the market is defined as the value of goods and services ordered and paid for online by buyers in Austria, regardless of device used, with fulfillment delivered physically or digitally to an Austrian address.
Scope exclusions: Consumer to consumer classifieds, ticketing, pure digital streaming subscriptions, and in store click and collect transactions are excluded.
Segmentation Overview
- By Business Model
- B2C
- B2B
- By Device Type
- Smartphone / Mobile
- Desktop and Laptop
- Other Device Types
- By Payment Method
- Credit / Debit Cards
- Digital Wallets
- BNPL
- Other Payment Method
- By B2C Product Category
- Beauty and Personal Care
- Consumer Electronics
- Fashion and Apparel
- Food and Beverages
- Furniture and Home
- Toys, DIY and Media
- Other Product Categories
Data Sources, Market Sizing, and Validation
Desk Research
Desk work starts with mapping what Austria consumers buy online, and how that spend moves through domestic and cross border sellers, since this affects where value is counted. We relied on public statistics and reference series such as Statistik Austria releases, European Commission and Eurostat digital economy indicators, Austrian National Bank payments related publications, and customs and trade releases where relevant for import intensive categories.
To keep the assumptions practical, we also reviewed company filings and investor presentations for leading retailers and logistics operators, plus reputable press coverage and association pages such as Austria retail and eCommerce bodies (used as directional checks, not as the model itself). Where available, we supplemented with paid subscriptions used for company financials and intelligence, news and financials, and shipment level import export signals, mainly to validate growth inflections and category mix shifts. These sources are not exhaustive, and many other public and paid references were used for data collection, cross checks, and clarification.
Primary Interviews and Surveys
Primary work focused on interviews and structured surveys with online retailers, marketplace operators, payment and fraud stakeholders, last mile and parcel experts, and category focused distributors, so that the demand pool could be checked from more than one angle. We covered viewpoints across Austria, and we also spoke with cross border sellers and service partners that ship into Austria, which helped validate how much of the spend is imported versus retained locally.
Distribution of primary research fieldwork respondents
| Company type | Respondent position | Region |
|---|---|---|
| Top tier: 26% | CXOs: 14% | APAC: 49% |
| Mid tier: 57% | Functional/Unit leaders: 41% | EMEA: 30% |
| Smaller Players: 17% | Managers: 45% | Americas: 21% |
Market-Sizing & Forecasting
We started with a top down build that reconstructs Austria online spend using digital commerce penetration, category level online share trends, cross border purchase intensity, and the split between physical goods fulfillment and digital delivery. Once the first cut was ready, it was corroborated with selective bottom up approximations such as sampled gross merchandise value per major category, channel checks on basket size and order frequency, and revenue roll ups for a limited set of observable sellers, which then helped adjust totals where gaps appeared.
Inputs were kept tied to signals that can be repeatedly tracked, including internet and online shopper penetration, share of online shopping within retail spend, parcel volume and delivery mix, returns intensity for apparel heavy baskets, and payment method preference shifts that influence conversion. For forecasting, we used scenario analysis anchored to expected changes in consumer confidence, inflation, and logistics cost pass through, and then aligned the scenarios to the consensus range heard in interviews. When bottom up visibility was incomplete for smaller sellers, the missing value was filled using category density assumptions and then rechecked against total spend and parcel intensity so the model stayed realistic.
Data Validation & Update Cycle
Outputs are validated through several passes, where category totals are compared against independent signals like retail spend shares, parcel activity direction, and cross border share commentary from industry participants. Outliers are investigated, assumptions are revisited, and follow up calls are triggered when the variance cannot be explained by seasonality or one off events.
Each report goes through analyst reviews before sign off, with checks on currency consistency, year alignment, and growth math. Reports are refreshed annually, and interim updates are made when major events materially shift demand or pricing. Before delivery, a final refresh pass is completed so clients receive the latest updated view.
Mordor Intelligence's Austria Ecommerce Market Size Versus Other Published Estimates
Published market values for Austria e-commerce can differ even when they look similar at first glance, because the definition of what counts as e-commerce is not consistent across sources. The year window used, whether the number is GMV or retailer revenue, and how cross border orders are treated are usually the biggest reasons for the spread.
Ticketing and pure digital streaming subscriptions sit outside Mordor Intelligence's scope, and that one exclusion alone can move totals versus estimates that fold in broader online services. Differences also come from whether click and collect is counted, whether the figure is a rolling 12 month spend versus a calendar year, and whether currency conversion is done using average year rates or a point in time rate.
Benchmark comparison
| Source | Market Size | Gaps in Research Methodology |
|---|---|---|
| Mordor Intelligence | USD 14.27 B (2026) | |
| Government Trade Brief A | USD 13.50 B (2025) | Uses a rolling May to April expenditure window and is presented as total online retail spend, with limited clarity on GMV versus seller revenue treatment and cross border allocation. |
| Industry Data Portal B | USD 13.00 B (2025) | Reports e-commerce revenue for a single year with lighter disclosure on inclusions like services and on how marketplace take rates and taxes are handled versus full GMV. |
The comparison shows that most gaps come from what is counted as e-commerce and how the time period is defined, rather than from simple math differences. By keeping the model tied to observable demand signals and clearly stated inclusions, the resulting market size stays easier to interpret and to update year after year.


Key Questions Answered in the Report
What is the current size of the Austria E-commerce market?
The Austria E-commerce market is worth USD 14.27 billion in 2026 and is set to grow steadily at a 6.06% CAGR toward 2031.
Which segment is expanding the fastest?
B2B digital procurement is the fastest, advancing at a 9.02% CAGR as Austrian firms automate purchasing workflows.
How important is mobile shopping in Austria?
Smartphones already account for 58.45% of Austria E-commerce market share and lead growth with an 8.34% CAGR, underscoring a decisive mobile-first shift.
Why is BNPL so popular among Austrian consumers?
BNPL offers flexible instalments that resonate with Gen-Z shoppers, driving a 9.63% CAGR and boosting cart conversions for higher-ticket items.
What challenges do smaller Austrian e-retailers face?
They grapple with rising packaging-compliance costs and scarce Vienna warehouse capacity, both of which inflate operating expenses and lengthen delivery times.
How will rural broadband upgrades influence future growth?
Gigabit roll-outs under Broadband Austria 2030 will connect 200,000 additional households, enlarging the customer base and enabling bandwidth-intensive shopping experiences outside urban cores.
Page last updated on:






