
Australia Wearables Market Size and Share
Market Overview
| Study Period | 2020 - 2031 |
|---|---|
| Forecast Data Period | 2026 - 2031 |
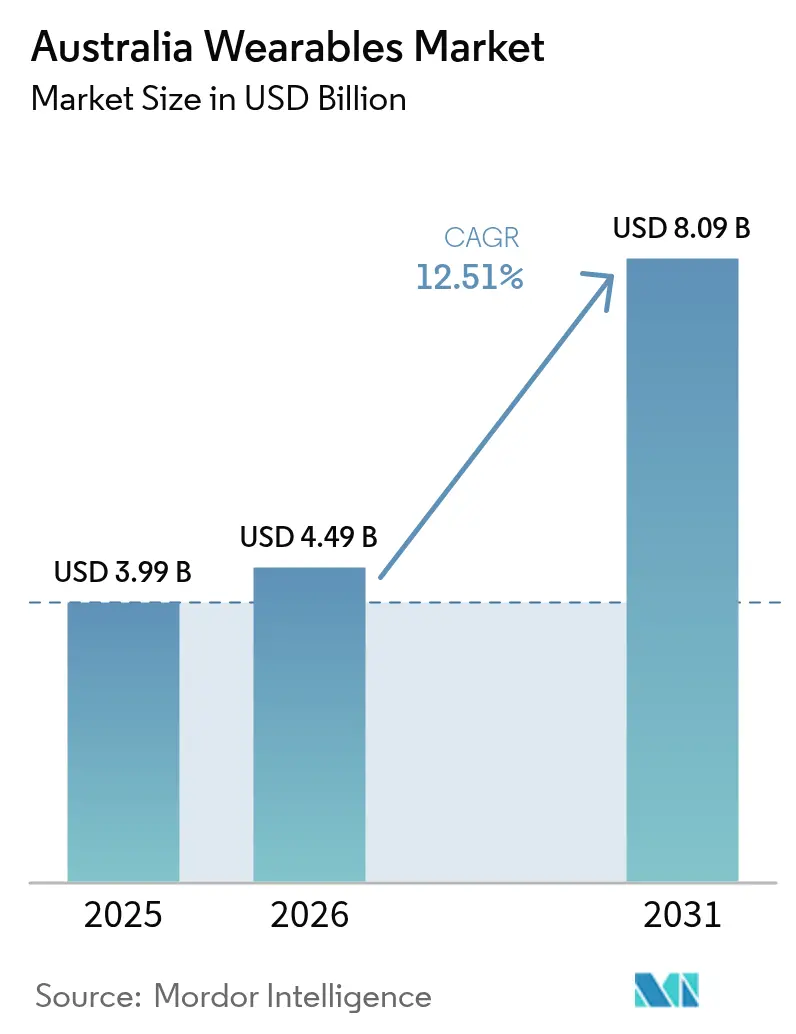
| Base Year Market Size (2025) | USD 3.99 Billion |
| Market Size (2026) | USD 4.49 Billion |
| Market Size (2031) | USD 8.09 Billion |
| Growth Rate (2026 - 2031) | 12.51% CAGR |
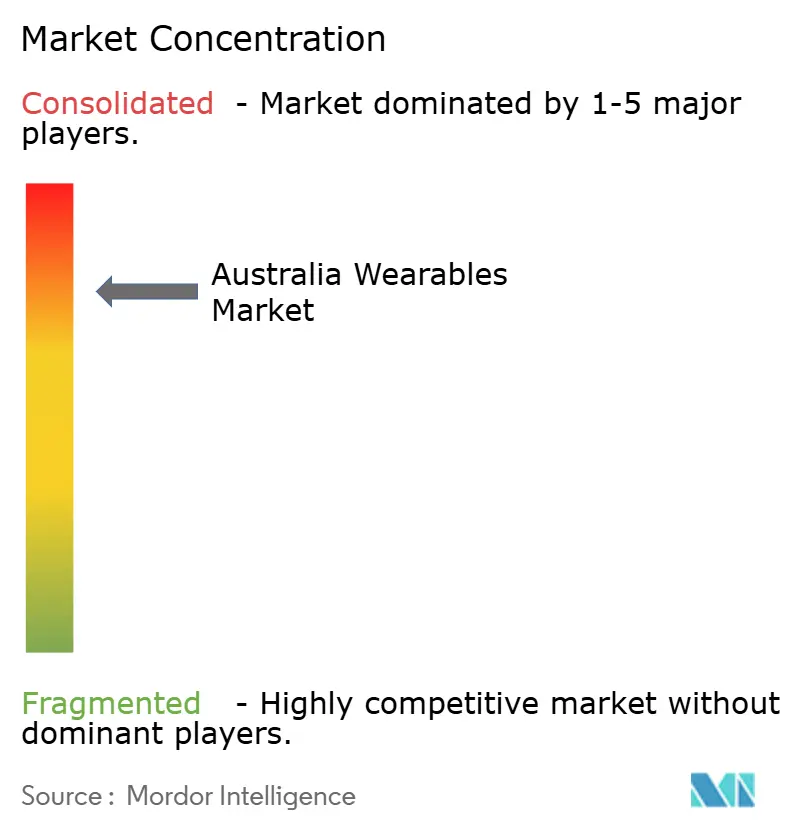
| Market Concentration | High |
Major Players *Disclaimer: Major Players sorted in no particular order Image © Mordor Intelligence. Reuse requires attribution under CC BY 4.0. | |
Australia Wearables Market Analysis by Mordor Intelligence
Australia wearables market size in 2026 is estimated at USD 4.49 billion, growing from 2025 value of USD 3.99 billion with 2031 projections showing USD 8.09 billion, growing at 12.51% CAGR over 2026-2031. Purchases by adults keep shipment volumes steady, while rapid uptake among elderly users signals growing confidence in continuous remote health monitoring.[1]Australian Government Department of Health, “What we’re doing about health technologies and digital health,” health.gov.au Smartwatches account for most discretionary spending, yet ear-worn devices register the fastest unit gains as audio products add biosensing and fatigue-alert features. Bluetooth-only wearables still lead sales, but cellular-enabled models multiply as carriers widen eSIM support and boost 5G coverage. Online storefronts provide nationwide reach, and instalment plans help premium devices priced above AUD 600 expand ahead of the wider Australia wearables market. National Digital Health Strategy programs, upcoming spectrum reforms, and mining-sector safety mandates together create fresh enterprise demand for connected wearables.
Key Report Takeaways
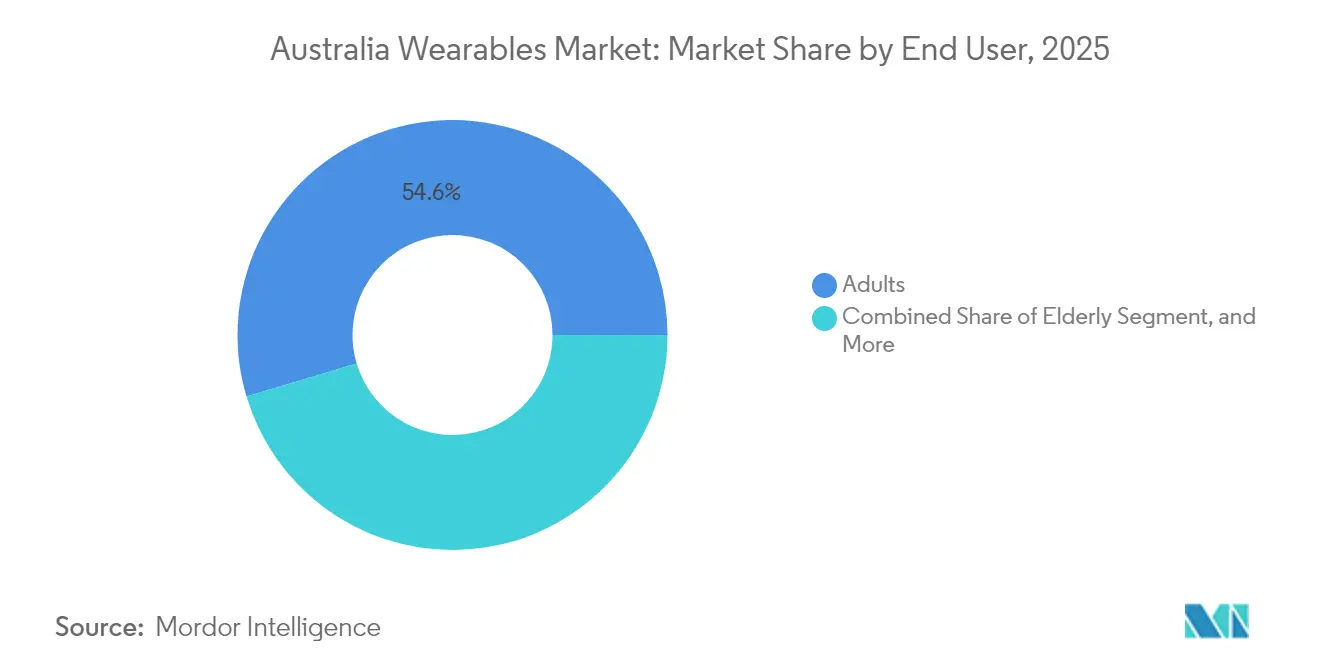
- By end user, adults held 54.62% of Australia wearables market share in 2025, while the elderly segment is poised to grow at a 15.11% CAGR through 2031.
- By product category, smartwatches captured 62.55% of 2025 revenue; ear-worn devices are forecast to expand at a 15.98% CAGR to 2031.
- By technology, Bluetooth-only wearables accounted for 47.15% of 2025 sales, whereas cellular-enabled devices are set to rise at a 15.63% CAGR across the same horizon.
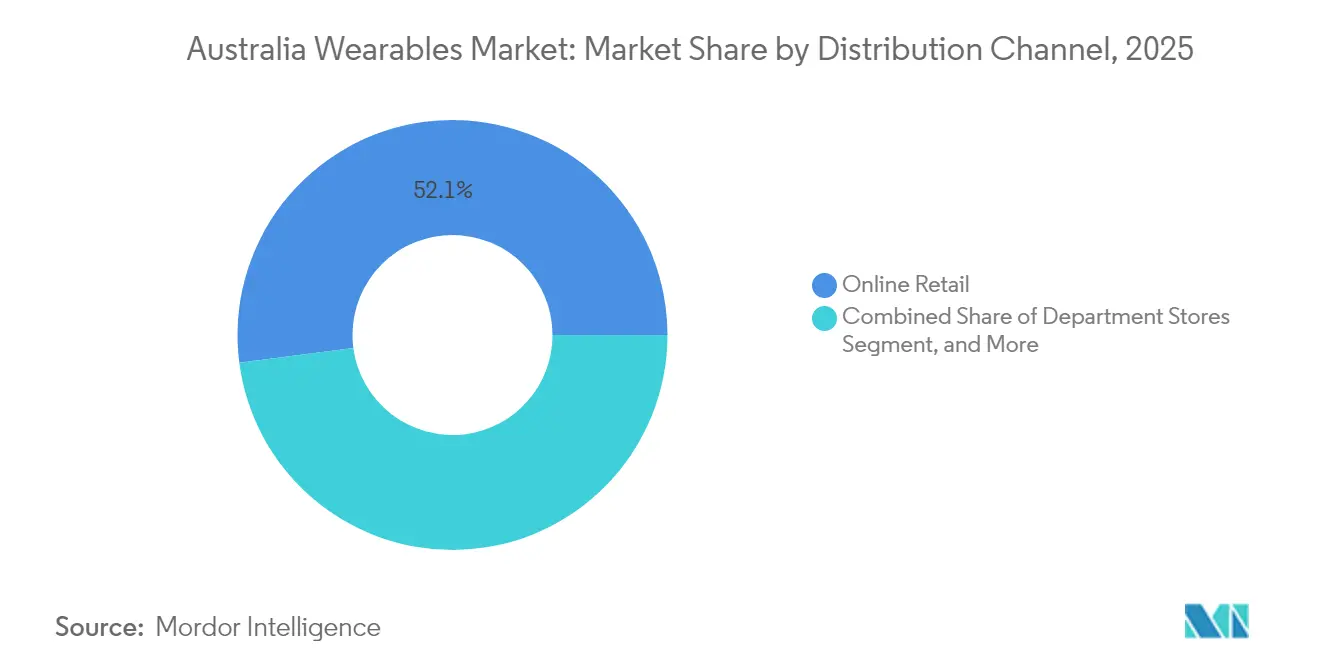
- By distribution channel, online retail secured 52.06% of 2025 value and is expected to climb at a 16.44% CAGR through 2031.
Note: Market size and forecast figures in this report are generated using Mordor Intelligence’s proprietary estimation framework, updated with the latest available data and insights as of 2026.
Australia Wearables Market Trends and Insights
Drivers Impact Analysis*
| Driver | (~) % Impact on CAGR Forecast | Geographic Relevance | Impact Timeline |
|---|---|---|---|
| Rising adoption of smartwatches for health and fitness monitoring | +3.20% | National, with higher penetration in urban centers | Medium term (2-4 years) |
| Increasing health awareness and chronic disease management initiatives | +2.80% | National, with emphasis on rural and Indigenous communities | Long term (≥ 4 years) |
| Integration of cellular connectivity enabling stand-alone use | +2.10% | National, dependent on carrier network expansion | Short term (≤ 2 years) |
| Growing consumer propensity towards premium consumer electronics | +1.90% | Urban centers, particularly Sydney, Melbourne, Brisbane | Medium term (2-4 years) |
| Government incentives for remote patient monitoring pilots in rural Australia | +1.50% | Rural and remote areas, Northern Territory, Western Australia | Long term (≥ 4 years) |
| Wearable integration with workers' compensation IoT safety programs in mining sector | +1.20% | Western Australia, Queensland mining regions | Medium term (2-4 years) |
| Source: Mordor Intelligence | |||
Rising adoption of smartwatches for health and fitness monitoring
Australian buyers increasingly treat smartwatches as preventive health tools rather than casual trackers. ECG, blood oxygen, and sleep metrics align with policy moves that broaden Medicare coverage for chronic care visits from July 2025. Samsung’s Galaxy Ring entry in October 2024 highlights the willingness to pay for premium wellness devices.[2]ChannelLife Australia, “Samsung introduces Galaxy Ring to Australia for wellness tracking,” channellife.com.au Polar’s global user data shows Australians log the world’s earliest average bedtime, pointing to strong engagement with sleep features. Therapeutic Goods Administration rules now weigh marketing claims more heavily than hardware specs when assigning medical-device classes, so vendors calibrate product positioning carefully. This environment positions smartwatches as gateways to a connected health ecosystem that plugs into My Health Record.
Increasing health awareness and chronic disease management initiatives
Two-thirds of Australia’s disease burden stems from chronic conditions. Programs such as Deadly Choices encourage annual health checks among Aboriginal and Torres Strait Islander peoples, opening demand for culturally sensitive monitoring wearables. Revised Medicare items expand the number of reimbursable follow-up sessions from 5 to 10, making long-term data capture financially viable. Advocacy by the Medical Technology Association of Australia underscores how wearables improve care coordination when linked to the national My Health Record. These changes let consumer devices migrate toward clinical use in both urban and remote settings. As a result, the Australia wearables market sees stronger engagement from healthcare providers and insurers that previously stayed on the sidelines.
Integration of cellular connectivity enabling stand-alone use
Telstra Wholesale’s eSIM Companion Plan lets MVNOs offer shared-number smartwatch service without complex activation, making Australia one of the first prepaid companion markets worldwide. Vodafone’s NumberSync option delivers a similar model for postpaid customers, while Telstra’s 5G roadmap prioritizes edge computing that supports real-time bio signal streams.[3]Telstra, “Smart Watches, Fitness Trackers & Wearables,” telstra.com.au ACMA consultations on 6 GHz band rules influence certification timelines for low-power devices aimed at dense urban coverage. Independent cellular operation frees wearables from smartphone tethers, broadening use in mining, aged-care emergency alerts, and sports coaching.
Growing consumer propensity toward premium electronics
Australians accept higher ticket prices when devices bundle advanced sensors, metal casings, and multi-year software support. Apple Watch Ultra lists at AUD 1,399 (USD 895.36), while Samsung Galaxy Watch Ultra is AUD 1,299 (USD 831.36), yet both move briskly through carrier channels, offering 24-month zero-interest plans. MePACS Solo Connect, priced near AUD 800 (USD 512) plus monthly monitoring fees, shows strong adoption among elderly users who value professional oversight.[4]MePACS, “MePACS Solo Connect vs. Smartwatch,” mepacs.com.au High disposable income and tech literacy underpin double-digit expansion in the premium tier of the Australian wearables market, even as mid-range models dominate unit volumes. Vendors, therefore, roll out titanium builds, longer battery life, and AI coaching to justify price premiums.
Restraints Impact Analysis*
| Restraint | (~) % Impact on CAGR Forecast | Geographic Relevance | Impact Timeline |
|---|---|---|---|
| Data privacy and cybersecurity concerns | -2.30% | National, with heightened sensitivity in government and healthcare sectors | Short term (≤ 2 years) |
| High average selling price for premium devices | -1.80% | National, with greater impact in regional and lower-income demographics | Medium term (2-4 years) |
| Fragmented regulatory pathway for medical-grade wearables | -1.20% | National, affecting clinical and enterprise adoption | Long term (≥ 4 years) |
| Battery recycling constraints due to e-waste regulations | -0.90% | National, with stricter enforcement in urban areas | Medium term (2-4 years) |
| Source: Mordor Intelligence | |||
Data privacy and cybersecurity concerns
The Australian Sports Commission warns that most wearables store data offshore, leaving users with fewer legal remedies than peers in the EU or California. The eSafety Commissioner cites GPS trackers in coercive-control cases, raising public awareness of misuse risks. Policy proposals to update the Privacy Act would allow higher penalties and shorter breach-notification windows, increasing compliance costs for vendors. Enterprises integrating wearables into electronic medical records must also obey My Health Record data-sovereignty rules, complicating deployment.
High average selling price for premium devices
Mid-range models dominate volumes, yet rapid feature creep keeps flagship prices beyond reach for many households. While carriers promote 24-month zero-interest plans, prepaid users and consumers with thin credit files lack similar options. Ongoing connectivity fees for shared-number services stack onto hardware costs. Inflationary pressures reduce discretionary budgets outside capital cities, dampening replacement cycles and slowing premium uptake in regional towns.
*Our forecasts treat driver/restraint impacts as directional, not additive. The impact forecasts reflect baseline growth, mix effects, and variable interactions.
Segment Analysis
By End User: Adult volumes dominate while elderly growth accelerates
Adults generated 54.62% of 2025 shipments within the Australia wearables market. Purchasing power, gym memberships, and workplace productivity features drive their adoption. Brands place lifestyle apps, contactless payments, and messaging at the center of value propositions. Elderly users adopt monitored alarm watches and fall-detection pendants, propelling a 15.11% CAGR through 2031. Funding via Medicare Chronic Disease Management plans supports monthly service fees. Kid-focused GPS watches and safety bracelets gain traction, but privacy rules and school policies cap growth. The babies segment remains niche, limited to sleep-temperature sensors and vitals patches used in neonatal care at home.
Elderly uptake benefits from MePACS Solo Connect and similar devices that blend professional monitoring with familiar watch form factors. Regional health networks pilot remote vitals capture to reduce hospital readmissions after bypass surgery. Adult demand, though mature, diversifies into professional applications such as fatigue tracking for shift workers in logistics. Wearables designed for kids emphasize geofencing and restricted call lists, appealing to parents who delay smartphone purchases. Overall segment dynamics illustrate how targeted features and reimbursement programs steer expansion beyond fitness enthusiasts, broadening the Australia wearables market.


By Product: Smartwatches dominate while ear-worn devices surge
Smartwatches delivered 62.55% of 2025 revenue, reflecting their role as daily companions that bundle payments, notifications, and multi-sensor health metrics. Flagships like Apple Watch and Samsung Galaxy Watch integrate ECG and fall alerts, securing a central position in households invested in branded ecosystems. Ear-worn devices record the fastest growth at a 15.98% CAGR as true wireless stereo adds heart rate and temperature sensing. Fitness trackers maintain relevance among runners who prioritize battery life. Head-mounted displays remain small yet attract interest for remote field support in mining and maintenance. Other emerging products include smart rings that promise continuous yet unobtrusive data capture.
Samsung’s Galaxy Ring debuts in 2024 underlines the broadening scope of other wearables, while ear-worn products such as Nuheara’s IQ buds cater to hearing support in loud industrial settings. Smartwatches remain the gateway to premium subscriptions such as Apple Fitness+. Fitness trackers from Garmin and Polar sustain endurance-sports niches. Head-mounted displays face social-acceptance hurdles but find footholds in industrial training. Product-mix shifts clarify the plurality of form factors that serve discrete needs, preserving the leadership of smartwatches yet allowing double-digit gains for newer categories within the Australia wearables market.
By Technology: Bluetooth leads while cellular connectivity accelerates
Bluetooth-only devices held 47.15% of 2025 shipments, balancing cost and power efficiency for tethered use. Cellular-enabled wearables post a 15.63% CAGR as eSIM onboarding simplifies activation, and shared-data plans cut friction. RFID/NFC modules appear in rings and wristbands for contactless fare payments. Ultra-wideband chips arrive in flagship phones and watches to support precision finding and spatial unlocks, though total volume remains low. Hybrid radios combine Bluetooth and LTE Cat-M to extend battery life in remote monitoring scenarios.
Telstra Wholesale’s companion eSIM offering unlocks prepaid cellular service for MVNOs, expanding potential users by millions. Vodafone’s NumberSync limits international roaming but lowers domestic voice latency. Ultra-wideband adoption benefits from FiRa v2.0 certification advances that promise interoperable indoor positioning. Bluetooth LE Audio updates improve bandwidth for hearing-aid compatibility. Technology trends reveal a migration from single-function radios to multi-protocol stacks that support seamless handoffs, reshaping the Australia wearables market.
By Distribution Channel: Online retail dominates and accelerates
Online outlets captured 52.06% of the 2025 value, aided by comparison tools, influencer reviews, and direct-to-consumer launches. Samsung released the Galaxy Ring exclusively through its website and brand stores, underscoring web channels’ primacy. Consumer electronics chains retain value for in-person demos and extended warranty bundles. Sports and fitness stores cater to niche triathlete communities with Garmin and Suunto ranges. Department stores cede share to specialty outlets but stay relevant during peak gifting seasons.
Carrier webstores and apps let buyers pair hardware with plans in minutes, while click-and-collect bridges digital discovery and physical pickup. Offline stores remain crucial for elderly shoppers seeking setup help. Omnichannel tactics such as virtual chat support and extended trial periods increase conversion. The growing sophistication of online merchandising amplifies uptake of premium SKUs, reinforcing digital dominance across the Australia wearables market.
By Price Range: Mid-range leads while premium surges
Mid-range devices between AUD 200 (USD 128) and 600 (USD 384) delivered 45.78% of 2025 turnover by balancing robust feature sets with affordability. Premium models above AUD 600 show the fastest expansion at a 14.93% CAGR, driven by titanium casings, sapphire lenses, and AI analytics. Entry devices under AUD 200 (USD 128) attract first-time buyers yet face spec creep that erodes differentiation. Trade-in schemes enable step-ups to higher tiers as past flagships gain residual value.
Interest-free plans spread the cost over 24 months, aligning the monthly outlay with telco bills. Mid-range velocity stems from annual refresh cycles by Xiaomi, Realme, and OPPO that flood channels with incremental upgrades. Budget watches from Amazfit include SpO2 and GPS at price points unimaginable three years ago. The price ladder shows widening gaps that let brands segment messaging and protect margins within the Australia wearables market.
Geography Analysis
Metropolitan hubs such as Sydney, Melbourne, and Brisbane anchor early adoption because high disposable incomes and dense 5G coverage favour premium connected devices. Urban dwellers readily embrace shared-number services and mobile payments that elevate the everyday utility of wearables. Government offices and corporate campuses in Canberra also see demand for security-credential wearables used for building access. In these cities, online flash sales and same-day delivery heighten buyer expectations for quick upgrades.
Regional centers across Western Australia and Queensland illustrate how industry requirements shape usage. Mining operations near Pilbara and Bowen Basin deploy a fatigue-monitoring headset networked through private 5G to reduce incident rates. State-run safety regulators encourage IoT pilots, and vendors tailor rugged housings that withstand dust and vibration. Along the East Coast farming belts, drought-monitor studies deploy wrist-worn temperature sensors on workers who spend long hours outdoors. These deployments reinforce the utility of cellular-enabled wearables when smartphones remain impractical.
Remote communities in Northern Territory and far-north Queensland identify wearables as tools to bridge healthcare gaps. Deadly Choices health-promotion events distribute fitness trackers that sync to culturally adapted mobile apps. Satellite backhauls combined with low-power Bluetooth uploads lets clinics aggregate data despite patchy terrestrial coverage. Programs led by the Australian Digital Health Agency fund pilots that link vitals from elders to telehealth dashboards, lowering travel needs for specialist consults. The multifaceted geographic profile demonstrates how infrastructure, income, and occupational risks intersect to drive nuanced growth paths within the Australia wearables market.
Regulatory Landscape
Australia regulates wearables through multiple regimes depending on intended use and connectivity. Health-functional wearables may be regulated by the Therapeutic Goods Administration (TGA) as medical devices when claims relate to diagnosis, monitoring, prevention, or treatment. This can place products on the Australian Register of Therapeutic Goods (ARTG), with conformity assessment obligations for software-based medical devices (SaMD). In parallel, radio and electromagnetic compliance requirements apply under ACMA frameworks for connected products, while medical-device requirements for functional claims are tied to the TGA Essential Principles.
Cybersecurity compliance was tightened for consumer-grade connected wearables with the Cyber Security (Security Standards for Smart Devices) Rules 2025, commencing on 4 March 2026. The rules require baseline security standards and a statement of compliance for in-scope internet-connected devices such as smartwatches. For public-sector deployments, PSPF Direction 004-2025 introduced mandatory technology standards for Commonwealth entities in October 2025, increasing procurement and assurance requirements for vendors selling into government. In New Zealand, Medsafe maintains a separate medical-device framework under the Medicines Act 1981, with sponsor responsibility and notification to the WAND database, so regional launches still require distinct compliance pathways despite geographic proximity.
Competitive Landscape
Global leaders Apple, Samsung, and Fitbit maintain share through ecosystem loyalty, retail presence, and certified compliance with Australian spectrum and health regulations. Apple’s focus on heart-health features aligns with therapeutic-goods guidelines, easing clinician endorsements. Samsung differentiates through open-platform compatibility and early entry of new form factors such as the Galaxy Ring. Fitbit leverages cross-platform app support to retain Android and iOS users alike.
Garmin and Polar address endurance athletes by delivering multi-band GNSS and extensive battery life that fitness trackers in the mass market lack. Nuheara stands out as a homegrown ear-wear startup supplying hearing-augmentation earbuds that meet Australian communication-equipment directives. SmartCap partners with Telstra to furnish mining companies with fatigue analytics, weaving enterprise services into its hardware proposition.
Competitive intensity rises as newcomers introduce neural-interface bands, smart rings, and UWB tags. Wearable Devices Ltd. works with Qualcomm to bundle Mudra gesture bands with AR glasses, showing convergence with the spatial-computing stack. Oura’s USD 75 million injection from Dexcom signals movement toward metabolic insights integrated into mainstream wellness devices. The fragmented clinical grade subsegment leaves room for niche specialists, yet larger brands possess scale and legal resources needed to navigate Therapeutic Goods Administration paperwork. Overall, top players command around 45% of industry revenue, indicating a market concentration score of 6.
Australia Wearables Industry Leaders
Huawei Technologies Co. Ltd
Apple Inc.
Samsung Electronics Co. Ltd
Nuheara Limited
OPPO Guangdong Mobile Telecommunications Corp., Ltd.
- *Disclaimer: Major Players sorted in no particular order

Market Opportunities and Future Outlook
Australia's medical-device pathway continues to define routes for wearables used in clinical contexts. The TGA framework for wearable medical devices and SaMD establishes a defined route for products that support diagnosis and monitoring, and a Unique Device Identification (UDI) labeling requirement for most medical devices begins 1 July 2026 to improve traceability and post-market management.
Remote-care funding and digital health programs are creating demand signals for field-ready biosensing and data infrastructure, including an AUD 75 million initiative to trial wearable health devices and point-of-care blood analysis in remote Northern Territory communities. These trials are aligned with My Health Record data integration. Carrier-enabled connectivity with eSIM companions through programs with Telstra Wholesale and Vodafone NumberSync supports standalone cellular wearables for mining safety, aged-care alerts, and sports coaching. A cybersecurity push, via the Cyber Security Rules 2025 (effective 4 March 2026) and PSPF Direction 004-2025, is also pushing secure-by-design requirements for institutional procurement.
Recent Industry Developments
- July 2026: Amazfit launched a dedicated Australian online storefront, bringing new wearables such as the Active 3 Premium smartwatch and the Helio Strap to local buyers. This expands direct-to-consumer distribution and gives Amazfit tighter control over pricing, bundles, and after-sales support in a market where online retail dominates device purchases.
- May 2026: OPPO released the Watch X3 in Australia, positioning a titanium-bodied Wear OS smartwatch with a large OLED display and a multi-day battery claim. The launch adds competitive pressure in the premium smartwatch tier and broadens consumer choice beyond the incumbent ecosystems in carrier and electronics channels.
- March 2026: The Cyber Security (Security Standards for Smart Devices) Rules 2025 commenced on 4 March 2026, requiring baseline security standards and a statement of compliance for in-scope internet-connected devices such as smartwatches. This raises vendor accountability and procurement scrutiny for Australian wearables.


Research Methodology Framework and Report Scope
Market Definition and Coverage
For this methodology, the market covers revenue generated from wearable devices sold and used in Australia, where the device is designed to be worn on the body and provides connected, sensor-led, or computing functions for the user.
Scope exclusions: We exclude non-wearable consumer electronics that are not designed to be worn (such as phones and tablets) and also exclude stand-alone accessories that do not operate as wearable devices.
Segmentation Overview
- By End User
- Babies
- Kids
- Adults
- Elderly
- By Product
- Smartwatches
- Head Mounted Displays
- Ear Worn
- Fitness Trackers/Activity Trackers
- Other Wearables
- By Technology
- Bluetooth-only
- Cellular-enabled (4G/5G)
- RFID/NFC-enabled Wearables
- Ultra-Wideband Wearables
- Other Technologies
- By Distribution Channel
- Online Retail
- Consumer Electronics Stores
- Sports and Fitness Stores
- Department Stores
- Other Offline Channels
- By Price Range
- Low-end (Less than AUD 600)
- Mid-range (AUD 200 - 600)
- Premium (More Than AUD 200)
Data Sources, Market Sizing, and Validation
Desk Research
Desk work started by pinning down the Australia device market boundary and the value chain, before we moved into sizing inputs. We relied on public sources such as the Australian Bureau of Statistics for household spend and trade patterns, the Australian Communications and Media Authority for connected-device context, and the Australian Competition and Consumer Commission for consumer market signals that can affect demand.
To ground product and health use-cases, we reviewed materials such as Therapeutic Goods Administration guidance and public health releases where they relate to wearable health monitoring claims, plus peer-reviewed literature on wearable adoption and accuracy in common use settings. Company annual reports, investor presentations, and reputable press were used to cross-check launch timing, pricing direction, and distribution moves. We also used paid subscriptions for company financials and intelligence, plus patent and shipment-tracking databases where it helped validate product cycles and import flows. These are illustrative examples, and many other public and paid sources were also referenced for data collection, validation, and clarification.
Primary Interviews and Surveys
Primary work focused on confirming what is actually counted as a wearable sale in Australia and what should be treated as an adjacent device or accessory. We spoke with a mix of brand-side and channel-side respondents, plus informed industry participants who track consumer electronics demand, to test assumptions on pricing, replacement cycles, and the share of sales happening online versus offline across major states and metro areas.
Distribution of primary research fieldwork respondents
| Company type | Respondent position | Region |
|---|---|---|
| Top tier: 37% | CXOs: 17% | |
| Mid tier: 46% | Functional/Unit leaders: 26% | |
| Smaller Players: 17% | Managers: 57% |
Market-Sizing & Forecasting
Our sizing starts with a top-down approach where Australia consumer electronics demand indicators are reconstructed into an addressable wearables spend pool, and then filtered using device-type adoption and replacement patterns. After that, the totals are checked with selective bottom-up approximations, such as sampled average selling price ranges by product group, channel checks on unit momentum, and a reasonableness roll-up of visible supplier and retailer activity, which helps adjust any over or under count.
Key inputs used in the model include average selling price progression by device type, replacement cycle assumptions (which vary by smartwatch versus fitness band use), online share of electronics sales, the mix shift toward ear-worn and wrist-worn devices, and import and shipment direction as a demand proxy for hardware-heavy categories. Where direct unit data was missing, gaps were handled by using bounded ranges from interviews and then narrowing them using public trade signals and observed pricing bands.
Forecasting relied mainly on scenario analysis, since wearables demand can swing with new product cycles and consumer spending conditions. Scenarios were built around price band movement, refresh cadence, and health and fitness adoption intensity, and then normalized using expert consensus gathered during interviews so the final trajectory stays realistic for Australia.
Data Validation & Update Cycle
Validation is handled through repeated cross-checks between the model outputs and independent signals, such as implied units from trade direction, pricing consistency, and adoption stories confirmed by channel participants. Variances are flagged when a segment grows faster than what replacement timing and price movement would allow, and the underlying drivers are re-tested before internal sign-off.
The work is reviewed in steps, starting with input verification, followed by logic checks on assumptions, and then a final pass on totals and growth rates for outliers. Reports are refreshed annually, and interim updates are made when material events affect the market, such as major product launches, sharp currency movement impacting pricing, or step-changes in distribution. Before delivery, an analyst performs a fresh review so clients receive the latest updated view.
Mordor Intelligence's Australia Wearables Market Sizing Compared With Other Published Estimates
Published market sizes for wearables in Australia can differ quite a bit because the boundaries are not always aligned, and the same word can be used for different device baskets. The year used, how pricing is treated, and whether estimates reflect consumer-only demand or also include broader use cases can also create noticeable spreads.
By tracking device-type mix shifts, refreshing price bands and replacement-cycle assumptions, and then validating totals through channel checks, Mordor Intelligence keeps the 2025 value tied to in-scope wearable device revenue sold in Australia, rather than drifting into adjacent consumer electronics categories. A second driver is how some sources treat ear-worn devices and health-focused wearables, where inclusion rules and currency timing can move the total up or down even when underlying unit demand is similar.
Benchmark comparison
| Source | Market Size | Gaps in Research Methodology |
|---|---|---|
| Mordor Intelligence | USD 3.99 B (2025) | |
| Industry Portal A | USD 1.65 B (2025) | Often narrows scope closer to wrist-worn wearables and uses simplified pricing, which can undercount ear-worn categories and premium smartwatch mix in Australia. |
| Research Blog B | USD 1.07 B (2024) | Uses a different base year and typically frames the market as wearable electronics with limited device coverage, which can omit parts of the broader wearable device basket and apply different currency conversion timing. |
The table shows that scope definition and year alignment are the biggest practical reasons for the spread, followed by how average selling prices are carried forward. When device coverage, pricing bands, and replacement timing are made explicit and then re-checked with channel feedback, the final number becomes easier to trace and repeat.


Key Questions Answered in the Report
What is the projected value of the Australia wearables market in 2031?
The market is expected to reach USD 8.09 billion by 2031, growing at a 12.51% CAGR.
Which product category currently leads sales?
Smartwatches capture 62.55% of 2025 revenue, making them the leading category.
Which end-user group is expanding the fastest?
The elderly segment is projected to grow at a 15.11% CAGR through 2031.
How important is online retail to device distribution?
Online channels already hold 52.06% of 2025 value and are forecast to rise at a 16.44% CAGR.
What technology is gaining traction beyond Bluetooth?
Cellular-enabled wearables are set to expand at a 15.63% CAGR, driven by eSIM plans and 5G coverage.
Why are privacy concerns considered a restraint?
Heightened scrutiny over offshore data storage and new privacy-act reforms increase compliance costs and can slow enterprise rollouts.
Page last updated on:






