
Market Overview
| Study Period | 2019 - 2031 |
|---|---|
| Forecast Data Period | 2026 - 2031 |
| Historical Data Period | 2019 - 2024 |
| Market Size (2026) | USD 49.86 Billion |
| Market Size (2031) | USD 81.32 Billion |
| Growth Rate (2026 - 2031) | 10.28 % |
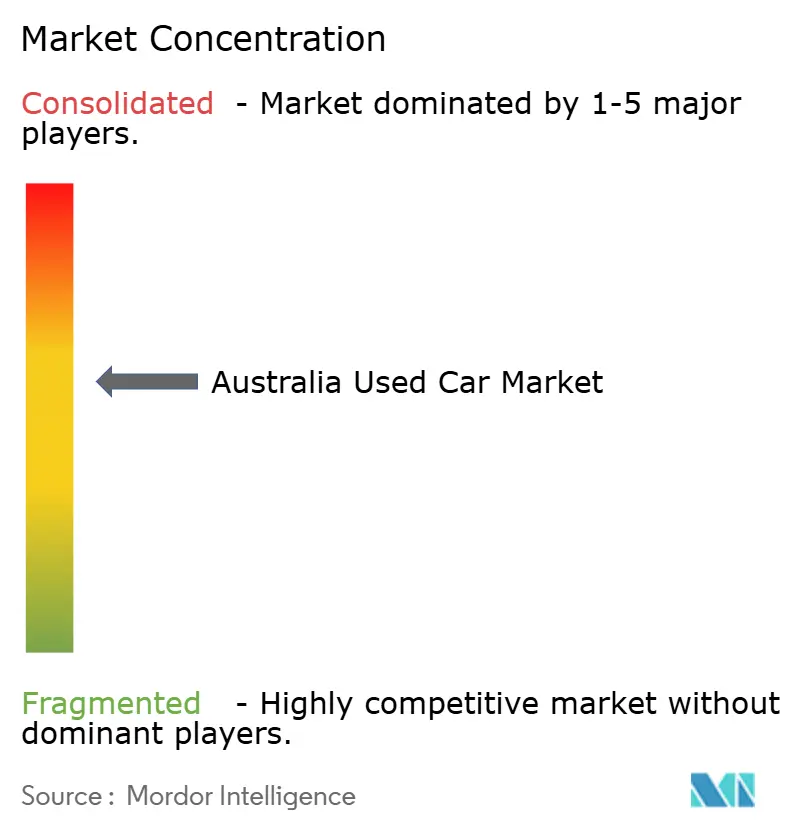
| Market Concentration | Medium |
Major Players *Disclaimer: Major Players sorted in no particular order Image © Mordor Intelligence. Reuse requires attribution under CC BY 4.0. | |
Australia Used Car Market Analysis by Mordor Intelligence
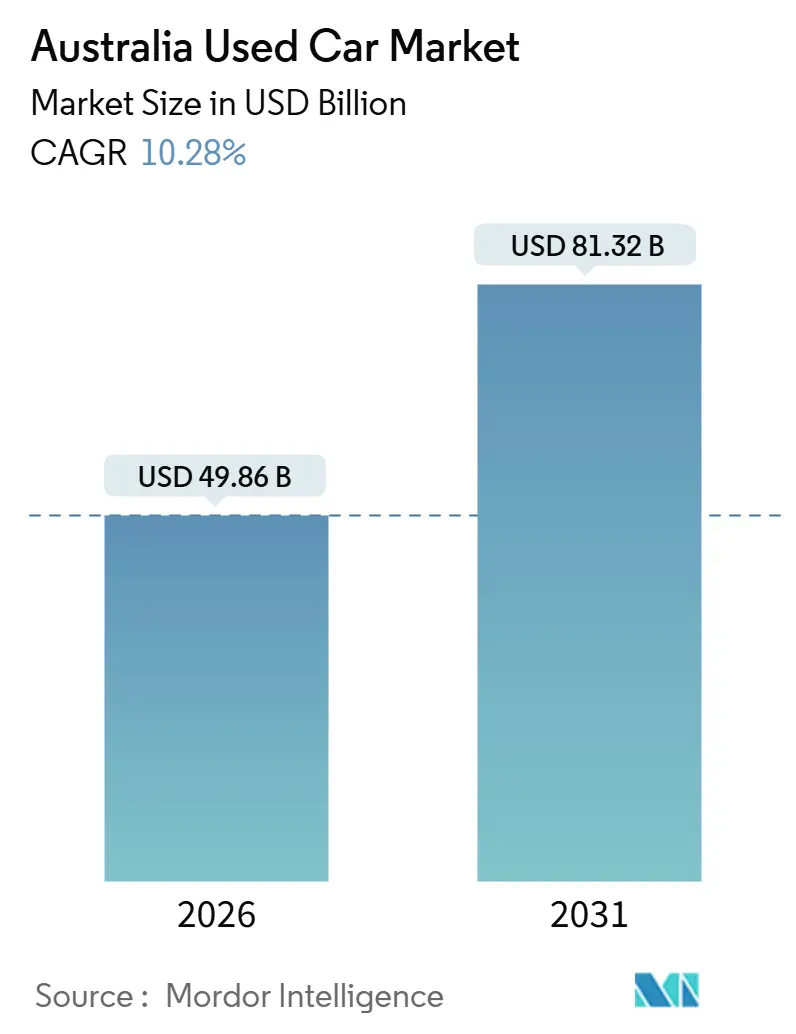
The Australian used car market size stood at USD 49.86 billion in 2026 and is projected to reach USD 81.32 billion by 2031, reflecting a robust 10.28% CAGR during the forecast window. Rising household migration into outer suburbs, the rapid rollout of certified pre-owned (CPO) programs, and the growing use of algorithm-driven online platforms are collectively increasing transaction velocity and compressing traditional negotiation cycles. Organized vendors are scaling omnichannel storefronts, allowing buyers to secure finance pre-approval and schedule test drives within a single digital journey. Meanwhile, semi-organized independents utilize low-overhead web listings and flexible trade-in terms to close price-sensitive deals. Petrol cars still account for the majority of overall volumes. Still, the current generation of battery-electric vehicles (BEVs) and hybrids is unlocking a new low-emission pool that will enter the secondary market within three to five years. Meanwhile, tightening emissions rules, elevated interstate freight charges, and growing consumer scrutiny of vehicle histories reinforce the premium that verified inventory commands at branded dealerships.
Key Report Takeaways
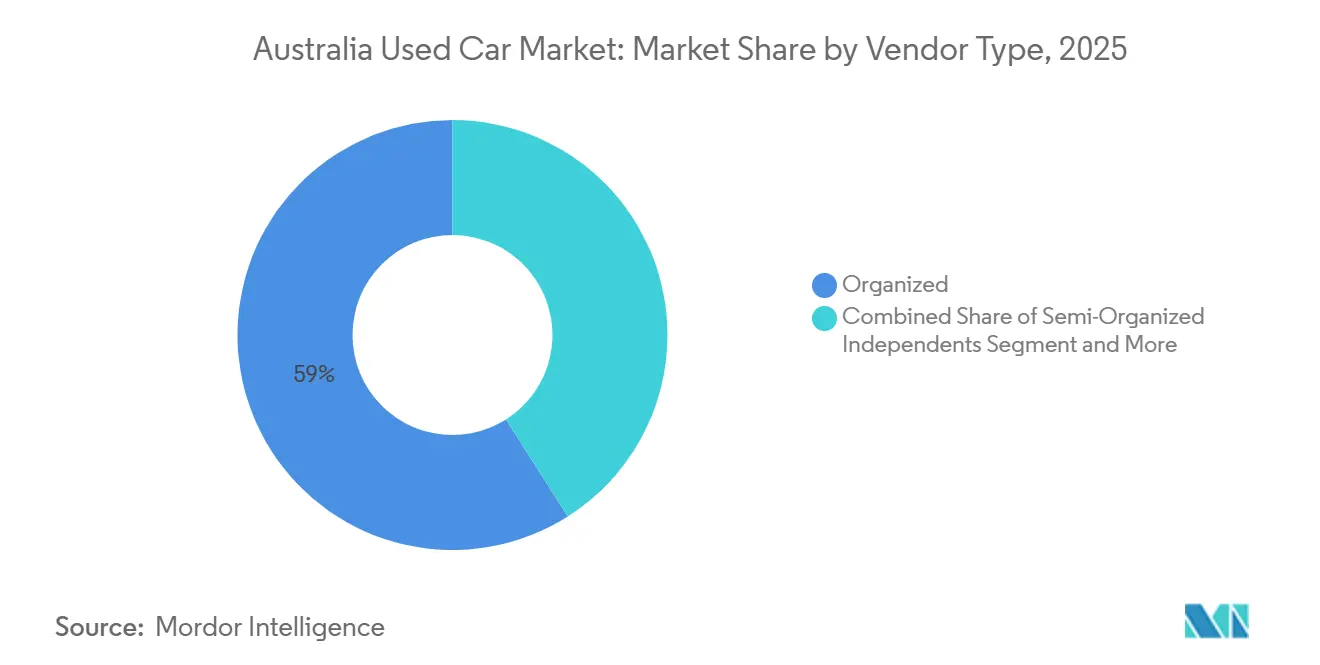
- By vendor type, organized players captured 59.03% of the Australian used car market share in 2025, whereas semi-organized independents are expected to expand at an 11.59% CAGR through 2031.
- By fuel type, petrol cars led with 65.12% of the Australia used car market share in 2025, while electric variants are on course to grow at a 19.12% CAGR to 2031.
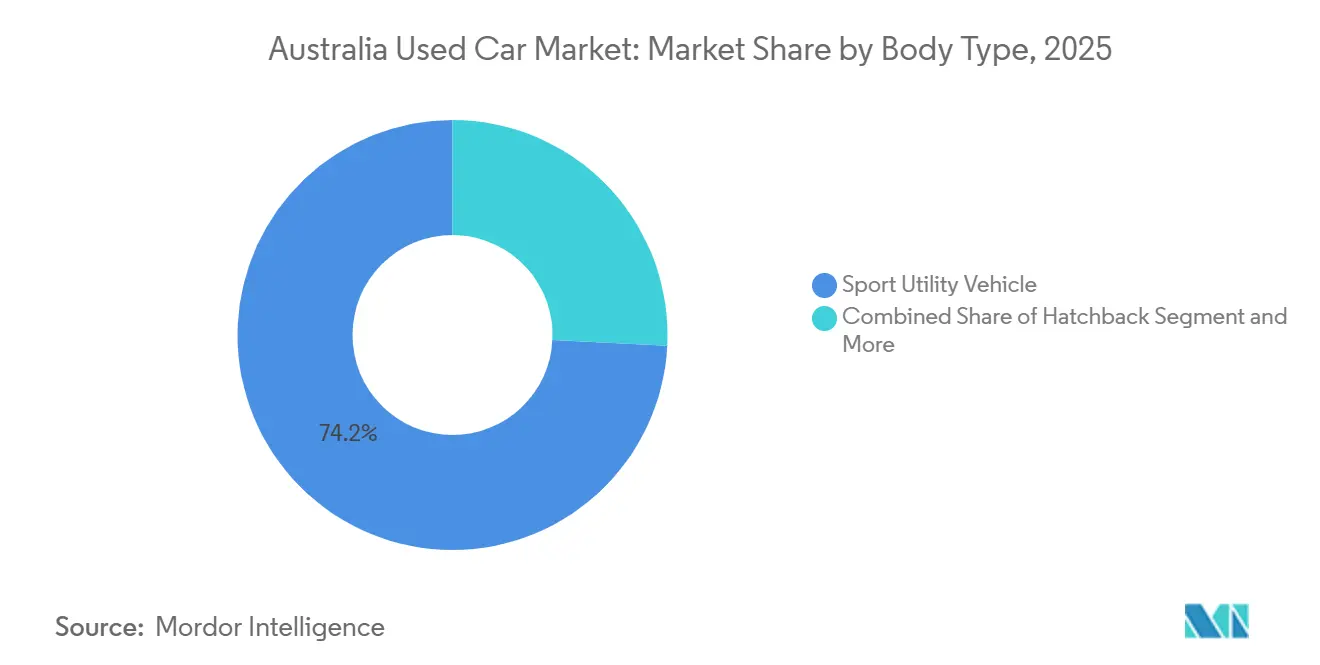
- By body type, sport utility vehicles dominated with 74.18% revenue share in 2025; multi-purpose vehicles and utes are forecast to advance at a 12.03% CAGR during 2026-2031.
- By sales channel, offline formats controlled 75.21% of transactions in 2025, yet online channels are the fastest-growing sub-segment at 14.35% CAGR to 2031.
- By region, New South Wales commanded 32.13% of the Australian used car market size in 2025, whereas Queensland is the quickest-expanding state at an 11.04% CAGR through 2031.
Note: Market size and forecast figures in this report are generated using Mordor Intelligence’s proprietary estimation framework, updated with the latest available data and insights as of January 2026.
Australia Used Car Market Trends and Insights
Drivers Impact Analysis*
| Driver | (~) % Impact on CAGR Forecast | Geographic Relevance | Impact Timeline |
|---|---|---|---|
| Online Aggregators Accelerate Metro Sales | +2.1% | NSW, VIC, QLD metro hubs | Short term (≤2 years) |
| State Incentives Enlarge BEV Supply | +2.0% | NSW, VIC, ACT | Medium term (2-4 years) |
| CPO Programs Boost Buyer Trust | +1.8% | NSW and VIC metro corridors | Medium term (2-4 years) |
| SUV Preference Fuels Replacement Demand | +1.5% | Nationwide, with QLD and WA hotspots | Long term (≥4 years) |
| Flexible Finance Attracts Millennial Buyers | +1.3% | Sydney, Melbourne, Brisbane | Medium term (2-4 years) |
| Fleet Renewals Feed Premium Inventory | +1.2% | NSW and VIC metros | Short term (≤2 years) |
| Source: Mordor Intelligence | |||
Surge in Online Aggregator Platforms Accelerating Transaction Volumes in Metro Areas
Digital marketplaces are streamlining the journey from car listing to handover, leveraging machine-learning valuations alongside integrated loan offers. Carsales, a prominent player, reported significant revenue for FY 2024 and facilitated a substantial number of trades through its web and app platforms. Gumtree Motors, another key player, attracts a large number of monthly visitors, generating extensive page views, and boasts an inventory supplied by numerous dealer partners across Australia. Australian Automotive Dealer Association (AADA) data show 1.59 million used-car listings in H1 2025, a notable surge above the prior-year period, while completed sales hit 1.13 million, underscoring the efficiency gains of algorithmic matching[1]. Cars24, a dedicated operator in the space, secured substantial funding in early 2024. They now offer a unique proposition: after a complimentary inspection, sellers receive their proceeds quickly, bypassing the traditional dealer intermediary. This digital convenience appeals to urban buyers under 35, who often finalize financing via their smartphones. However, drivers in regional areas still prioritize onsite inspections, as inconsistent connectivity and extended travel distances amplify their purchase concerns.
Government EV Incentives Driving Supply of Near-New Electric Used Cars
Expired purchase rebates still influence supply because 2021-2023 incentive cohorts are now hitting their first trade-in cycle. Federal DRIVEN funding of AUD 60 million (~USD 40.2 million) earmarked for dealer chargers lifts range confidence and lowers BEV stock days-to-sell [2]. In FY 2024-2025, transactions for used electric vehicles (EVs) experienced significant growth. However, listings grew at an even faster pace, creating increased price pressure. As the New Vehicle Efficiency Standard gradually lowers CO₂ targets over the coming years, the policy-driven shift is expected to intensify. This development is likely to drive a greater influx of hybrids and battery electric vehicles (BEVs) into both new-car showrooms and, subsequently, the secondary market.
Rising Penetration of Certified Pre-Owned Programs Enhancing Consumer Confidence
Franchise dealers treat CPO schemes as a margin-defense play because buyers trade price premiums for peace of mind. Hyundai Promise applies a 118-point inspection, a five-year age limit, and a 120,000-kilometer cap, then layers on a 12-month warranty extension. Toyota’s Certified Used Vehicle program matches those standards with several inspection points and a one-year warranty extension, reinforcing Toyota’s residual-value leadership. In the first half of 2025, organized dealers strengthened their presence in the Australian used car market. The impact is heightened by concentrated dealer networks in Sydney and Melbourne, which reduce search distances and lower travel costs for buyers. While independent lots are forming alliances for third-party inspections, risk-averse consumers still prioritize clear brand signals and warranty coverage.
Growing Preference for SUVs and Utes in Replacement Cycle Fuels Secondary Demand
SUVs surpassed passenger cars to become the most popular category for new vehicle sales. By mid-2025, SUVs dominated the market, reflecting a strong consumer preference. This growth ensures a consistent supply of late-model SUVs entering the used car market in the coming years, maintaining high demand and supporting their resale values. Meanwhile, popular ute models continued to perform well, although overall demand for utes showed signs of decline. Buyers are increasingly considering factors such as rising fuel costs and the availability of plug-in alternatives. For instance, newer plug-in models are gaining traction, indicating a shift in powertrain preferences, even in traditionally rural areas.
Restraints Impact Analysis*
| Restraint | (~) % Impact on CAGR Forecast | Geographic Relevance | Impact Timeline |
|---|---|---|---|
| Limited Certified Battery-Health Data | -1.2% | Nationwide, especially NSW and VIC metros | Medium term (2-4 years) |
| Odometer Rollback and Accident Damage | -0.9% | Highest in the semi-organized and private-party segments | Long term (≥4 years) |
| Vehicle Logistics Costs | -0.8% | NSW-WA and QLD-SA corridors | Medium term (2-4 years) |
| Emissions Standard Uncertainty | -0.6% | ACT and VIC policy hot spots | Short term (≤2 years) |
| Source: Mordor Intelligence | |||
Limited Availability of Battery Health Data Damps Confidence in Used EVs
In Australia, buyers are left to depend on informal range tests or proprietary diagnostics, as the country has not yet enacted uniform battery-state-of-health disclosures. This stands in contrast to the proposed protocols in the EU. The high cost of replacement packs can significantly alter the total-cost-of-ownership calculations for five-year-old battery electric vehicles (BEVs). While Tesla's transferable long-term guarantee alleviates some of these concerns, brands outside the premium segment do not offer similar reassurances. Without the establishment of federated standards, high-mileage BEVs will see their residual-value curves trailing behind those of hybrids and petrol cars. This trend is likely to stifle the full potential of electrification in Australia's used car market.
Persistent Transparency Concerns over Odometer Rollback and Accident Histories
New South Wales offers a free three-year odometer lookup, and South Australia enforces fines up to AUD 150,000 (USD 100,500) for tampering, but patchwork regulation still lets fraudulent cases slip through [3]. A national real-time registry comparable to Carfax in the United States remains a policy aspiration. Fraud spikes during supply squeezes, as happened in 2021-2022 when wholesale values soared. The absence of a single-source truth steers risk-averse buyers toward branded dealers and CPO lots, even if prices run significantly higher.
*Our forecasts treat driver/restraint impacts as directional, not additive. The impact forecasts reflect baseline growth, mix effects, and variable interactions.
Segment Analysis
By Vendor Type: Organized Consolidation Versus Independent Agility
Organized chains commanded 59.03% of the Australian used car market in 2025, with franchise dealers and large independents bundling CPO inspection, instant finance, and same-day settlement. Semi-organized independents register the fastest expansion, at an 11.59% CAGR by 2031, as they leverage low-cost, cloud-based dealer-management systems and partner with fintech lenders for rapid credit scoring. The organized cohort is pursuing acquisition-driven scale; Eagers sold 20% of easyauto123 to Mitsubishi Corporation in October 2025, reinforcing the thesis that global capital seeks high-yield, asset-light retail platforms. Private-party and sole-proprietor lots still dominate regional towns where personal relationships matter. Yet, the compliance burden of warranty law and history reporting is tilting the playing field in favor of branded networks.
In recent years, the organized segment of the Australian used car market has experienced significant growth, fueling expectations of ongoing consolidation. This expansion, combined with group purchasing power, has resulted in reduced reconditioning costs and prioritized access to auctions. In response, independent dealers are virtually pooling their inventories across various yards and leveraging premium listings on Carsales to enhance their professional image. While proposed federal regulations might soon require national vehicle-history disclosures, potentially bridging the assurance gap, buyers are still inclined to invest in the peace of mind offered by Certified Pre-Owned (CPO) banners.

By Fuel Type: Electric Momentum and Hybrid Resilience
Petrol vehicles retained 65.12% of total transactions in 2025, but electric units clocked a 19.12% CAGR by 2031, proving the fastest climb within the Australian used car market. Supply mechanics explain part of the surge: Three-year-old Teslas, MG4s, and Nissan Leafs from 2022 incentive cohorts are now entering trade-in lanes. Monthly sales remain lumpy because uncertainty about battery health deters risk-averse shoppers, yet listing volumes suggest a tipping point is near. Diesel units maintain relevance in rural and mining districts, representing a notable share of March 2025 deals, while hybrids enjoy a sweet spot; Toyota’s hybrid-only passenger range all but guarantees abundant, fuel-sipping stock by 2027. The Australian used car market size for hybrids widened between 2024 and 2025 as residual-value premiums tightened against petrol equivalents.
Looking ahead, the New Vehicle Efficiency Standard will accelerate the shift. Dealers anticipate a two-speed depreciation curve: low-emission cars hold value, whereas high-emission SUVs face steeper markdowns. Lenders already bake lower residual-value risk into loan pricing for hybrids and BEVs, subtly nudging buyer demand toward electrified powertrains.
By Body Type: SUV Supremacy Faces Niche Competition
Sport Utility Vehicles (SUVs) cemented a 74.18% share in 2025, driven by one-car households that require flexibility for school runs and regional trips. March 2025 used-SUV transactions jumped 16.5% month on month to 85,083 units, confirming the depth of demand even in inflationary settings. Still, multi-purpose vehicles and utes are forecast to log a 12.03% CAGR by 2031 as fleets rotate pandemic-era purchases and BYD’s plug-in ute platform enters mainstream awareness. Traditional diesel double-cabs lose shine when weighed against rising fuel and registration costs, yet utes remain irreplaceable for trades where payload ratings outrank economy.
Sedans and hatchbacks, although eclipsed by SUVs, remain the backbone of entry-level budgets. The Corolla, i30, and Mazda 3 models maintain high liquidity, and their relatively low running costs appeal to first-time buyers. Vans and buses benefit from e-commerce expansion and city logistics contracts, but small base volumes cap their market influence. The divergence underlines how the Australian used car market caters to parallel value propositions: lifestyle flexibility, commercial utility, and affordability.
By Sales Channel: Clicks Rise, Bricks Remain Critical
Offline formats accounted for 75.21% of 2025 trades, but online channels booked the strongest growth at 14.35% CAGR by 2031. In FY 2024, Carsales facilitated a significant volume of vehicle transactions, utilizing structured data feeds to help dealers assess lead creditworthiness before the buyer's arrival. However, physical interactions remain crucial: a majority of online consumers demand a test drive before finalizing payment. Auctions play a pivotal role in wholesale clearings, particularly for corporate and finance repossessions with easily documented provenance. Meanwhile, private C2C transactions, once the frontrunner, have declined in major cities, primarily due to increased awareness of warranties.
The hybrid model is set to prevail. Dealers that synchronize digital advertising with in-store service slots convert leads faster and improve accessory attach rates. Conversely, pure-play online entrants such as Cars24 must now establish physical handover hubs to achieve parity with dealer lots in terms of inspection, highlighting convergence rather than displacement within the Australian used car market.
Geography Analysis
New South Wales secured 32.13% of the 2025 transaction value, benefiting from Sydney’s dense dealer networks, auction infrastructure, and headquarters of major aggregators. Listings in the state climbed in January 2025, signaling supply momentum that tempers price inflation. Victoria, buoyed by Melbourne's robust employment landscape and deep-rooted finance sector, recorded significant sales in January 2025. Meanwhile, Western Australia, thanks to its resource-sector payrolls, mitigated the challenges of distance-driven logistics and achieved notable sales in March 2025.
Queensland is the standout for growth, set to expand at a 11.04% CAGR through 2031. Population inflow—125,845 residents in 2023-2024, nearly 60% of whom arrived from overseas—has boosted vehicle demand in the Sunshine Coast, Ipswich, and Logan corridors. Adding to the momentum, a registration-fee rebate introduced in 2024 has made vehicle purchases more affordable. With southeast Queensland's population anticipated to grow steadily in the coming years, the demand trajectory looks promising. Furthermore, as regional migration trends favor SUVs and dual-cab utes for their versatility, the state's vehicle parc is witnessing a diverse range of powertrains.
South Australia and Tasmania, while smaller, present stable markets. Adelaide's initiative of an open-data policy on monthly ownership transfers enhances price transparency. In Hobart, the city's limited geography leads to higher residual values, thanks to constrained supply. The ACT saw a robust surge in sales recently, a testament to the region's public-sector job security and above-average disposable income. The Northern Territory, with its relatively low monthly trades, remains a niche player. Yet, buoyed by elevated mining wages, it boasts high average transaction values. As the New Vehicle Efficiency Standard comes into play, expect a widening geographic divide: urban drivers will likely lean towards low-emission models, while those in remote areas may continue to favor the reliability of diesel.
Regulatory Landscape
Australia's used-car transactions sit under the Competition and Consumer Act 2010 (Cth) and the Australian Consumer Law (ACL), with the Australian Competition and Consumer Commission (ACCC) providing national enforcement and guidance for new and second-hand car sales and related repair obligations. State and territory bodies layer on dealer licensing and trading rules through frameworks such as the Motor Dealers and Repairers Act 2013 (NSW) and the Motor Vehicle Traders Act 2011 (Tasmania), creating a multi-jurisdiction compliance burden for dealers operating across borders.
Regulatory scrutiny also extends into financing and add-on products commonly bundled into used-car sales. The Australian Securities and Investments Commission (ASIC) regulates financial products and services connected to vehicle purchases, including consumer credit and warranties, while the ACCC continues to publish consumer-facing guidance and issue-focused materials, including a December 2025 report on consumer issues in the second-hand car market. The overlap increases the value of standardized disclosures, inspection documentation, and complaint-handling processes, which are easier for organized and CPO-enabled retailers to operationalize at scale.
Value Chain Analysis
The Australia used-car value chain starts with supply formation from trade-ins at franchise dealers, fleet and rental defleet channels, repossessions, and private sellers, then moves into wholesale price discovery and redistribution through auctions and dealer-to-dealer transfers. Upstream, the system is shaped by Australia's import-led vehicle parc following the 2016-2017 closures of major local manufacturing (Ford, Toyota, and Holden), shifting emphasis toward logistics, dealer distribution networks, and aftermarket services rather than domestic production.
Midstream value is created through inspection and reconditioning (mechanical repairs, detailing, compliance checks), vehicle history checks, and merchandising via digital marketplaces such as Carsales and Gumtree, along with dealer websites and omnichannel storefronts. Downstream, conversion increasingly depends on integrated finance, warranty and consumer-guarantee administration under the ACL, and last-mile delivery or handover hubs for online-led sellers, while aftersales service networks and warranty-claims management shape repeat purchase behavior and reputational outcomes. As online channels expand and CPO programs scale, data quality (vehicle history and battery health for EVs), reconditioning throughput, and interstate transport costs become key cost and differentiation levers across the chain.
Competitive Landscape
The market exhibits moderate concentration, with the top five organized players accounting for a notable share of transaction value. Meanwhile, hundreds of semi-organized independents and thousands of private sellers fill the remaining niches. Eagers Automotive, through easyauto123, commands a significant national share and leverages centralized reconditioning hubs to realize scale efficiencies. Its October 2025 capital tie-up with Mitsubishi Corporation provides both expansion bankroll and upstream procurement leverage [4].
Carsales dominates the digital funnel. Its AUD 500 million (USD 329.40 million) rights issue in March 2023 funded a controlling stake in Brazil’s Webmotors, giving it cross-border data leverage and underwriting continued investment in valuation algorithms. Pickles Auctions fulfils the wholesale linchpin role, moving thousands of ex-fleet vehicles and setting pricing benchmarks referenced by lenders.
White-space opportunities center on battery-health certification and last-mile logistics. Cars24’s rapid-payment pledge pressures incumbents to cut settlement windows, amplifying digital warfare on user experience. Independents increasingly partner with fintech firms like Plenti and Stratton Finance to overlay instant credit approvals on Gumtree or Facebook Marketplace listings. Regulatory reforms that mandate national vehicle-history sharing or battery metrics would likely favor well-capitalized chains that can absorb compliance systems, thereby accelerating consolidation inside the Australia used car market.
Australia Used Car Industry Leaders
-
Cars24
-
CarsGuide Media Solutions Pty Ltd
-
Gumtree AU Pty Ltd
-
Cartopia Pty Ltd
-
Carsales Australia
- *Disclaimer: Major Players sorted in no particular order
Market Opportunities and Future Outlook
A large, fragmented dealer base, over 10,000 licensed car dealers as of 30 June 2025, creates room for tools and services that standardize compliance, disclosures, and customer remedies across thousands of small operators. The ACCC's December 2025 report on consumer issues in second-hand cars highlighted recurring problems around poor-quality vehicles, non-compliance with legal obligations, and difficulties in consumers obtaining remedies, reinforcing whitespace for scalable inspection regimes, clearer condition reporting, and faster dispute-resolution workflows that can be embedded into dealer management systems and online marketplaces.
Opportunities also center on assurance layers that reduce perceived risk in online-led purchases, including stronger return policies, transparent warranty coverage, and verified vehicle-history presentation that aligns with ACL obligations. With regulators actively monitoring extended warranties and motor-vehicle finance tied to second-hand transactions, platforms and dealers that present compliant product disclosure, affordability checks, and clear complaint pathways within a single digital journey can improve lead conversion. Separately, the lack of uniform battery-state-of-health disclosures continues to dampen used-EV confidence, leaving a service gap for battery diagnostics, certification, and remarketing playbooks tailored to hybrids and BEVs entering trade-in channels.
Recent Industry Developments
- June 2026: Cars24 Australia launched an end-of-financial-year sale across approximately 30% of inventory with discounts up to AUD 5,000, plus a Price Match Guarantee and a 30-day return policy. The move adds price aggressive offers to online listings, accelerating transaction velocity. It tests price-competitive positioning and consumer trust through guarantees.
- March 2026: Cars24 Australia launched industry-first 30-day return guarantee for used vehicles (days 8 - 30 with service fee; full refund within first 7 days). The guarantee enhances trust and differentiates the marketplace through post-purchase assurance.
- February 2026: CAR Group (carsales platform operator) reported 8% revenue growth in its Australian business segment for H1 FY26, driven by growth in lead volumes and premium product uptake. The strength of end-to-end platform capabilities in the Australia used-car market is underscored, and the result signals a durable integrated financing and lead-generation model affecting competitive dynamics.
Research Methodology Framework and Report Scope
Market Definition and Coverage
For this study, the market covers the value of used passenger vehicles sold in Australia through dealer-led and consumer-to-consumer transactions. We count the market at the transaction price in USD, aligned to the period when ownership changes hands.
Scope exclusions: We exclude heavy commercial vehicles and motorcycles. We also exclude pure servicing, insurance, and financing revenues that sit outside the used vehicle sale itself.
Segmentation Overview
- By Vendor Type
- Organized
- Semi-Organized Independents
- Unorganized
- By Fuel Type
- Petrol
- Diesel
- Hybrid
- Electric
- Others (CNG, Fuel Cell Electric, etc.)
- By Body Type
- Hatchback
- Sedan
- Sport Utility Vehicle
- Multi Purpose Vehicles and Utes
- By Sales Channel
- Online
- Offline
- Franchise Dealer
- Independent Dealer
- Auction
- C2C
- By Region
- New South Wales
- Victoria
- Queensland
- Western Australia
- South Australia
- Tasmania
- Northern Territory
- Australian Capital Territory
Data Sources, Market Sizing, and Validation
Desk Research
Desk work starts by building a clear picture of how many used vehicles change hands, where they sell, and what prices do over time. We rely on public and official sources such as Australian Bureau of Statistics time series on prices and household indicators, state and territory registration and transfer statistics, Australian Taxation Office guidance that affects transaction reporting, and trade association publications that summarize retail activity.
To tighten pricing and mix assumptions, we also review auction and remarketing market updates, consumer and dealer listing indicators, and company filings and investor materials from major retail groups (where available) to understand inventory cycles and margin pressure. A paid subscription for company financials and news is used to sanity check revenue direction and major events, and patent databases are reviewed selectively for signals around inspection and digital retail workflows. These examples are not exhaustive, and many other public sources were also used to collect data, validate assumptions, and clarify open questions.
Primary Interviews and Surveys
Primary work focuses on verifying what the secondary data cannot show completely, especially the split between dealer and private sales, realized transaction pricing versus advertised prices, and how quickly supply moves across states. We spoke with dealer operators, independent sellers, auction participants, logistics partners, and industry advisors across Australia so gaps in volumes, discounts, and channel behavior could be checked against practical experiences.
These discussions also helped confirm the direction of key drivers, such as affordability pressure, inventory availability, and used-to-new substitution. We then narrowed down the most realistic ranges before finalizing the model.
Distribution of primary research fieldwork respondents
| Company type | Respondent position |
|---|---|
| Top tier: 37% | CXOs: 21% |
| Mid tier: 42% | Functional/Unit leaders: 38% |
| Smaller Players: 21% | Managers: 41% |
Market-Sizing & Forecasting
Sizing starts with a top-down build where national used-vehicle transfer volumes are reconstructed, and then applied to an implied average transaction value. That value is adjusted by vehicle mix, age bands, and state-level patterns. Once the total market value is formed, we corroborate it with selective bottom-up approximations, such as sampled dealer throughput times average selling prices, auction clearance signals translated into resale value bands, and channel checks on private-sale discounting versus dealer pricing.
Inputs that matter most include used vehicle transfer volumes, movement in average transaction price (and the gap between list and sell prices), share of online-assisted transactions, stock turn or days-to-sell, and the shifting mix across fuel types and body styles as supply changes. For the forecast, we use scenario analysis supported by expert consensus. The base case is anchored to macro indicators that influence replacement cycles and credit conditions, and then adjusted for expected normalization in pricing indexes. Where bottom-up inputs are missing for smaller regions or informal sales pockets, we fill gaps using observed state shares and price ladders, and then re-check totals so the implied national picture stays consistent.
Data Validation & Update Cycle
Outputs are checked against independent signals so the final number does not depend on one data series, and then variances are investigated until the drivers can be explained. We look for anomalies such as sudden price jumps that do not match listings or auction indexes, or volume shifts that do not align with registration transfer patterns. When a gap cannot be reconciled, we re-contact sources.
Before sign-off, the model goes through multi-step analyst review, where assumptions, conversions to USD, and year alignment are checked line by line. The report is refreshed annually, and interim updates are added when material events meaningfully change pricing, volumes, or channel behavior. Right before delivery, we complete a fresh validation pass so clients receive an updated view.
Mordor Intelligence's Australia Used Car Market Sizing Compared With Other Published Estimates
Published market values for used cars can vary a lot because not everyone counts the same vehicles, uses the same selling channels, or measures prices on the same basis. The timing of refresh can also change what is captured. Differences usually show up when one estimate leans on listed prices, another focuses on retail-only activity, and another mixes in adjacent vehicle classes.
The main gap comes from whether private sales, dealer sales, and auction-driven transactions are all counted at realized transaction values. Mordor Intelligence treats the market as the full used passenger-vehicle resale pool in Australia, anchoring the model to transfer volumes and validated pricing movements rather than advertised asks.
Benchmark comparison
| Source | Market Size | Gaps in Research Methodology |
|---|---|---|
| Mordor Intelligence | USD 49.86 B (2026) | |
| Industry Association A | USD 77.20 B (2024) | This figure is typically derived from advertised listing values and broad retail activity summaries, which can overstate the market when negotiated discounts, delist-to-sale conversions, and age cutoffs are not consistently applied. |
| Global Consultancy B | USD 28.32 B (2024) | This estimate commonly reflects only organized dealer turnover, and it can undercount the total market when private transfers, informal channels, and auction-to-retail flows are excluded or treated as non-revenue activity. |
Taken together, the spread is mostly explained by channel inclusion and price basis, and then amplified by which year is treated as the reference point. Our approach stays traceable because the total value is built from transfer-driven volumes and pricing checks that can be repeated, and then adjusted only when field feedback supports a change in mix or discounting behavior.
Key Questions Answered in the Report
How large is the Australia used car market in 2026?
The Australia used car market size reached USD 49.86 billion in 2026 and is projected to grow at a 10.28% CAGR to USD 81.32 billion by 2031.
Which vendor segment is growing the fastest?
Semi-organized independents are growing at 11.59% CAGR through 2031, outpacing all other vendor categories due to digital listing adoption and flexible finance tie-ups.
What body type dominates current used-vehicle sales?
SUVs dominate, holding 74.18% share of 2025 transactions thanks to their versatility and continued popularity among family and lifestyle buyers.
How quickly are electric cars penetrating the secondary market?
Electric vehicles are forecast to register a 19.12% CAGR through 2031.
Which state offers the strongest growth outlook?
Queensland leads with an 11.04% CAGR forecast, powered by interstate migration, infrastructure investment, and targeted registration-fee reductions.
What is the main barrier to used-EV adoption?
Lack of standardized battery-health certification drives range-anxiety concerns and accelerates price depreciation for high-mileage electric models.